Oklahoma City Airbnb Market Analysis 2026: Short Term Rental Data & Vacation Rental Statistics in Oklahoma, United States
Is Airbnb profitable in Oklahoma City in 2026? Explore comprehensive Airbnb analytics for Oklahoma City, Oklahoma, United States to uncover income potential. This 2026 STR market report for Oklahoma City, based on AirROI data from February 2025 to January 2026, reveals key trends in the bustling market of 1,507 active listings.
Whether you're considering an Airbnb investment in Oklahoma City, optimizing your existing vacation rental, or exploring rental arbitrage opportunities, understanding the Oklahoma City Airbnb data is crucial. Understanding the local regulations is key to maximizing your short term rental income potential. Let's dive into the specifics.
Key Oklahoma City Airbnb Performance Metrics Overview
Monthly Airbnb Revenue Variations & Income Potential in Oklahoma City (2026)
Understanding the monthly revenue variations for Airbnb listings in Oklahoma City is key to maximizing your short term rental income potential. Seasonality significantly impacts earnings. Our analysis, based on data from the past 12 months, shows that the peak revenue month for STRs in Oklahoma City is typically June, while February often presents the lowest earnings, highlighting opportunities for strategic pricing adjustments during shoulder and low seasons. Explore the typical Airbnb income in Oklahoma City across different performance tiers:
- Best-in-class properties (Top 10%) achieve $4,522+ monthly, often utilizing dynamic pricing and superior guest experiences.
- Strong performing properties (Top 25%) earn $2,976 or more, indicating effective management and desirable locations/amenities.
- Typical properties (Median) generate around $1,872 per month, representing the average market performance.
- Entry-level properties (Bottom 25%) see earnings around $977, often with potential for optimization.
Average Monthly Airbnb Earnings Trend in Oklahoma City
Oklahoma City Airbnb Occupancy Rate Trends (2026)
Maximize your bookings by understanding the Oklahoma City STR occupancy trends. Seasonal demand shifts significantly influence how often properties are booked. Typically, Junesees the highest demand (peak season occupancy), while January experiences the lowest (low season). Effective strategies, like adjusting minimum stays or offering promotions, can boost occupancy during slower periods. Here's how different property tiers perform in Oklahoma City:
- Best-in-class properties (Top 10%) achieve 82%+ occupancy, indicating high desirability and potentially optimized availability.
- Strong performing properties (Top 25%) maintain 67% or higher occupancy, suggesting good market fit and guest satisfaction.
- Typical properties (Median) have an occupancy rate around 48%.
- Entry-level properties (Bottom 25%) average 26% occupancy, potentially facing higher vacancy.
Average Monthly Occupancy Rate Trend in Oklahoma City
Average Daily Rate (ADR) Airbnb Trends in Oklahoma City (2026)
Effective short term rental pricing strategy in Oklahoma City involves understanding monthly ADR fluctuations. The Average Daily Rate (ADR) for Airbnb in Oklahoma City typically peaks in November and dips lowest during February. Leveraging Airbnb dynamic pricing tools or strategies based on this seasonality can significantly boost revenue. Here's a look at the typical nightly rates achieved:
- Best-in-class properties (Top 10%) command rates of $261+ per night, often due to premium features or locations.
- Strong performing properties (Top 25%) achieve nightly rates of $178 or more.
- Typical properties (Median) charge around $120 per night.
- Entry-level properties (Bottom 25%) earn around $84 per night.
Average Daily Rate (ADR) Trend by Month in Oklahoma City
Get Live Oklahoma City Market Intelligence 👇

Explore Real-time Analytics
Airbnb Seasonality Analysis & Trends in Oklahoma City (2026)
Peak Season (June, July, November)
- Revenue averages $2,684 per month
- Occupancy rates average 51.0%
- Daily rates average $159
Shoulder Season
- Revenue averages $2,376 per month
- Occupancy maintains around 47.6%
- Daily rates hold near $154
Low Season (January, February, April)
- Revenue drops to average $1,823 per month
- Occupancy decreases to average 42.8%
- Daily rates adjust to average $144
Seasonality Insights for Oklahoma City
- The Airbnb seasonality in Oklahoma City shows moderate seasonality with distinct peak and low periods. While the sections above show seasonal averages, it's also insightful to look at the extremes:
- During the high season, the absolute peak month showcases Oklahoma City's highest earning potential, with monthly revenues capable of climbing to $2,781, occupancy reaching a high of 53.1%, and ADRs peaking at $168.
- Conversely, the slowest single month of the year, typically falling within the low season, marks the market's lowest point. In this month, revenue might dip to $1,591, occupancy could drop to 36.2%, and ADRs may adjust down to $135.
- Understanding both the seasonal averages and these monthly peaks and troughs in revenue, occupancy, and ADR is crucial for maximizing your Airbnb profit potential in Oklahoma City.
Seasonal Strategies for Maximizing Profit
- Peak Season: Maximize revenue through premium pricing and potentially longer minimum stays. Ensure high availability.
- Low Season: Offer competitive pricing, special promotions (e.g., extended stay discounts), and flexible cancellation policies. Target off-season travelers like remote workers or budget-conscious guests.
- Shoulder Seasons: Implement dynamic pricing that balances peak and low rates. Target weekend travelers or specific events. Offer slightly more flexible terms than peak season.
- Regularly analyze your own performance against these Oklahoma City seasonality benchmarks and adjust your pricing and availability strategy accordingly.
Best Areas for Airbnb Investment in Oklahoma City (2026)
Exploring the top neighborhoods for short-term rentals in Oklahoma City? This section highlights key areas, outlining why they are attractive for hosts and guests, along with notable local attractions. Consider these locations based on your target guest profile and investment strategy.
| Neighborhood / Area | Why Host Here? (Target Guests & Appeal) | Key Attractions & Landmarks |
|---|---|---|
| Bricktown | A revitalized area with a vibrant arts scene, restaurants, and nightlife. Attracts tourists looking for a mix of culture and leisure along the canal. | Bricktown Canal, Chickasaw Bricktown Ballpark, American Indian Cultural Center, Myriad Botanical Gardens, Oklahoma City Museum of Art |
| Paseo Arts District | A unique neighborhood known for its historic buildings, art galleries, and cultural events. Perfect for visitors interested in local art and community. | Paseo Art Gallery, Paseo Arts Festival, local shops and studios, artist residences, Paseo district eateries |
| Midtown | A trendy and walkable neighborhood filled with restaurants, bars, and shops. Popular for its vibrant nightlife and community events. | Centennial Park, local breweries, Oklahoma City Farmers Market, The StarSpace46, Midtown Shopping |
| Northwest Oklahoma City | Family-friendly area with parks and good schools. Appeals to visitors looking for a suburban feel with proximity to city attractions. | Lake Hefner, Fishing and sailing, Hefner Park, Wildlife Refuges, local shopping centers |
| Downtown | The heart of the city with high energy and business centers. Attracts both tourists and business travelers for its convenience and amenities. | Devon Tower, Cox Convention Center, City Park, Route 66 Park, Busker's Cafe and Grill |
| Capitol Hill | A historic district with a growing number of restaurants and cultural venues. Great for those wanting to experience local history and community life. | Oklahoma State Capitol, local eateries, historical buildings, festivals and events, Civic Center Music Hall |
| The Village | A charming area with a suburban atmosphere, parks, and family activities. Suitable for travelers wanting a quiet stay with local charm. | The Village Shopping Center, local parks, community events, family-friendly activities, Oklahoma City Zoo nearby |
| Uptown 23rd | A rapidly developing area known for its trendy bars, restaurants, and unique shops. Attracts a younger crowd and evening visitors. | The Tower Theatre, local boutiques, restaurants and nightlife, Uptown Grocery, annual events |
Understanding Airbnb License Requirements & STR Laws in Oklahoma City (2026)
With 12% of listings showing registration in 2026, understanding potential Airbnb license requirements is crucial in Oklahoma City. Always verify the latest short term rental regulations and Airbnb license requirements directly with local government authorities for Oklahoma City to ensure full compliance before hosting.
(Source: AirROI data, 2026, based on 12% licensed listings)
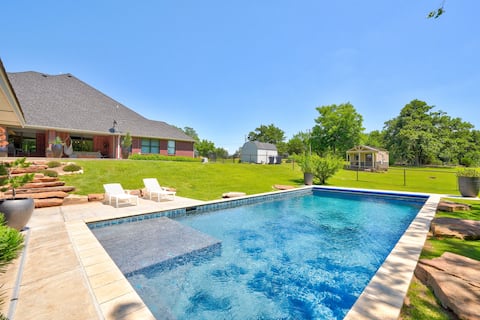
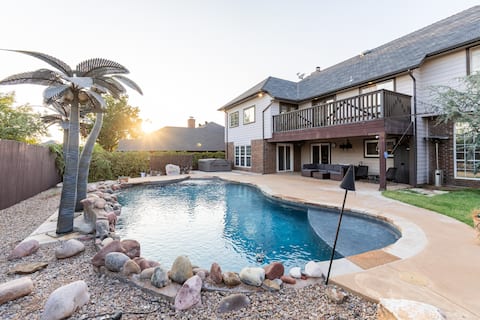
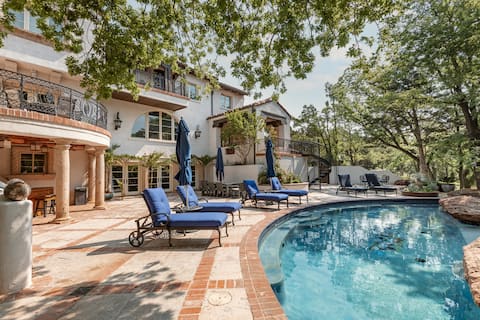
Top Performing Airbnb Properties in Oklahoma City (2026)
Benchmark your potential! Explore examples of top-performing Airbnb properties in Oklahoma Citybased on Trailing Twelve Month (TTM) revenue. Analyze their characteristics, revenue, occupancy rate, and ADR to understand what drives success in this market.
Oasis with Pool. House + 2 Cabins
Entire Place • 6 bedrooms

OKC Private 2-Cabin Compound on 5 Acres
Entire Place • 6 bedrooms

Lakefront Infinity POOL | HOT TUB | LAKE VIEWS
Entire Place • 4 bedrooms
Gaillardia Golf|4100SF|TRIPLE-KING|POOL|Game Room
Entire Place • 5 bedrooms

Gaillardia GOLF OASIS | TRI-KING |POOL| Game Room
Entire Place • 5 bedrooms
The Dream
Entire Place • 5 bedrooms
Note: Performance varies based on location, size, amenities, seasonality, and management quality. Data reflects the past 12 months.
Top Performing Airbnb Hosts in Oklahoma City (2026)
Learn from the best! This table showcases top-performing Airbnb hosts in Oklahoma City based on the number of properties managed and estimated total revenue over the past year. Analyze their scale and performance metrics.
| Host Name | Properties | Grossing Revenue | Stay Reviews | Avg Rating |
|---|---|---|---|---|
| Kevin & Sarah | 40 | $1,558,360 | 5220 | 4.83/5.0 |
| Scarlet | 40 | $1,246,527 | 5435 | 4.81/5.0 |
| A Real Home Away | 32 | $786,592 | 527 | 4.86/5.0 |
| Son | 27 | $778,733 | 2793 | 4.88/5.0 |
| Toshi Stay | 34 | $762,812 | 2518 | 4.78/5.0 |
| Jay | 20 | $660,482 | 1151 | 4.92/5.0 |
| Jeremy | 20 | $577,584 | 1155 | 4.84/5.0 |
| Libby | 13 | $568,990 | 446 | 4.83/5.0 |
| Mike | 4 | $532,193 | 381 | 4.72/5.0 |
| Alyssa | 19 | $469,544 | 998 | 4.88/5.0 |
Analyzing the strategies of top hosts, such as their property selection, pricing, and guest communication, can offer valuable lessons for optimizing your own Airbnb operations in Oklahoma City.
Dive Deeper: Advanced Oklahoma City STR Market Data (2026)
Ready to unlock more insights? AirROI provides access to advanced metrics and comprehensive Airbnb data for Oklahoma City. Explore detailed analytics beyond this report to refine your investment strategy, optimize pricing, and maximize your vacation rental profits.
Explore Advanced MetricsOklahoma City Short-Term Rental Market Composition (2026): Property & Room Types
Room Type Distribution
Property Type Distribution
Market Composition Insights for Oklahoma City
- The Oklahoma City Airbnb market composition is heavily skewed towards Entire Home/Apt listings, which make up 92% of the 1,507 active rentals. This indicates strong guest preference for privacy and space.
- Looking at the property type distribution in Oklahoma City, House properties are the most common (68.1%), reflecting the local real estate landscape.
- Houses represent a significant 68.1% portion, catering likely to families or larger groups.
- Smaller segments like hotel/boutique, others, outdoor/unique, unique stays (combined 8.9%) offer potential for unique stay experiences.
Oklahoma City Airbnb Room Capacity Analysis (2026): Bedroom Distribution
Distribution of Listings by Number of Bedrooms
Room Capacity Insights for Oklahoma City
- The dominant room capacity in Oklahoma City is 3 bedrooms listings, making up 27.4% of the market. This suggests a strong demand for properties suitable for families or small groups.
- Together, 3 bedrooms and 1 bedroom properties represent 52.7% of the active Airbnb listings in Oklahoma City, indicating a high concentration in these sizes.
- A significant 40.6% of listings offer 3+ bedrooms, catering to larger groups and families seeking more space in Oklahoma City.
Oklahoma City Vacation Rental Guest Capacity Trends (2026)
Distribution of Listings by Guest Capacity
Guest Capacity Insights for Oklahoma City
- The most common guest capacity trend in Oklahoma City vacation rentals is listings accommodating 8+ guests (21.3%). This suggests the primary traveler segment is likely larger groups.
- Properties designed for 8+ guests and 2 guests dominate the Oklahoma City STR market, accounting for 40.7% of listings.
- 43.9% of properties accommodate 6+ guests, serving the market segment for larger families or group travel in Oklahoma City.
- On average, properties in Oklahoma City are equipped to host 4.7 guests.
Oklahoma City Airbnb Booking Patterns (2026): Available vs. Booked Days
Available Days Distribution
Booked Days Distribution
Booking Pattern Insights for Oklahoma City
- The most common availability pattern in Oklahoma City falls within the 271-366 days range, representing 36.6% of listings. This suggests many properties have significant open periods on their calendars.
- Approximately 70.3% of listings show high availability (181+ days open annually), indicating potential for increased bookings or specific owner usage patterns.
- For booked days, the 91-180 days range is most frequent in Oklahoma City (33%), reflecting common guest stay durations or potential owner blocking patterns.
- A notable 31.9% of properties secure long booking periods (181+ days booked per year), highlighting successful long-term rental strategies or significant owner usage.
Oklahoma City Airbnb Minimum Stay Requirements Analysis
Distribution of Listings by Minimum Night Requirement
1 Night
507 listings
33.6% of total
2 Nights
364 listings
24.2% of total
3 Nights
77 listings
5.1% of total
4-6 Nights
75 listings
5% of total
7-29 Nights
139 listings
9.2% of total
30+ Nights
345 listings
22.9% of total
Key Insights
- The most prevalent minimum stay requirement in Oklahoma City is 1 Night, adopted by 33.6% of listings. This highlights the market's preference for shorter, flexible bookings.
- A significant segment (22.9%) caters to monthly stays (30+ nights) in Oklahoma City, pointing to opportunities in the extended-stay market.
Recommendations
- Align with the market by considering a 1 Night minimum stay, as 33.6% of Oklahoma City hosts use this setting.
- Explore offering discounts for stays of 30+ nights to attract the 22.9% of the market seeking extended stays.
- Adjust minimum nights based on seasonality – potentially shorter during low season and longer during peak demand periods in Oklahoma City.
Oklahoma City Airbnb Cancellation Policy Trends Analysis (2026)
Super Strict 30 Days
1 listings
0.1% of total
Limited
14 listings
0.9% of total
Flexible
467 listings
31.1% of total
Moderate
582 listings
38.7% of total
Firm
349 listings
23.2% of total
Strict
91 listings
6.1% of total
Cancellation Policy Insights for Oklahoma City
- The prevailing Airbnb cancellation policy trend in Oklahoma City is Moderate, used by 38.7% of listings.
- There's a relatively balanced mix between guest-friendly (69.8%) and stricter (29.3%) policies, offering choices for different guest needs.
- Strict cancellation policies are quite rare (6.1%), potentially making listings with this policy less competitive unless justified by high demand or property type.
Recommendations for Hosts
- Consider adopting a Moderate policy to align with the 38.7% market standard in Oklahoma City.
- Using a Strict policy might deter some guests, as only 6.1% of listings use it. Evaluate if potential revenue protection outweighs possible lower booking rates.
- Regularly review your cancellation policy against competitors and market demand shifts in Oklahoma City.
Oklahoma City STR Booking Lead Time Analysis (2026)
Average Booking Lead Time by Month
Booking Lead Time Insights for Oklahoma City
- The overall average booking lead time for vacation rentals in Oklahoma City is 29 days.
- Guests book furthest in advance for stays during May (average 40 days), likely coinciding with peak travel demand or local events.
- The shortest booking windows occur for stays in February (average 17 days), indicating more last-minute travel plans during this time.
- Seasonally, Spring (34 days avg.) sees the longest lead times, while Winter (22 days avg.) has the shortest, reflecting typical travel planning cycles.
Recommendations for Hosts
- Use the overall average lead time (29 days) as a baseline for your pricing and availability strategy in Oklahoma City.
- For May stays, consider implementing length-of-stay discounts or slightly higher rates for bookings made less than 40 days out to capitalize on advance planning.
- Target marketing efforts for the Spring season well in advance (at least 34 days) to capture early planners.
- Monitor your own booking lead times against these Oklahoma City averages to identify opportunities for dynamic pricing adjustments.
Popular & Essential Airbnb Amenities in Oklahoma City (2026)
Amenity Prevalence
Amenity Insights for Oklahoma City
- Essential amenities in Oklahoma City that guests expect include: Wifi, Air conditioning, Smoke alarm, TV, Free parking on premises. Lacking these (any) could significantly impact bookings.
- Popular amenities like Heating, Kitchen, Hot water are common but not universal. Offering these can provide a competitive edge.
Recommendations for Hosts
- Ensure your listing includes all essential amenities for Oklahoma City: Wifi, Air conditioning, Smoke alarm, TV, Free parking on premises.
- Prioritize adding missing essentials: Wifi, Air conditioning, Smoke alarm, TV, Free parking on premises.
- Consider adding popular differentiators like Heating or Kitchen to increase appeal.
- Highlight unique or less common amenities you offer (e.g., hot tub, dedicated workspace, EV charger) in your listing description and photos.
- Regularly check competitor amenities in Oklahoma City to stay competitive.
Oklahoma City Airbnb Guest Demographics & Profile Analysis (2026)
Guest Profile Summary for Oklahoma City
- The typical guest profile for Airbnb in Oklahoma City consists of primarily domestic travelers (97%), often arriving from nearby Oklahoma City, typically belonging to the Post-2000s (Gen Z/Alpha) group (50%), primarily speaking English or Spanish.
- Domestic travelers account for 97.4% of guests.
- Key international markets include United States (97.4%) and Canada (0.3%).
- Top languages spoken are English (76.1%) followed by Spanish (13.5%).
- A significant demographic segment is the Post-2000s (Gen Z/Alpha) group, representing 50% of guests.
Recommendations for Hosts
- Target domestic marketing efforts towards travelers from Oklahoma City and Tulsa.
- Tailor amenities and listing descriptions to appeal to the dominant Post-2000s (Gen Z/Alpha) demographic (e.g., highlight fast WiFi, smart home features, local guides).
- Highlight unique local experiences or amenities relevant to the primary guest profile.
- Consider seasonal promotions aligned with peak travel times for key origin markets.
Nearby Short-Term Rental Market Comparison
How does the Oklahoma City Airbnb market stack up against its neighbors? Compare key performance metrics like average monthly revenue, ADR, and occupancy rates in surrounding areas to understand the broader regional STR landscape.
| Market | Active Properties | Monthly Revenue | Daily Rate | Avg. Occupancy |
|---|---|---|---|---|
| Skiatook | 11 | $2,296 | $220.68 | 38% |
| Bethany | 14 | $2,271 | $229.76 | 47% |
| Madill | 12 | $2,241 | $219.77 | 41% |
| Medicine Park | 113 | $2,193 | $187.56 | 39% |
| Edmond | 193 | $2,191 | $170.58 | 48% |
| Ardmore | 40 | $2,131 | $168.83 | 46% |
| Norman | 395 | $2,129 | $244.31 | 37% |
| The Village | 44 | $1,992 | $160.72 | 48% |
| Newcastle | 10 | $1,981 | $242.50 | 39% |
| Mustang | 17 | $1,923 | $154.13 | 48% |