Lawton Airbnb Market Analysis 2026: Short Term Rental Data & Vacation Rental Statistics in Oklahoma, United States
Is Airbnb profitable in Lawton in 2026? Explore comprehensive Airbnb analytics for Lawton, Oklahoma, United States to uncover income potential. This 2026 STR market report for Lawton, based on AirROI data from February 2025 to January 2026, reveals key trends in the market of 321 active listings.
Whether you're considering an Airbnb investment in Lawton, optimizing your existing vacation rental, or exploring rental arbitrage opportunities, understanding the Lawton Airbnb data is crucial. Leveraging the low regulation environment is key to maximizing your short term rental income potential. Let's dive into the specifics.
Key Lawton Airbnb Performance Metrics Overview
Monthly Airbnb Revenue Variations & Income Potential in Lawton (2026)
Understanding the monthly revenue variations for Airbnb listings in Lawton is key to maximizing your short term rental income potential. Seasonality significantly impacts earnings. Our analysis, based on data from the past 12 months, shows that the peak revenue month for STRs in Lawton is typically June, while January often presents the lowest earnings, highlighting opportunities for strategic pricing adjustments during shoulder and low seasons. Explore the typical Airbnb income in Lawton across different performance tiers:
- Best-in-class properties (Top 10%) achieve $3,388+ monthly, often utilizing dynamic pricing and superior guest experiences.
- Strong performing properties (Top 25%) earn $2,325 or more, indicating effective management and desirable locations/amenities.
- Typical properties (Median) generate around $1,525 per month, representing the average market performance.
- Entry-level properties (Bottom 25%) see earnings around $860, often with potential for optimization.
Average Monthly Airbnb Earnings Trend in Lawton
Lawton Airbnb Occupancy Rate Trends (2026)
Maximize your bookings by understanding the Lawton STR occupancy trends. Seasonal demand shifts significantly influence how often properties are booked. Typically, Junesees the highest demand (peak season occupancy), while January experiences the lowest (low season). Effective strategies, like adjusting minimum stays or offering promotions, can boost occupancy during slower periods. Here's how different property tiers perform in Lawton:
- Best-in-class properties (Top 10%) achieve 79%+ occupancy, indicating high desirability and potentially optimized availability.
- Strong performing properties (Top 25%) maintain 62% or higher occupancy, suggesting good market fit and guest satisfaction.
- Typical properties (Median) have an occupancy rate around 46%.
- Entry-level properties (Bottom 25%) average 27% occupancy, potentially facing higher vacancy.
Average Monthly Occupancy Rate Trend in Lawton
Average Daily Rate (ADR) Airbnb Trends in Lawton (2026)
Effective short term rental pricing strategy in Lawton involves understanding monthly ADR fluctuations. The Average Daily Rate (ADR) for Airbnb in Lawton typically peaks in November and dips lowest during February. Leveraging Airbnb dynamic pricing tools or strategies based on this seasonality can significantly boost revenue. Here's a look at the typical nightly rates achieved:
- Best-in-class properties (Top 10%) command rates of $187+ per night, often due to premium features or locations.
- Strong performing properties (Top 25%) achieve nightly rates of $138 or more.
- Typical properties (Median) charge around $107 per night.
- Entry-level properties (Bottom 25%) earn around $86 per night.
Average Daily Rate (ADR) Trend by Month in Lawton
Get Live Lawton Market Intelligence 👇

Explore Real-time Analytics
Airbnb Seasonality Analysis & Trends in Lawton (2026)
Peak Season (June, October, July)
- Revenue averages $2,226 per month
- Occupancy rates average 49.0%
- Daily rates average $129
Shoulder Season
- Revenue averages $1,912 per month
- Occupancy maintains around 47.4%
- Daily rates hold near $122
Low Season (January, February, December)
- Revenue drops to average $1,498 per month
- Occupancy decreases to average 38.8%
- Daily rates adjust to average $123
Seasonality Insights for Lawton
- The Airbnb seasonality in Lawton shows moderate seasonality with distinct peak and low periods. While the sections above show seasonal averages, it's also insightful to look at the extremes:
- During the high season, the absolute peak month showcases Lawton's highest earning potential, with monthly revenues capable of climbing to $2,344, occupancy reaching a high of 50.1%, and ADRs peaking at $131.
- Conversely, the slowest single month of the year, typically falling within the low season, marks the market's lowest point. In this month, revenue might dip to $1,343, occupancy could drop to 33.3%, and ADRs may adjust down to $112.
- Understanding both the seasonal averages and these monthly peaks and troughs in revenue, occupancy, and ADR is crucial for maximizing your Airbnb profit potential in Lawton.
Seasonal Strategies for Maximizing Profit
- Peak Season: Maximize revenue through premium pricing and potentially longer minimum stays. Ensure high availability.
- Low Season: Offer competitive pricing, special promotions (e.g., extended stay discounts), and flexible cancellation policies. Target off-season travelers like remote workers or budget-conscious guests.
- Shoulder Seasons: Implement dynamic pricing that balances peak and low rates. Target weekend travelers or specific events. Offer slightly more flexible terms than peak season.
- Regularly analyze your own performance against these Lawton seasonality benchmarks and adjust your pricing and availability strategy accordingly.
Best Areas for Airbnb Investment in Lawton (2026)
Exploring the top neighborhoods for short-term rentals in Lawton? This section highlights key areas, outlining why they are attractive for hosts and guests, along with notable local attractions. Consider these locations based on your target guest profile and investment strategy.
| Neighborhood / Area | Why Host Here? (Target Guests & Appeal) | Key Attractions & Landmarks |
|---|---|---|
| Historic District | Charming neighborhood with rich history and well-preserved architecture, attracting visitors interested in Lawton's past and culture. | Comanche National Museum and Cultural Center, Fort Sill National Historic Landmark, Lawton Arts for All Festival, Central Mall, Museum of the Great Plains |
| Near Elmer Thomas Park | A popular area for families and outdoor enthusiasts, featuring parks and recreational spaces that draw visitors looking for leisure and activities. | Elmer Thomas Park, Lawton Farmers Market, Lawton Community Theater, Comanche County Fairgrounds, Lake Lawtonka |
| Downtown Lawton | The vibrant heart of the city with restaurants, shops, and nightlife, appealing to those looking for convenience and local flavor. | Lawton City Hall, Arts and Cultural Center, Gordon Cooper Library, Lawton Marketplace, Local dining options |
| Cache Road | A major commercial corridor with convenient access to several shopping and dining options, making it attractive for tourists and business travelers. | Central Mall, Various restaurants, Shopping centers, Cinemas, Nearby hotels |
| Fort Sill Area | Close proximity to the military base draws military families and visitors for events and graduations, creating a steady demand for short-term rentals. | Fort Sill, Lawton Animal Park, VFW Post 5263, Military museums, Community events |
| Lake Lawtonka | Popular destination for nature lovers and outdoor activities, ideal for tourists seeking recreation in a scenic environment. | Lake Lawtonka, Hiking trails, Fishing spots, Picnic areas, Water activities |
| Near Great Plains Coliseum | Location for various events and exhibitions, attracting visitors who need nearby accommodation for concerts, shows, and fairs. | Great Plains Coliseum, Exhibitions and events, Local vendors, Food stands, Community events |
| Southwest Lawton | A growing neighborhood with new developments and attractions, appealing to visitors looking for modern amenities and conveniences. | Shopping centers, Restaurants, Parks, Community facilities, Recreational areas |
Understanding Airbnb License Requirements & STR Laws in Lawton (2026)
While Lawton, Oklahoma, United States currently shows low STR regulations, specific Airbnb license requirements might still exist or change. Always verify the latest short term rental regulations and Airbnb license requirements directly with local government authorities for Lawton to ensure full compliance before hosting.
(Source: AirROI data, 2026, based on 0% licensed listings)
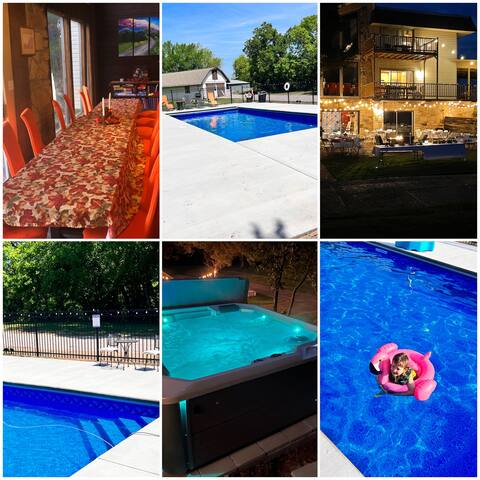
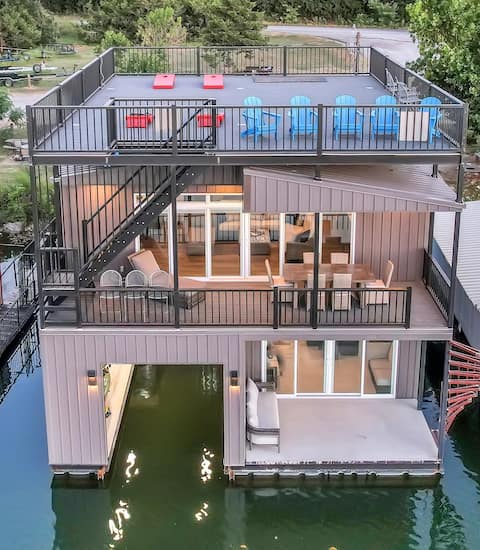
Top Performing Airbnb Properties in Lawton (2026)
Benchmark your potential! Explore examples of top-performing Airbnb properties in Lawtonbased on Trailing Twelve Month (TTM) revenue. Analyze their characteristics, revenue, occupancy rate, and ADR to understand what drives success in this market.

Book the Lodge-Pool-hot tub 4 king,14 bed, dine 24
Entire Place • 5 bedrooms
The Lodge-pool-Hot tub-7 BR, 6BA, dine 24,sleep 30
Entire Place • 7 bedrooms

Book Main Wichita Mountains Lodge by Medicine Pk
Entire Place • 2 bedrooms
Luxurious Lakehouse Living
Entire Place • 3 bedrooms

Prairie View
Entire Place • 4 bedrooms

TMJ Comfort Stay
Entire Place • 4 bedrooms
Note: Performance varies based on location, size, amenities, seasonality, and management quality. Data reflects the past 12 months.
Top Performing Airbnb Hosts in Lawton (2026)
Learn from the best! This table showcases top-performing Airbnb hosts in Lawton based on the number of properties managed and estimated total revenue over the past year. Analyze their scale and performance metrics.
| Host Name | Properties | Grossing Revenue | Stay Reviews | Avg Rating |
|---|---|---|---|---|
| Blake | 5 | $544,000 | 376 | 4.93/5.0 |
| Ryan | 26 | $428,429 | 778 | 4.94/5.0 |
| Stevens | 31 | $274,746 | 1009 | 4.26/5.0 |
| Kelly | 8 | $159,018 | 801 | 4.93/5.0 |
| Richard | 7 | $102,875 | 168 | 4.94/5.0 |
| Kc | 7 | $93,511 | 283 | 4.71/5.0 |
| Hollie | 4 | $86,842 | 220 | 4.85/5.0 |
| Fernanda D | 6 | $82,744 | 280 | 4.59/5.0 |
| Cecilia | 8 | $80,794 | 124 | 4.91/5.0 |
| Evolve | 6 | $78,111 | 85 | 4.54/5.0 |
Analyzing the strategies of top hosts, such as their property selection, pricing, and guest communication, can offer valuable lessons for optimizing your own Airbnb operations in Lawton.
Dive Deeper: Advanced Lawton STR Market Data (2026)
Ready to unlock more insights? AirROI provides access to advanced metrics and comprehensive Airbnb data for Lawton. Explore detailed analytics beyond this report to refine your investment strategy, optimize pricing, and maximize your vacation rental profits.
Explore Advanced MetricsLawton Short-Term Rental Market Composition (2026): Property & Room Types
Room Type Distribution
Property Type Distribution
Market Composition Insights for Lawton
- The Lawton Airbnb market composition is heavily skewed towards Entire Home/Apt listings, which make up 99.1% of the 321 active rentals. This indicates strong guest preference for privacy and space.
- Looking at the property type distribution in Lawton, House properties are the most common (69.2%), reflecting the local real estate landscape.
- Houses represent a significant 69.2% portion, catering likely to families or larger groups.
- Smaller segments like hotel/boutique, outdoor/unique (combined 3.2%) offer potential for unique stay experiences.
Lawton Airbnb Room Capacity Analysis (2026): Bedroom Distribution
Distribution of Listings by Number of Bedrooms
Room Capacity Insights for Lawton
- The dominant room capacity in Lawton is 3 bedrooms listings, making up 34% of the market. This suggests a strong demand for properties suitable for families or small groups.
- Together, 3 bedrooms and 2 bedrooms properties represent 61.7% of the active Airbnb listings in Lawton, indicating a high concentration in these sizes.
- A significant 43.4% of listings offer 3+ bedrooms, catering to larger groups and families seeking more space in Lawton.
Lawton Vacation Rental Guest Capacity Trends (2026)
Distribution of Listings by Guest Capacity
Guest Capacity Insights for Lawton
- The most common guest capacity trend in Lawton vacation rentals is listings accommodating 6 guests (27.1%). This suggests the primary traveler segment is likely larger groups.
- Properties designed for 6 guests and 4 guests dominate the Lawton STR market, accounting for 48.6% of listings.
- 51.0% of properties accommodate 6+ guests, serving the market segment for larger families or group travel in Lawton.
- On average, properties in Lawton are equipped to host 5.1 guests.
Lawton Airbnb Booking Patterns (2026): Available vs. Booked Days
Available Days Distribution
Booked Days Distribution
Booking Pattern Insights for Lawton
- The most common availability pattern in Lawton falls within the 181-270 days range, representing 38.6% of listings. This suggests many properties have significant open periods on their calendars.
- Approximately 75.0% of listings show high availability (181+ days open annually), indicating potential for increased bookings or specific owner usage patterns.
- For booked days, the 91-180 days range is most frequent in Lawton (39.6%), reflecting common guest stay durations or potential owner blocking patterns.
- A notable 25.6% of properties secure long booking periods (181+ days booked per year), highlighting successful long-term rental strategies or significant owner usage.
Lawton Airbnb Minimum Stay Requirements Analysis
Distribution of Listings by Minimum Night Requirement
1 Night
80 listings
24.9% of total
2 Nights
124 listings
38.6% of total
3 Nights
20 listings
6.2% of total
4-6 Nights
10 listings
3.1% of total
7-29 Nights
31 listings
9.7% of total
30+ Nights
56 listings
17.4% of total
Key Insights
- The most prevalent minimum stay requirement in Lawton is 2 Nights, adopted by 38.6% of listings. This highlights the market's preference for shorter, flexible bookings.
- A strong majority (63.5%) of the Lawton Airbnb data shows acceptance of very short stays (1-2 nights), indicating a dynamic, high-turnover market.
- A significant segment (17.4%) caters to monthly stays (30+ nights) in Lawton, pointing to opportunities in the extended-stay market.
Recommendations
- Align with the market by considering a 2 Nights minimum stay, as 38.6% of Lawton hosts use this setting.
- If feasible, allowing 1-night stays, especially midweek or during low season, could capture last-minute bookings, as only 24.9% currently do.
- Explore offering discounts for stays of 30+ nights to attract the 17.4% of the market seeking extended stays.
- Adjust minimum nights based on seasonality – potentially shorter during low season and longer during peak demand periods in Lawton.
Lawton Airbnb Cancellation Policy Trends Analysis (2026)
Limited
3 listings
0.9% of total
Super Strict 30 Days
1 listings
0.3% of total
Flexible
65 listings
20.2% of total
Moderate
69 listings
21.5% of total
Firm
148 listings
46.1% of total
Strict
35 listings
10.9% of total
Cancellation Policy Insights for Lawton
- The prevailing Airbnb cancellation policy trend in Lawton is Firm, used by 46.1% of listings.
- A majority (57.0%) of hosts in Lawton utilize Firm or Strict policies, indicating a market where hosts prioritize booking security.
Recommendations for Hosts
- Consider adopting a Firm policy to align with the 46.1% market standard in Lawton.
- Using a Strict policy might deter some guests, as only 10.9% of listings use it. Evaluate if potential revenue protection outweighs possible lower booking rates.
- Regularly review your cancellation policy against competitors and market demand shifts in Lawton.
Lawton STR Booking Lead Time Analysis (2026)
Average Booking Lead Time by Month
Booking Lead Time Insights for Lawton
- The overall average booking lead time for vacation rentals in Lawton is 21 days.
- Guests book furthest in advance for stays during August (average 27 days), likely coinciding with peak travel demand or local events.
- The shortest booking windows occur for stays in December (average 17 days), indicating more last-minute travel plans during this time.
- Seasonally, Summer (24 days avg.) sees the longest lead times, while Winter (17 days avg.) has the shortest, reflecting typical travel planning cycles.
Recommendations for Hosts
- Use the overall average lead time (21 days) as a baseline for your pricing and availability strategy in Lawton.
- Target marketing efforts for the Summer season well in advance (at least 24 days) to capture early planners.
- Monitor your own booking lead times against these Lawton averages to identify opportunities for dynamic pricing adjustments.
Popular & Essential Airbnb Amenities in Lawton (2026)
Amenity Prevalence
Amenity Insights for Lawton
- Essential amenities in Lawton that guests expect include: Air conditioning, Wifi, TV, Free parking on premises, Kitchen, Heating. Lacking these (any) could significantly impact bookings.
- Popular amenities like Smoke alarm, Hot water, Refrigerator are common but not universal. Offering these can provide a competitive edge.
Recommendations for Hosts
- Ensure your listing includes all essential amenities for Lawton: Air conditioning, Wifi, TV, Free parking on premises, Kitchen, Heating.
- Prioritize adding missing essentials: Wifi, TV, Free parking on premises, Kitchen, Heating.
- Consider adding popular differentiators like Smoke alarm or Hot water to increase appeal.
- Highlight unique or less common amenities you offer (e.g., hot tub, dedicated workspace, EV charger) in your listing description and photos.
- Regularly check competitor amenities in Lawton to stay competitive.
Lawton Airbnb Guest Demographics & Profile Analysis (2026)
Guest Profile Summary for Lawton
- The typical guest profile for Airbnb in Lawton consists of primarily domestic travelers (97%), often arriving from nearby Dallas, typically belonging to the Post-2000s (Gen Z/Alpha) group (50%), primarily speaking English or Spanish.
- Domestic travelers account for 96.6% of guests.
- Key international markets include United States (96.6%) and Puerto Rico (0.5%).
- Top languages spoken are English (74.7%) followed by Spanish (17.8%).
- A significant demographic segment is the Post-2000s (Gen Z/Alpha) group, representing 50% of guests.
Recommendations for Hosts
- Target domestic marketing efforts towards travelers from Dallas and Oklahoma City.
- Tailor amenities and listing descriptions to appeal to the dominant Post-2000s (Gen Z/Alpha) demographic (e.g., highlight fast WiFi, smart home features, local guides).
- Highlight unique local experiences or amenities relevant to the primary guest profile.
- Consider seasonal promotions aligned with peak travel times for key origin markets.
Nearby Short-Term Rental Market Comparison
How does the Lawton Airbnb market stack up against its neighbors? Compare key performance metrics like average monthly revenue, ADR, and occupancy rates in surrounding areas to understand the broader regional STR landscape.
| Market | Active Properties | Monthly Revenue | Daily Rate | Avg. Occupancy |
|---|---|---|---|---|
| Valley View | 25 | $5,111 | $484.73 | 39% |
| Flower Mound | 79 | $3,760 | $326.24 | 45% |
| Highland Village | 15 | $3,363 | $345.42 | 48% |
| Graham | 64 | $3,208 | $422.63 | 37% |
| Corinth | 20 | $3,098 | $261.99 | 43% |
| Roanoke | 12 | $3,015 | $233.00 | 42% |
| Sanger | 20 | $2,755 | $278.26 | 38% |
| Lake Dallas | 22 | $2,742 | $255.01 | 42% |
| Muenster | 10 | $2,562 | $289.49 | 31% |
| Lewisville | 156 | $2,471 | $221.79 | 47% |