Jenks Airbnb Market Analysis 2026: Short Term Rental Data & Vacation Rental Statistics in Oklahoma, United States
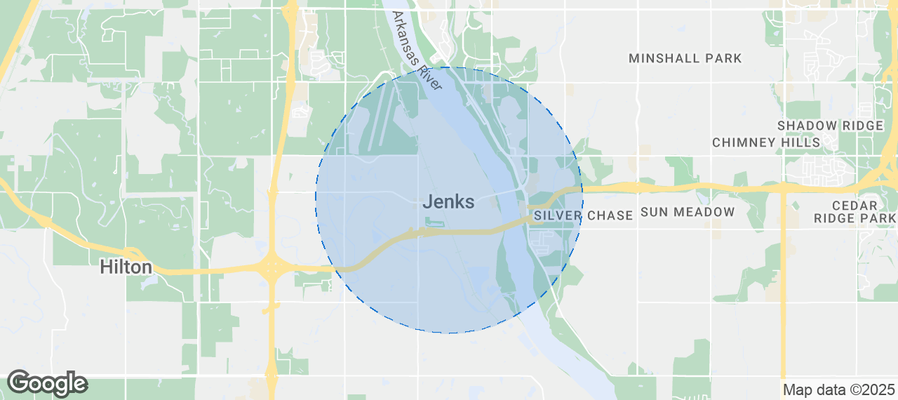
Is Airbnb profitable in Jenks in 2026? Explore comprehensive Airbnb analytics for Jenks, Oklahoma, United States to uncover income potential. This 2026 STR market report for Jenks, based on AirROI data from February 2025 to January 2026, reveals key trends in the niche market of 29 active listings.
Whether you're considering an Airbnb investment in Jenks, optimizing your existing vacation rental, or exploring rental arbitrage opportunities, understanding the Jenks Airbnb data is crucial. Leveraging the low regulation environment is key to maximizing your short term rental income potential. Let's dive into the specifics.
Key Jenks Airbnb Performance Metrics Overview
Monthly Airbnb Revenue Variations & Income Potential in Jenks (2026)
Understanding the monthly revenue variations for Airbnb listings in Jenks is key to maximizing your short term rental income potential. Seasonality significantly impacts earnings. Our analysis, based on data from the past 12 months, shows that the peak revenue month for STRs in Jenks is typically October, while January often presents the lowest earnings, highlighting opportunities for strategic pricing adjustments during shoulder and low seasons. Explore the typical Airbnb income in Jenks across different performance tiers:
- Best-in-class properties (Top 10%) achieve $5,223+ monthly, often utilizing dynamic pricing and superior guest experiences.
- Strong performing properties (Top 25%) earn $3,547 or more, indicating effective management and desirable locations/amenities.
- Typical properties (Median) generate around $2,358 per month, representing the average market performance.
- Entry-level properties (Bottom 25%) see earnings around $1,552, often with potential for optimization.
Average Monthly Airbnb Earnings Trend in Jenks
Jenks Airbnb Occupancy Rate Trends (2026)
Maximize your bookings by understanding the Jenks STR occupancy trends. Seasonal demand shifts significantly influence how often properties are booked. Typically, Maysees the highest demand (peak season occupancy), while January experiences the lowest (low season). Effective strategies, like adjusting minimum stays or offering promotions, can boost occupancy during slower periods. Here's how different property tiers perform in Jenks:
- Best-in-class properties (Top 10%) achieve 80%+ occupancy, indicating high desirability and potentially optimized availability.
- Strong performing properties (Top 25%) maintain 70% or higher occupancy, suggesting good market fit and guest satisfaction.
- Typical properties (Median) have an occupancy rate around 50%.
- Entry-level properties (Bottom 25%) average 31% occupancy, potentially facing higher vacancy.
Average Monthly Occupancy Rate Trend in Jenks
Average Daily Rate (ADR) Airbnb Trends in Jenks (2026)
Effective short term rental pricing strategy in Jenks involves understanding monthly ADR fluctuations. The Average Daily Rate (ADR) for Airbnb in Jenks typically peaks in October and dips lowest during February. Leveraging Airbnb dynamic pricing tools or strategies based on this seasonality can significantly boost revenue. Here's a look at the typical nightly rates achieved:
- Best-in-class properties (Top 10%) command rates of $347+ per night, often due to premium features or locations.
- Strong performing properties (Top 25%) achieve nightly rates of $236 or more.
- Typical properties (Median) charge around $167 per night.
- Entry-level properties (Bottom 25%) earn around $117 per night.
Average Daily Rate (ADR) Trend by Month in Jenks
Get Live Jenks Market Intelligence 👇
Explore Real-time Analytics
Airbnb Seasonality Analysis & Trends in Jenks (2026)
Peak Season (October, July, November)
- Revenue averages $3,230 per month
- Occupancy rates average 52.3%
- Daily rates average $206
Shoulder Season
- Revenue averages $2,952 per month
- Occupancy maintains around 51.0%
- Daily rates hold near $194
Low Season (January, February, March)
- Revenue drops to average $2,288 per month
- Occupancy decreases to average 47.3%
- Daily rates adjust to average $178
Seasonality Insights for Jenks
- The Airbnb seasonality in Jenks shows moderate seasonality with distinct peak and low periods. While the sections above show seasonal averages, it's also insightful to look at the extremes:
- During the high season, the absolute peak month showcases Jenks's highest earning potential, with monthly revenues capable of climbing to $3,312, occupancy reaching a high of 57.9%, and ADRs peaking at $215.
- Conversely, the slowest single month of the year, typically falling within the low season, marks the market's lowest point. In this month, revenue might dip to $2,111, occupancy could drop to 35.0%, and ADRs may adjust down to $164.
- Understanding both the seasonal averages and these monthly peaks and troughs in revenue, occupancy, and ADR is crucial for maximizing your Airbnb profit potential in Jenks.
Seasonal Strategies for Maximizing Profit
- Peak Season: Maximize revenue through premium pricing and potentially longer minimum stays. Ensure high availability.
- Low Season: Offer competitive pricing, special promotions (e.g., extended stay discounts), and flexible cancellation policies. Target off-season travelers like remote workers or budget-conscious guests.
- Shoulder Seasons: Implement dynamic pricing that balances peak and low rates. Target weekend travelers or specific events. Offer slightly more flexible terms than peak season.
- Regularly analyze your own performance against these Jenks seasonality benchmarks and adjust your pricing and availability strategy accordingly.
Best Areas for Airbnb Investment in Jenks (2026)
Exploring the top neighborhoods for short-term rentals in Jenks? This section highlights key areas, outlining why they are attractive for hosts and guests, along with notable local attractions. Consider these locations based on your target guest profile and investment strategy.
| Neighborhood / Area | Why Host Here? (Target Guests & Appeal) | Key Attractions & Landmarks |
|---|---|---|
| Riverwalk District | Charming area along the river featuring parks, walking trails, and restaurants. Popular with families and nature lovers, offering a serene environment close to the heart of Jenks. | Tulsa Zoo, Jenks Aquarium, Riverwalk Park, Historic Jenks, Fishing spots on the river |
| Downtown Jenks | Vibrant downtown area with local shops, eateries, and entertainment options. Attractive to visitors seeking a local experience and cultural activities. | Jenks Historic Main Street, Local restaurants and cafes, Art galleries, Live music venues, Community events |
| Wildlife Conservation Center | Adjacent to one of the largest wildlife facilities in the area, great for eco-tourism. Visitors interested in nature and wildlife will find this area appealing. | Oklahoma Aquarium, Tulsa Zoo, Wildlife Conservation Center Tours, Nature Trails, Educational Programs |
| Schools District | Home to excellent schools, this area attracts families looking for short-term rentals during school tournaments and events. | Jenks-Union High School Sports Events, Nearby parks and playgrounds, Community family events |
| River Spirit Casino | Close to the casino resort, attracting guests looking for entertainment and nightlife. A popular spot for weekend visitors and events. | River Spirit Casino, Live music and shows, Dining options, Spa services |
| Golf Courses Area | Known for its golf courses and outdoor activities, this area attracts sports enthusiasts and relaxation seekers. | Jenks Golf Course, Outdoor recreational parks, Tennis courts, Nature trails |
| Gathering Place | Just a short drive away, this expansive urban park draws visitors for picnics, activities, and events. Ideal for attracting tourists looking for outdoor experiences. | Gathering Place Park, Outdoor events and concerts, Boat rentals, Playgrounds and gardens |
| Nearby Tulsa | Close proximity to Tulsa offers access to urban amenities and attractions, catering to those looking for both city and suburban experiences. | Tulsa Arts District, Philbrook Museum, Woodward Park, Cultural theaters, Restaurants and nightlife |
Understanding Airbnb License Requirements & STR Laws in Jenks (2026)
While Jenks, Oklahoma, United States currently shows low STR regulations, specific Airbnb license requirements might still exist or change. Always verify the latest short term rental regulations and Airbnb license requirements directly with local government authorities for Jenks to ensure full compliance before hosting.
(Source: AirROI data, 2026, finding no licensed listings among those analyzed)
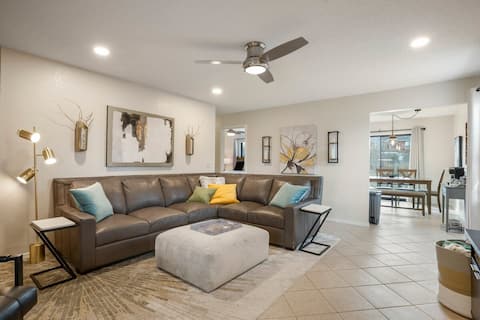
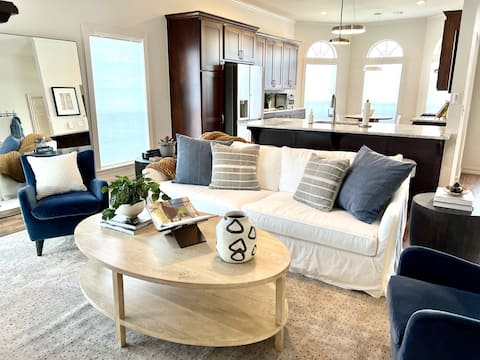
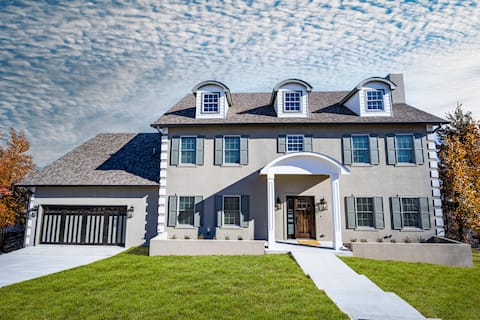
Top Performing Airbnb Properties in Jenks (2026)
Benchmark your potential! Explore examples of top-performing Airbnb properties in Jenksbased on Trailing Twelve Month (TTM) revenue. Analyze their characteristics, revenue, occupancy rate, and ADR to understand what drives success in this market.

Dual Delight; Two Homes
Entire Place • 5 bedrooms
Jenks Spectacular Spain Ranch-Close to Five Oaks
Entire Place • 3 bedrooms
Casa Joya! Professionally Designed Luxury in Jenks
Entire Place • 3 bedrooms
Family Retreat!
Entire Place • 5 bedrooms

Relaxing Jenks Home: Walk to Riverwalk & Aquarium!
Entire Place • 3 bedrooms

Cozy Jenks cottage on Spain Ranch
Entire Place • 3 bedrooms
Note: Performance varies based on location, size, amenities, seasonality, and management quality. Data reflects the past 12 months.
Top Performing Airbnb Hosts in Jenks (2026)
Learn from the best! This table showcases top-performing Airbnb hosts in Jenks based on the number of properties managed and estimated total revenue over the past year. Analyze their scale and performance metrics.
| Host Name | Properties | Grossing Revenue | Stay Reviews | Avg Rating |
|---|---|---|---|---|
| Stephanie | 3 | $172,661 | 411 | 4.97/5.0 |
| Sharon | 1 | $53,934 | 85 | 4.91/5.0 |
| Colton | 1 | $52,375 | 74 | 4.96/5.0 |
| Brooksey | 2 | $47,887 | 21 | 4.93/5.0 |
| Orig, Llc | 1 | $47,188 | 49 | 4.86/5.0 |
| Kyler And Ashley | 2 | $45,339 | 263 | 4.92/5.0 |
| Mary | 1 | $39,420 | 72 | 4.97/5.0 |
| Bronwyn | 1 | $39,150 | 51 | 4.98/5.0 |
| Maurissa | 1 | $33,633 | 129 | 4.81/5.0 |
| Ryan | 1 | $31,178 | 21 | 4.86/5.0 |
Analyzing the strategies of top hosts, such as their property selection, pricing, and guest communication, can offer valuable lessons for optimizing your own Airbnb operations in Jenks.
Dive Deeper: Advanced Jenks STR Market Data (2026)
Ready to unlock more insights? AirROI provides access to advanced metrics and comprehensive Airbnb data for Jenks. Explore detailed analytics beyond this report to refine your investment strategy, optimize pricing, and maximize your vacation rental profits.
Explore Advanced MetricsJenks Short-Term Rental Market Composition (2026): Property & Room Types
Room Type Distribution
Property Type Distribution
Market Composition Insights for Jenks
- The Jenks Airbnb market composition is heavily skewed towards Entire Home/Apt listings, which make up 93.1% of the 29 active rentals. This indicates strong guest preference for privacy and space.
- Looking at the property type distribution in Jenks, House properties are the most common (86.2%), reflecting the local real estate landscape.
- Houses represent a significant 86.2% portion, catering likely to families or larger groups.
- The presence of 6.9% Hotel/Boutique listings indicates integration with traditional hospitality.
Jenks Airbnb Room Capacity Analysis (2026): Bedroom Distribution
Distribution of Listings by Number of Bedrooms
Room Capacity Insights for Jenks
- The dominant room capacity in Jenks is 3 bedrooms listings, making up 48.3% of the market. This suggests a strong demand for properties suitable for families or small groups.
- Together, 3 bedrooms and 5+ bedrooms properties represent 65.5% of the active Airbnb listings in Jenks, indicating a high concentration in these sizes.
- A significant 75.8% of listings offer 3+ bedrooms, catering to larger groups and families seeking more space in Jenks.
Jenks Vacation Rental Guest Capacity Trends (2026)
Distribution of Listings by Guest Capacity
Guest Capacity Insights for Jenks
- The most common guest capacity trend in Jenks vacation rentals is listings accommodating 8+ guests (34.5%). This suggests the primary traveler segment is likely larger groups.
- Properties designed for 8+ guests and 6 guests dominate the Jenks STR market, accounting for 62.1% of listings.
- 75.9% of properties accommodate 6+ guests, serving the market segment for larger families or group travel in Jenks.
- On average, properties in Jenks are equipped to host 5.9 guests.
Jenks Airbnb Booking Patterns (2026): Available vs. Booked Days
Available Days Distribution
Booked Days Distribution
Booking Pattern Insights for Jenks
- The most common availability pattern in Jenks falls within the 91-180 days range, representing 34.5% of listings. This suggests many properties have significant open periods on their calendars.
- Approximately 58.6% of listings show high availability (181+ days open annually), indicating potential for increased bookings or specific owner usage patterns.
- For booked days, the 181-270 days range is most frequent in Jenks (34.5%), reflecting common guest stay durations or potential owner blocking patterns.
- A notable 44.8% of properties secure long booking periods (181+ days booked per year), highlighting successful long-term rental strategies or significant owner usage.
Jenks Airbnb Minimum Stay Requirements Analysis
Distribution of Listings by Minimum Night Requirement
1 Night
9 listings
31% of total
2 Nights
8 listings
27.6% of total
3 Nights
1 listings
3.4% of total
4-6 Nights
3 listings
10.3% of total
7-29 Nights
2 listings
6.9% of total
30+ Nights
6 listings
20.7% of total
Key Insights
- The most prevalent minimum stay requirement in Jenks is 1 Night, adopted by 31% of listings. This highlights the market's preference for shorter, flexible bookings.
- A significant segment (20.7%) caters to monthly stays (30+ nights) in Jenks, pointing to opportunities in the extended-stay market.
Recommendations
- Align with the market by considering a 1 Night minimum stay, as 31% of Jenks hosts use this setting.
- Explore offering discounts for stays of 30+ nights to attract the 20.7% of the market seeking extended stays.
- Adjust minimum nights based on seasonality – potentially shorter during low season and longer during peak demand periods in Jenks.
Jenks Airbnb Cancellation Policy Trends Analysis (2026)
Flexible
7 listings
24.1% of total
Moderate
11 listings
37.9% of total
Firm
10 listings
34.5% of total
Strict
1 listings
3.4% of total
Cancellation Policy Insights for Jenks
- The prevailing Airbnb cancellation policy trend in Jenks is Moderate, used by 37.9% of listings.
- There's a relatively balanced mix between guest-friendly (62.0%) and stricter (37.9%) policies, offering choices for different guest needs.
- Strict cancellation policies are quite rare (3.4%), potentially making listings with this policy less competitive unless justified by high demand or property type.
Recommendations for Hosts
- Consider adopting a Moderate policy to align with the 37.9% market standard in Jenks.
- Using a Strict policy might deter some guests, as only 3.4% of listings use it. Evaluate if potential revenue protection outweighs possible lower booking rates.
- Regularly review your cancellation policy against competitors and market demand shifts in Jenks.
Jenks STR Booking Lead Time Analysis (2026)
Average Booking Lead Time by Month
Booking Lead Time Insights for Jenks
- The overall average booking lead time for vacation rentals in Jenks is 36 days.
- Guests book furthest in advance for stays during July (average 45 days), likely coinciding with peak travel demand or local events.
- The shortest booking windows occur for stays in February (average 22 days), indicating more last-minute travel plans during this time.
- Seasonally, Summer (41 days avg.) sees the longest lead times, while Winter (23 days avg.) has the shortest, reflecting typical travel planning cycles.
Recommendations for Hosts
- Use the overall average lead time (36 days) as a baseline for your pricing and availability strategy in Jenks.
- Target marketing efforts for the Summer season well in advance (at least 41 days) to capture early planners.
- Monitor your own booking lead times against these Jenks averages to identify opportunities for dynamic pricing adjustments.
Popular & Essential Airbnb Amenities in Jenks (2026)
Amenity Prevalence
Amenity Insights for Jenks
- Essential amenities in Jenks that guests expect include: TV, Wifi, Free parking on premises, Air conditioning, Carbon monoxide alarm, Smoke alarm, Dishes and silverware, Hot water. Lacking these (any) could significantly impact bookings.
- Popular amenities like Kitchen, Heating are common but not universal. Offering these can provide a competitive edge.
Recommendations for Hosts
- Ensure your listing includes all essential amenities for Jenks: TV, Wifi, Free parking on premises, Air conditioning, Carbon monoxide alarm, Smoke alarm, Dishes and silverware, Hot water.
- Prioritize adding missing essentials: Carbon monoxide alarm, Smoke alarm, Dishes and silverware, Hot water.
- Consider adding popular differentiators like Kitchen or Heating to increase appeal.
- Highlight unique or less common amenities you offer (e.g., hot tub, dedicated workspace, EV charger) in your listing description and photos.
- Regularly check competitor amenities in Jenks to stay competitive.
Jenks Airbnb Guest Demographics & Profile Analysis (2026)
Guest Profile Summary for Jenks
- The typical guest profile for Airbnb in Jenks consists of primarily domestic travelers (97%), often arriving from nearby Oklahoma City, typically belonging to the Post-2000s (Gen Z/Alpha) group (50%), primarily speaking English or Spanish.
- Domestic travelers account for 97.2% of guests.
- Key international markets include United States (97.2%) and Australia (1%).
- Top languages spoken are English (76.6%) followed by Spanish (8%).
- A significant demographic segment is the Post-2000s (Gen Z/Alpha) group, representing 50% of guests.
Recommendations for Hosts
- Target domestic marketing efforts towards travelers from Oklahoma City and Fayetteville.
- Tailor amenities and listing descriptions to appeal to the dominant Post-2000s (Gen Z/Alpha) demographic (e.g., highlight fast WiFi, smart home features, local guides).
- Highlight unique local experiences or amenities relevant to the primary guest profile.
- Consider seasonal promotions aligned with peak travel times for key origin markets.
Nearby Short-Term Rental Market Comparison
How does the Jenks Airbnb market stack up against its neighbors? Compare key performance metrics like average monthly revenue, ADR, and occupancy rates in surrounding areas to understand the broader regional STR landscape.
| Market | Active Properties | Monthly Revenue | Daily Rate | Avg. Occupancy |
|---|---|---|---|---|
| Carlton Landing | 100 | $3,015 | $417.80 | 29% |
| Little Flock | 17 | $2,955 | $370.27 | 40% |
| Lowell | 30 | $2,905 | $254.69 | 43% |
| Canadian | 44 | $2,897 | $349.28 | 34% |
| Fayetteville | 601 | $2,668 | $258.84 | 40% |
| Bentonville | 739 | $2,640 | $219.38 | 47% |
| Cave Springs | 15 | $2,622 | $146.64 | 62% |
| Hulbert | 20 | $2,536 | $254.57 | 39% |
| Eucha | 51 | $2,492 | $282.33 | 33% |
| Rogers | 385 | $2,465 | $246.52 | 41% |