Hulbert Airbnb Market Analysis 2026: Short Term Rental Data & Vacation Rental Statistics in Oklahoma, United States
Is Airbnb profitable in Hulbert in 2026? Explore comprehensive Airbnb analytics for Hulbert, Oklahoma, United States to uncover income potential. This 2026 STR market report for Hulbert, based on AirROI data from February 2025 to January 2026, reveals key trends in the niche market of 20 active listings.
Whether you're considering an Airbnb investment in Hulbert, optimizing your existing vacation rental, or exploring rental arbitrage opportunities, understanding the Hulbert Airbnb data is crucial. Leveraging the low regulation environment is key to maximizing your short term rental income potential. Let's dive into the specifics.
Key Hulbert Airbnb Performance Metrics Overview
Monthly Airbnb Revenue Variations & Income Potential in Hulbert (2026)
Understanding the monthly revenue variations for Airbnb listings in Hulbert is key to maximizing your short term rental income potential. Seasonality significantly impacts earnings. Our analysis, based on data from the past 12 months, shows that the peak revenue month for STRs in Hulbert is typically July, while January often presents the lowest earnings, highlighting opportunities for strategic pricing adjustments during shoulder and low seasons. Explore the typical Airbnb income in Hulbert across different performance tiers:
- Best-in-class properties (Top 10%) achieve $5,903+ monthly, often utilizing dynamic pricing and superior guest experiences.
- Strong performing properties (Top 25%) earn $3,741 or more, indicating effective management and desirable locations/amenities.
- Typical properties (Median) generate around $2,205 per month, representing the average market performance.
- Entry-level properties (Bottom 25%) see earnings around $1,294, often with potential for optimization.
Average Monthly Airbnb Earnings Trend in Hulbert
Hulbert Airbnb Occupancy Rate Trends (2026)
Maximize your bookings by understanding the Hulbert STR occupancy trends. Seasonal demand shifts significantly influence how often properties are booked. Typically, Julysees the highest demand (peak season occupancy), while April experiences the lowest (low season). Effective strategies, like adjusting minimum stays or offering promotions, can boost occupancy during slower periods. Here's how different property tiers perform in Hulbert:
- Best-in-class properties (Top 10%) achieve 68%+ occupancy, indicating high desirability and potentially optimized availability.
- Strong performing properties (Top 25%) maintain 51% or higher occupancy, suggesting good market fit and guest satisfaction.
- Typical properties (Median) have an occupancy rate around 35%.
- Entry-level properties (Bottom 25%) average 23% occupancy, potentially facing higher vacancy.
Average Monthly Occupancy Rate Trend in Hulbert
Average Daily Rate (ADR) Airbnb Trends in Hulbert (2026)
Effective short term rental pricing strategy in Hulbert involves understanding monthly ADR fluctuations. The Average Daily Rate (ADR) for Airbnb in Hulbert typically peaks in June and dips lowest during February. Leveraging Airbnb dynamic pricing tools or strategies based on this seasonality can significantly boost revenue. Here's a look at the typical nightly rates achieved:
- Best-in-class properties (Top 10%) command rates of $554+ per night, often due to premium features or locations.
- Strong performing properties (Top 25%) achieve nightly rates of $230 or more.
- Typical properties (Median) charge around $164 per night.
- Entry-level properties (Bottom 25%) earn around $124 per night.
Average Daily Rate (ADR) Trend by Month in Hulbert
Get Live Hulbert Market Intelligence 👇

Explore Real-time Analytics
Airbnb Seasonality Analysis & Trends in Hulbert (2026)
Peak Season (July, June, October)
- Revenue averages $3,547 per month
- Occupancy rates average 46.9%
- Daily rates average $258
Shoulder Season
- Revenue averages $2,901 per month
- Occupancy maintains around 39.6%
- Daily rates hold near $252
Low Season (January, February, April)
- Revenue drops to average $1,802 per month
- Occupancy decreases to average 27.7%
- Daily rates adjust to average $243
Seasonality Insights for Hulbert
- The Airbnb seasonality in Hulbert shows highly seasonal trends requiring careful strategy. While the sections above show seasonal averages, it's also insightful to look at the extremes:
- During the high season, the absolute peak month showcases Hulbert's highest earning potential, with monthly revenues capable of climbing to $3,663, occupancy reaching a high of 51.0%, and ADRs peaking at $264.
- Conversely, the slowest single month of the year, typically falling within the low season, marks the market's lowest point. In this month, revenue might dip to $1,645, occupancy could drop to 24.9%, and ADRs may adjust down to $231.
- Understanding both the seasonal averages and these monthly peaks and troughs in revenue, occupancy, and ADR is crucial for maximizing your Airbnb profit potential in Hulbert.
Seasonal Strategies for Maximizing Profit
- Peak Season: Maximize revenue through premium pricing and potentially longer minimum stays. Ensure high availability.
- Low Season: Offer competitive pricing, special promotions (e.g., extended stay discounts), and flexible cancellation policies. Target off-season travelers like remote workers or budget-conscious guests.
- Shoulder Seasons: Implement dynamic pricing that balances peak and low rates. Target weekend travelers or specific events. Offer slightly more flexible terms than peak season.
- Regularly analyze your own performance against these Hulbert seasonality benchmarks and adjust your pricing and availability strategy accordingly.
Best Areas for Airbnb Investment in Hulbert (2026)
Exploring the top neighborhoods for short-term rentals in Hulbert? This section highlights key areas, outlining why they are attractive for hosts and guests, along with notable local attractions. Consider these locations based on your target guest profile and investment strategy.
| Neighborhood / Area | Why Host Here? (Target Guests & Appeal) | Key Attractions & Landmarks |
|---|---|---|
| Green Country | A picturesque region with beautiful lakes and scenic views, perfect for nature lovers and outdoor enthusiasts. It offers a tranquil setting for tourists seeking relaxation and adventure. | Beavers Bend State Park, Broken Bow Lake, Fish Creek, Mt. Nebo State Park, Robbers Cave State Park |
| Grand Lake | A popular freshwater lake known for fishing, boating, and recreational activities. It attracts families and groups looking for a fun-filled getaway with various water activities. | Grand Lake State Park, Honey Creek State Park, Monkey Island, Bernice State Park, Cypress Cove Marina |
| Oklahoma Wildlife Refuge | A stunning location for wildlife viewing and nature photography. Ideal for eco-tourism and those interested in exploring the natural beauty of Oklahoma. | Wichita Mountains Wildlife Refuge, Great Salt Plains State Park, Red Rock Canyon Adventure Park |
| Cherokee Landing State Park | Located on the shores of Lake Tenkiller, it offers a serene environment for boating and fishing. Popular with travelers looking for lakeside accommodations. | Lake Tenkiller, Cherokee Landing State Park, Fishing spots, Scenic hiking trails |
| Hulbert Historic District | Rich in history and charm, this area offers a small-town feel with unique local shops and eateries. Appeals to visitors wanting to experience local culture and history. | Hulbert Historical Museum, Local craft shops, Farmers market, Annual town events |
| Tenkiller Ferry Lake | Known for its stunning clear waters and outdoor recreation opportunities. Great for outdoor lovers looking for activities like swimming, fishing, and hiking. | Tenkiller Ferry Lake State Park, Drowning Creek, Swim beaches, Diving spots, Fishing areas |
| Fort Gibson Lake | Provides a variety of recreational opportunities, including fishing, boating, and camping. Close to historic Fort Gibson, offering a mix of leisure and history. | Fort Gibson Historic Site, Fort Gibson Lake, Fishing and boating areas, Camping grounds |
| Muskogee | A vibrant city with a mix of cultural attractions, shopping, and dining. Just a short drive from Hulbert, making it accessible for tourists looking for diverse experiences. | Honor Heights Park, Muskogee War Memorial Park, Five Civilized Tribes Museum, Muskogee Market |
Understanding Airbnb License Requirements & STR Laws in Hulbert (2026)
While Hulbert, Oklahoma, United States currently shows low STR regulations, specific Airbnb license requirements might still exist or change. Always verify the latest short term rental regulations and Airbnb license requirements directly with local government authorities for Hulbert to ensure full compliance before hosting.
(Source: AirROI data, 2026, finding no licensed listings among those analyzed)
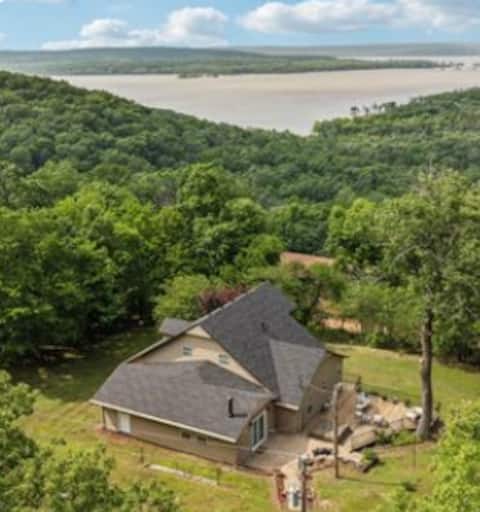
Top Performing Airbnb Properties in Hulbert (2026)
Benchmark your potential! Explore examples of top-performing Airbnb properties in Hulbertbased on Trailing Twelve Month (TTM) revenue. Analyze their characteristics, revenue, occupancy rate, and ADR to understand what drives success in this market.
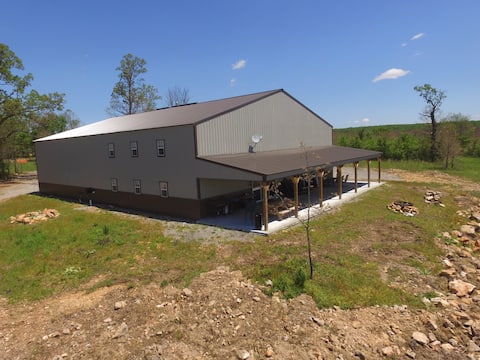
Crystal Creek Ranch - Stunning Lodge on 500 Acres
Entire Place • 6 bedrooms

Spacious Oasis! On the lake, amazing sunsets!
Entire Place • 4 bedrooms

The Lodge on Gray House Farm
Entire Place • 4 bedrooms

Farm House on Gray House Farm
Entire Place • 4 bedrooms
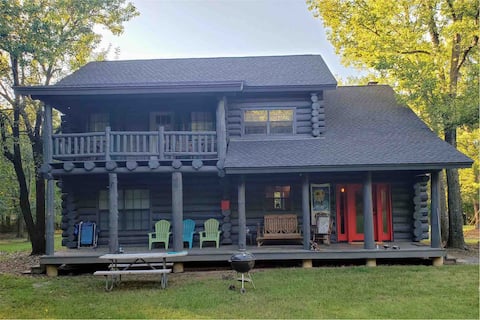
Peaceful Cabin in the Woods
Entire Place • 3 bedrooms
Sunset Valley Lake View
Entire Place • 4 bedrooms
Note: Performance varies based on location, size, amenities, seasonality, and management quality. Data reflects the past 12 months.
Top Performing Airbnb Hosts in Hulbert (2026)
Learn from the best! This table showcases top-performing Airbnb hosts in Hulbert based on the number of properties managed and estimated total revenue over the past year. Analyze their scale and performance metrics.
| Host Name | Properties | Grossing Revenue | Stay Reviews | Avg Rating |
|---|---|---|---|---|
| DeAnna | 4 | $144,027 | 153 | 4.90/5.0 |
| Rebekah | 4 | $138,580 | 584 | 4.79/5.0 |
| Rhett | 1 | $75,239 | 65 | 4.95/5.0 |
| Misty | 3 | $50,565 | 38 | 4.99/5.0 |
| Nita | 1 | $37,538 | 48 | 5.00/5.0 |
| Steve | 1 | $36,467 | 16 | 4.94/5.0 |
| Jim | 1 | $29,755 | 26 | 5.00/5.0 |
| Paul | 1 | $26,801 | 149 | 4.99/5.0 |
| Kevin | 1 | $23,366 | 126 | 4.97/5.0 |
| Larry | 1 | $19,644 | 52 | 4.92/5.0 |
Analyzing the strategies of top hosts, such as their property selection, pricing, and guest communication, can offer valuable lessons for optimizing your own Airbnb operations in Hulbert.
Dive Deeper: Advanced Hulbert STR Market Data (2026)
Ready to unlock more insights? AirROI provides access to advanced metrics and comprehensive Airbnb data for Hulbert. Explore detailed analytics beyond this report to refine your investment strategy, optimize pricing, and maximize your vacation rental profits.
Explore Advanced MetricsHulbert Short-Term Rental Market Composition (2026): Property & Room Types
Room Type Distribution
Property Type Distribution
Market Composition Insights for Hulbert
- The Hulbert Airbnb market composition is heavily skewed towards Entire Home/Apt listings, which make up 100% of the 20 active rentals. This indicates strong guest preference for privacy and space.
- Looking at the property type distribution in Hulbert, House properties are the most common (65%), reflecting the local real estate landscape.
- Houses represent a significant 65% portion, catering likely to families or larger groups.
Hulbert Airbnb Room Capacity Analysis (2026): Bedroom Distribution
Distribution of Listings by Number of Bedrooms
Room Capacity Insights for Hulbert
- The dominant room capacity in Hulbert is 2 bedrooms listings, making up 25% of the market. This suggests a strong demand for properties suitable for couples or solo travelers.
- Together, 2 bedrooms and 3 bedrooms properties represent 50.0% of the active Airbnb listings in Hulbert, indicating a high concentration in these sizes.
- A significant 55.0% of listings offer 3+ bedrooms, catering to larger groups and families seeking more space in Hulbert.
Hulbert Vacation Rental Guest Capacity Trends (2026)
Distribution of Listings by Guest Capacity
Guest Capacity Insights for Hulbert
- The most common guest capacity trend in Hulbert vacation rentals is listings accommodating 8+ guests (50%). This suggests the primary traveler segment is likely larger groups.
- Properties designed for 8+ guests and 6 guests dominate the Hulbert STR market, accounting for 65.0% of listings.
- 70.0% of properties accommodate 6+ guests, serving the market segment for larger families or group travel in Hulbert.
- On average, properties in Hulbert are equipped to host 6.3 guests.
Hulbert Airbnb Booking Patterns (2026): Available vs. Booked Days
Available Days Distribution
Booked Days Distribution
Booking Pattern Insights for Hulbert
- The most common availability pattern in Hulbert falls within the 181-270 days range, representing 70% of listings. This suggests many properties have significant open periods on their calendars.
- Approximately 90.0% of listings show high availability (181+ days open annually), indicating potential for increased bookings or specific owner usage patterns.
- For booked days, the 91-180 days range is most frequent in Hulbert (70%), reflecting common guest stay durations or potential owner blocking patterns.
- A notable 10.0% of properties secure long booking periods (181+ days booked per year), highlighting successful long-term rental strategies or significant owner usage.
Hulbert Airbnb Minimum Stay Requirements Analysis
Distribution of Listings by Minimum Night Requirement
2 Nights
14 listings
70% of total
3 Nights
1 listings
5% of total
30+ Nights
5 listings
25% of total
Key Insights
- The most prevalent minimum stay requirement in Hulbert is 2 Nights, adopted by 70% of listings. This highlights the market's preference for shorter, flexible bookings.
- A strong majority (70.0%) of the Hulbert Airbnb data shows acceptance of very short stays (1-2 nights), indicating a dynamic, high-turnover market.
- A significant segment (25%) caters to monthly stays (30+ nights) in Hulbert, pointing to opportunities in the extended-stay market.
Recommendations
- Align with the market by considering a 2 Nights minimum stay, as 70% of Hulbert hosts use this setting.
- A 2-night minimum appears standard (70%). Consider this for weekends or peak periods.
- Explore offering discounts for stays of 30+ nights to attract the 25% of the market seeking extended stays.
- Adjust minimum nights based on seasonality – potentially shorter during low season and longer during peak demand periods in Hulbert.
Hulbert Airbnb Cancellation Policy Trends Analysis (2026)
Flexible
3 listings
15% of total
Moderate
7 listings
35% of total
Firm
10 listings
50% of total
Cancellation Policy Insights for Hulbert
- The prevailing Airbnb cancellation policy trend in Hulbert is Firm, used by 50% of listings.
- There's a relatively balanced mix between guest-friendly (50.0%) and stricter (50.0%) policies, offering choices for different guest needs.
Recommendations for Hosts
- Consider adopting a Firm policy to align with the 50% market standard in Hulbert.
- Regularly review your cancellation policy against competitors and market demand shifts in Hulbert.
Hulbert STR Booking Lead Time Analysis (2026)
Average Booking Lead Time by Month
Booking Lead Time Insights for Hulbert
- The overall average booking lead time for vacation rentals in Hulbert is 52 days.
- Guests book furthest in advance for stays during September (average 90 days), likely coinciding with peak travel demand or local events.
- The shortest booking windows occur for stays in January (average 13 days), indicating more last-minute travel plans during this time.
- Seasonally, Fall (75 days avg.) sees the longest lead times, while Winter (39 days avg.) has the shortest, reflecting typical travel planning cycles.
Recommendations for Hosts
- Use the overall average lead time (52 days) as a baseline for your pricing and availability strategy in Hulbert.
- For September stays, consider implementing length-of-stay discounts or slightly higher rates for bookings made less than 90 days out to capitalize on advance planning.
- During January, focus on last-minute booking availability and promotions, as guests book with very short notice (13 days avg.).
- Target marketing efforts for the Fall season well in advance (at least 75 days) to capture early planners.
- Monitor your own booking lead times against these Hulbert averages to identify opportunities for dynamic pricing adjustments.
Popular & Essential Airbnb Amenities in Hulbert (2026)
Amenity Prevalence
Amenity Insights for Hulbert
- Essential amenities in Hulbert that guests expect include: Cooking basics, Smoke alarm, Kitchen, Heating, Free parking on premises, Air conditioning, Refrigerator, BBQ grill, Wifi, Hot water. Lacking these (any) could significantly impact bookings.
Recommendations for Hosts
- Ensure your listing includes all essential amenities for Hulbert: Cooking basics, Smoke alarm, Kitchen, Heating, Free parking on premises, Air conditioning, Refrigerator, BBQ grill, Wifi, Hot water.
- Prioritize adding missing essentials: Refrigerator, BBQ grill, Wifi, Hot water.
- Highlight unique or less common amenities you offer (e.g., hot tub, dedicated workspace, EV charger) in your listing description and photos.
- Regularly check competitor amenities in Hulbert to stay competitive.
Hulbert Airbnb Guest Demographics & Profile Analysis (2026)
Guest Profile Summary for Hulbert
- The typical guest profile for Airbnb in Hulbert consists of primarily domestic travelers (99%), often arriving from nearby Tulsa, typically belonging to the Post-2000s (Gen Z/Alpha) group (50%), primarily speaking English or Spanish.
- Domestic travelers account for 98.9% of guests.
- Key international markets include United States (98.9%) and Germany (1.1%).
- Top languages spoken are English (90.2%) followed by Spanish (7.3%).
- A significant demographic segment is the Post-2000s (Gen Z/Alpha) group, representing 50% of guests.
Recommendations for Hosts
- Target domestic marketing efforts towards travelers from Tulsa and Oklahoma City.
- Tailor amenities and listing descriptions to appeal to the dominant Post-2000s (Gen Z/Alpha) demographic (e.g., highlight fast WiFi, smart home features, local guides).
- Highlight unique local experiences or amenities relevant to the primary guest profile.
- Consider seasonal promotions aligned with peak travel times for key origin markets.
Nearby Short-Term Rental Market Comparison
How does the Hulbert Airbnb market stack up against its neighbors? Compare key performance metrics like average monthly revenue, ADR, and occupancy rates in surrounding areas to understand the broader regional STR landscape.
| Market | Active Properties | Monthly Revenue | Daily Rate | Avg. Occupancy |
|---|---|---|---|---|
| McCurtain County | 85 | $5,126 | $519.27 | 35% |
| Broken Bow | 2,882 | $4,449 | $430.98 | 37% |
| Hochatown | 17 | $3,781 | $398.64 | 33% |
| Wilburton | 16 | $3,710 | $294.70 | 39% |
| Carlton Landing | 100 | $3,015 | $417.80 | 29% |
| Little Flock | 17 | $2,955 | $370.27 | 40% |
| Lowell | 30 | $2,905 | $254.69 | 43% |
| Canadian | 44 | $2,897 | $349.28 | 34% |
| Fayetteville | 601 | $2,668 | $258.84 | 40% |
| Bentonville | 739 | $2,640 | $219.38 | 47% |