Zanesville Airbnb Market Analysis 2026: Short Term Rental Data & Vacation Rental Statistics in Ohio, United States
Is Airbnb profitable in Zanesville in 2026? Explore comprehensive Airbnb analytics for Zanesville, Ohio, United States to uncover income potential. This 2026 STR market report for Zanesville, based on AirROI data from February 2025 to January 2026, reveals key trends in the niche market of 32 active listings.
Whether you're considering an Airbnb investment in Zanesville, optimizing your existing vacation rental, or exploring rental arbitrage opportunities, understanding the Zanesville Airbnb data is crucial. Leveraging the low regulation environment is key to maximizing your short term rental income potential. Let's dive into the specifics.
Key Zanesville Airbnb Performance Metrics Overview
Monthly Airbnb Revenue Variations & Income Potential in Zanesville (2026)
Understanding the monthly revenue variations for Airbnb listings in Zanesville is key to maximizing your short term rental income potential. Seasonality significantly impacts earnings. Our analysis, based on data from the past 12 months, shows that the peak revenue month for STRs in Zanesville is typically November, while February often presents the lowest earnings, highlighting opportunities for strategic pricing adjustments during shoulder and low seasons. Explore the typical Airbnb income in Zanesville across different performance tiers:
- Best-in-class properties (Top 10%) achieve $3,894+ monthly, often utilizing dynamic pricing and superior guest experiences.
- Strong performing properties (Top 25%) earn $2,731 or more, indicating effective management and desirable locations/amenities.
- Typical properties (Median) generate around $1,706 per month, representing the average market performance.
- Entry-level properties (Bottom 25%) see earnings around $826, often with potential for optimization.
Average Monthly Airbnb Earnings Trend in Zanesville
Zanesville Airbnb Occupancy Rate Trends (2026)
Maximize your bookings by understanding the Zanesville STR occupancy trends. Seasonal demand shifts significantly influence how often properties are booked. Typically, Octobersees the highest demand (peak season occupancy), while May experiences the lowest (low season). Effective strategies, like adjusting minimum stays or offering promotions, can boost occupancy during slower periods. Here's how different property tiers perform in Zanesville:
- Best-in-class properties (Top 10%) achieve 71%+ occupancy, indicating high desirability and potentially optimized availability.
- Strong performing properties (Top 25%) maintain 57% or higher occupancy, suggesting good market fit and guest satisfaction.
- Typical properties (Median) have an occupancy rate around 36%.
- Entry-level properties (Bottom 25%) average 19% occupancy, potentially facing higher vacancy.
Average Monthly Occupancy Rate Trend in Zanesville
Average Daily Rate (ADR) Airbnb Trends in Zanesville (2026)
Effective short term rental pricing strategy in Zanesville involves understanding monthly ADR fluctuations. The Average Daily Rate (ADR) for Airbnb in Zanesville typically peaks in December and dips lowest during February. Leveraging Airbnb dynamic pricing tools or strategies based on this seasonality can significantly boost revenue. Here's a look at the typical nightly rates achieved:
- Best-in-class properties (Top 10%) command rates of $244+ per night, often due to premium features or locations.
- Strong performing properties (Top 25%) achieve nightly rates of $182 or more.
- Typical properties (Median) charge around $140 per night.
- Entry-level properties (Bottom 25%) earn around $102 per night.
Average Daily Rate (ADR) Trend by Month in Zanesville
Get Live Zanesville Market Intelligence 👇

Explore Real-time Analytics
Airbnb Seasonality Analysis & Trends in Zanesville (2026)
Peak Season (November, July, August)
- Revenue averages $2,498 per month
- Occupancy rates average 43.8%
- Daily rates average $151
Shoulder Season
- Revenue averages $2,006 per month
- Occupancy maintains around 39.6%
- Daily rates hold near $152
Low Season (February, March, May)
- Revenue drops to average $1,487 per month
- Occupancy decreases to average 34.1%
- Daily rates adjust to average $132
Seasonality Insights for Zanesville
- The Airbnb seasonality in Zanesville shows moderate seasonality with distinct peak and low periods. While the sections above show seasonal averages, it's also insightful to look at the extremes:
- During the high season, the absolute peak month showcases Zanesville's highest earning potential, with monthly revenues capable of climbing to $2,546, occupancy reaching a high of 47.2%, and ADRs peaking at $164.
- Conversely, the slowest single month of the year, typically falling within the low season, marks the market's lowest point. In this month, revenue might dip to $1,343, occupancy could drop to 30.0%, and ADRs may adjust down to $128.
- Understanding both the seasonal averages and these monthly peaks and troughs in revenue, occupancy, and ADR is crucial for maximizing your Airbnb profit potential in Zanesville.
Seasonal Strategies for Maximizing Profit
- Peak Season: Maximize revenue through premium pricing and potentially longer minimum stays. Ensure high availability.
- Low Season: Offer competitive pricing, special promotions (e.g., extended stay discounts), and flexible cancellation policies. Target off-season travelers like remote workers or budget-conscious guests.
- Shoulder Seasons: Implement dynamic pricing that balances peak and low rates. Target weekend travelers or specific events. Offer slightly more flexible terms than peak season.
- Regularly analyze your own performance against these Zanesville seasonality benchmarks and adjust your pricing and availability strategy accordingly.
Best Areas for Airbnb Investment in Zanesville (2026)
Exploring the top neighborhoods for short-term rentals in Zanesville? This section highlights key areas, outlining why they are attractive for hosts and guests, along with notable local attractions. Consider these locations based on your target guest profile and investment strategy.
| Neighborhood / Area | Why Host Here? (Target Guests & Appeal) | Key Attractions & Landmarks |
|---|---|---|
| Historic Downtown Zanesville | A charming area rich in history and culture, perfect for guests who want to explore local art, cuisine, and boutique shopping. Its walkability and proximity to attractions make it a desirable spot for visitors. | Zanesville Museum of Art, Bridges of Zanesville, Y Bridge, Muskingum County Library, City Park |
| Zanesville North | This suburban area is popular among families and offers a quiet ambiance. Its location near parks and schools makes it appealing for longer stays and family vacations. | Zanesville Jaycees Pavilion, Lake Isabella, Zane's Landing Park, Parks at a Glance, Local diners |
| East Zanesville | A growing neighborhood with many amenities and services. Convenient for travelers looking for a residential feel with easy access to the city. | East Zanesville Park, Local shopping centers, Restaurants along SR 60, Nearby hiking trails, Community events |
| West Zanesville | Offers a mix of residential and commercial areas, attracting visitors who want a quieter experience while still being a short drive from downtown attractions. | Local breweries, Parks and recreation centers, Community theater, Shopping options, Grocery stores |
| South Zanesville | Lush green spaces and parks define this area. Ideal for guests seeking outdoor activities and nature, while still being close to city amenities. | Zanesville Sports Center, Outdoor parks, Walking trails, Golf courses, Nature reserves |
| North Zanesville | More rural setting with beautiful landscapes, perfect for guests who enjoy tranquility, outdoor exploration, and scenic views. | Muskingum River, Outdoor activities, Nature trails, Local farms, Scenic vistas |
| Duncan Falls | Just a bit outside Zanesville, this peaceful community offers a quaint atmosphere, appealing for those in search of a quiet retreat away from the city hustle. | Local vineyards, Relaxing scenic walks, Community parks, Small-town festivals, Nearby hiking spots |
| Coshocton Avenue | This area provides easy access to main highways and routes, making it convenient for guests traveling through or exploring surrounding regions. | Shopping centers, Restaurants, Nearby gas stations, Fast food options, Hotel amenities |
Understanding Airbnb License Requirements & STR Laws in Zanesville (2026)
While Zanesville, Ohio, United States currently shows low STR regulations, specific Airbnb license requirements might still exist or change. Always verify the latest short term rental regulations and Airbnb license requirements directly with local government authorities for Zanesville to ensure full compliance before hosting.
(Source: AirROI data, 2026, finding no licensed listings among those analyzed)
Top Performing Airbnb Properties in Zanesville (2026)
Benchmark your potential! Explore examples of top-performing Airbnb properties in Zanesvillebased on Trailing Twelve Month (TTM) revenue. Analyze their characteristics, revenue, occupancy rate, and ADR to understand what drives success in this market.
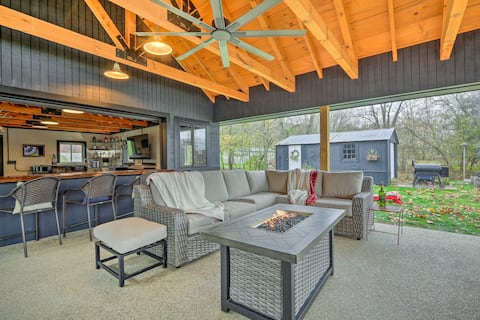
Riverfront Zanesville Getaway w/ Private Bar!
Entire Place • 3 bedrooms

River Escape w/Hottub & Fishing Dock in Zanesville
Entire Place • 2 bedrooms

3BR house with deck on the Muskingum River
Entire Place • 3 bedrooms
Rustic Zanesville Getaway w/ Expansive Yard!
Entire Place • 6 bedrooms

Serene Zanesville Getaway: Hot Tub, 2 Decks!
Entire Place • 3 bedrooms

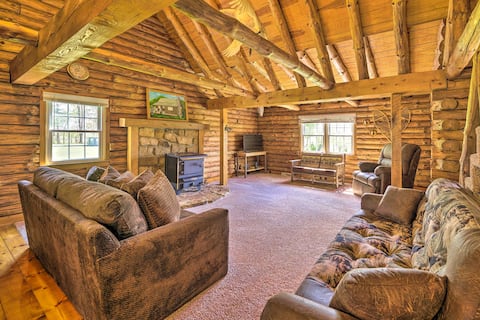
Unique Kabin in the Woods
Entire Place • 2 bedrooms
Note: Performance varies based on location, size, amenities, seasonality, and management quality. Data reflects the past 12 months.
Top Performing Airbnb Hosts in Zanesville (2026)
Learn from the best! This table showcases top-performing Airbnb hosts in Zanesville based on the number of properties managed and estimated total revenue over the past year. Analyze their scale and performance metrics.
| Host Name | Properties | Grossing Revenue | Stay Reviews | Avg Rating |
|---|---|---|---|---|
| Evolve | 7 | $173,651 | 247 | 4.58/5.0 |
| Evolve | 4 | $71,569 | 65 | 4.32/5.0 |
| Rental | 4 | $66,775 | 124 | 4.73/5.0 |
| Chalom | 2 | $50,792 | 51 | 4.72/5.0 |
| Kevin | 1 | $43,382 | 46 | 4.89/5.0 |
| Mark | 2 | $31,479 | 1073 | 4.88/5.0 |
| Natalie | 3 | $31,148 | 41 | 4.84/5.0 |
| Kate | 2 | $29,706 | 127 | 4.96/5.0 |
| Philipp | 1 | $27,102 | 47 | 4.98/5.0 |
| Zachary Drew | 1 | $25,880 | 136 | 4.95/5.0 |
Analyzing the strategies of top hosts, such as their property selection, pricing, and guest communication, can offer valuable lessons for optimizing your own Airbnb operations in Zanesville.
Dive Deeper: Advanced Zanesville STR Market Data (2026)
Ready to unlock more insights? AirROI provides access to advanced metrics and comprehensive Airbnb data for Zanesville. Explore detailed analytics beyond this report to refine your investment strategy, optimize pricing, and maximize your vacation rental profits.
Explore Advanced MetricsZanesville Short-Term Rental Market Composition (2026): Property & Room Types
Room Type Distribution
Property Type Distribution
Market Composition Insights for Zanesville
- The Zanesville Airbnb market composition is heavily skewed towards Entire Home/Apt listings, which make up 96.9% of the 32 active rentals. This indicates strong guest preference for privacy and space.
- Looking at the property type distribution in Zanesville, House properties are the most common (56.3%), reflecting the local real estate landscape.
- Houses represent a significant 56.3% portion, catering likely to families or larger groups.
Zanesville Airbnb Room Capacity Analysis (2026): Bedroom Distribution
Distribution of Listings by Number of Bedrooms
Room Capacity Insights for Zanesville
- The dominant room capacity in Zanesville is 2 bedrooms listings, making up 31.3% of the market. This suggests a strong demand for properties suitable for couples or solo travelers.
- Together, 2 bedrooms and 1 bedroom properties represent 62.6% of the active Airbnb listings in Zanesville, indicating a high concentration in these sizes.
- A significant 34.4% of listings offer 3+ bedrooms, catering to larger groups and families seeking more space in Zanesville.
Zanesville Vacation Rental Guest Capacity Trends (2026)
Distribution of Listings by Guest Capacity
Guest Capacity Insights for Zanesville
- The most common guest capacity trend in Zanesville vacation rentals is listings accommodating 2 guests (21.9%). This suggests the primary traveler segment is likely couples or solo travelers.
- Properties designed for 2 guests and 4 guests dominate the Zanesville STR market, accounting for 43.8% of listings.
- 34.3% of properties accommodate 6+ guests, serving the market segment for larger families or group travel in Zanesville.
- On average, properties in Zanesville are equipped to host 4.6 guests.
Zanesville Airbnb Booking Patterns (2026): Available vs. Booked Days
Available Days Distribution
Booked Days Distribution
Booking Pattern Insights for Zanesville
- The most common availability pattern in Zanesville falls within the 271-366 days range, representing 43.8% of listings. This suggests many properties have significant open periods on their calendars.
- Approximately 81.3% of listings show high availability (181+ days open annually), indicating potential for increased bookings or specific owner usage patterns.
- For booked days, the 91-180 days range is most frequent in Zanesville (37.5%), reflecting common guest stay durations or potential owner blocking patterns.
- A notable 18.8% of properties secure long booking periods (181+ days booked per year), highlighting successful long-term rental strategies or significant owner usage.
Zanesville Airbnb Minimum Stay Requirements Analysis
Distribution of Listings by Minimum Night Requirement
1 Night
6 listings
18.8% of total
2 Nights
15 listings
46.9% of total
3 Nights
1 listings
3.1% of total
7-29 Nights
4 listings
12.5% of total
30+ Nights
6 listings
18.8% of total
Key Insights
- The most prevalent minimum stay requirement in Zanesville is 2 Nights, adopted by 46.9% of listings. This highlights the market's preference for shorter, flexible bookings.
- A strong majority (65.7%) of the Zanesville Airbnb data shows acceptance of very short stays (1-2 nights), indicating a dynamic, high-turnover market.
- A significant segment (18.8%) caters to monthly stays (30+ nights) in Zanesville, pointing to opportunities in the extended-stay market.
Recommendations
- Align with the market by considering a 2 Nights minimum stay, as 46.9% of Zanesville hosts use this setting.
- If feasible, allowing 1-night stays, especially midweek or during low season, could capture last-minute bookings, as only 18.8% currently do.
- A 2-night minimum appears standard (46.9%). Consider this for weekends or peak periods.
- Explore offering discounts for stays of 30+ nights to attract the 18.8% of the market seeking extended stays.
- Adjust minimum nights based on seasonality – potentially shorter during low season and longer during peak demand periods in Zanesville.
Zanesville Airbnb Cancellation Policy Trends Analysis (2026)
Flexible
9 listings
28.1% of total
Moderate
6 listings
18.8% of total
Firm
6 listings
18.8% of total
Strict
11 listings
34.4% of total
Cancellation Policy Insights for Zanesville
- The prevailing Airbnb cancellation policy trend in Zanesville is Strict, used by 34.4% of listings.
- A majority (53.2%) of hosts in Zanesville utilize Firm or Strict policies, indicating a market where hosts prioritize booking security.
Recommendations for Hosts
- Consider adopting a Strict policy to align with the 34.4% market standard in Zanesville.
- With 34.4% using Strict terms, this is a viable option in Zanesville, particularly for high-value properties or during peak demand periods.
- Regularly review your cancellation policy against competitors and market demand shifts in Zanesville.
Zanesville STR Booking Lead Time Analysis (2026)
Average Booking Lead Time by Month
Booking Lead Time Insights for Zanesville
- The overall average booking lead time for vacation rentals in Zanesville is 40 days.
- Guests book furthest in advance for stays during September (average 90 days), likely coinciding with peak travel demand or local events.
- The shortest booking windows occur for stays in February (average 13 days), indicating more last-minute travel plans during this time.
- Seasonally, Fall (62 days avg.) sees the longest lead times, while Winter (23 days avg.) has the shortest, reflecting typical travel planning cycles.
Recommendations for Hosts
- Use the overall average lead time (40 days) as a baseline for your pricing and availability strategy in Zanesville.
- For September stays, consider implementing length-of-stay discounts or slightly higher rates for bookings made less than 90 days out to capitalize on advance planning.
- During February, focus on last-minute booking availability and promotions, as guests book with very short notice (13 days avg.).
- Target marketing efforts for the Fall season well in advance (at least 62 days) to capture early planners.
- Monitor your own booking lead times against these Zanesville averages to identify opportunities for dynamic pricing adjustments.
Popular & Essential Airbnb Amenities in Zanesville (2026)
Amenity Prevalence
Amenity Insights for Zanesville
- Essential amenities in Zanesville that guests expect include: Kitchen, Smoke alarm, Air conditioning. Lacking these (any) could significantly impact bookings.
- Popular amenities like TV, Heating, Hot water are common but not universal. Offering these can provide a competitive edge.
- Warning: Wifi is not universally provided but is considered essential globally. Ensure reliable Wifi is offered.
Recommendations for Hosts
- Ensure your listing includes all essential amenities for Zanesville: Kitchen, Smoke alarm, Air conditioning.
- Prioritize adding missing essentials: Kitchen, Smoke alarm, Air conditioning.
- Consider adding popular differentiators like TV or Heating to increase appeal.
- Highlight unique or less common amenities you offer (e.g., hot tub, dedicated workspace, EV charger) in your listing description and photos.
- Regularly check competitor amenities in Zanesville to stay competitive.
Zanesville Airbnb Guest Demographics & Profile Analysis (2026)
Guest Profile Summary for Zanesville
- The typical guest profile for Airbnb in Zanesville consists of primarily domestic travelers (98%), often arriving from nearby Redwood City, typically belonging to the Post-2000s (Gen Z/Alpha) group (50%), primarily speaking English or Spanish.
- Domestic travelers account for 98.3% of guests.
- Key international markets include United States (98.3%) and Canada (1.1%).
- Top languages spoken are English (90.5%) followed by Spanish (3.2%).
- A significant demographic segment is the Post-2000s (Gen Z/Alpha) group, representing 50% of guests.
Recommendations for Hosts
- Target domestic marketing efforts towards travelers from Redwood City and Columbus.
- Tailor amenities and listing descriptions to appeal to the dominant Post-2000s (Gen Z/Alpha) demographic (e.g., highlight fast WiFi, smart home features, local guides).
- Highlight unique local experiences or amenities relevant to the primary guest profile.
- Consider seasonal promotions aligned with peak travel times for key origin markets.
Nearby Short-Term Rental Market Comparison
How does the Zanesville Airbnb market stack up against its neighbors? Compare key performance metrics like average monthly revenue, ADR, and occupancy rates in surrounding areas to understand the broader regional STR landscape.
| Market | Active Properties | Monthly Revenue | Daily Rate | Avg. Occupancy |
|---|---|---|---|---|
| Sugar Grove | 16 | $6,172 | $489.99 | 43% |
| Creola | 18 | $5,899 | $403.00 | 53% |
| Hocking County | 11 | $5,712 | $508.21 | 49% |
| Rockbridge | 229 | $5,257 | $400.48 | 46% |
| Berlin Township | 11 | $5,023 | $386.97 | 46% |
| Logan | 688 | $4,907 | $388.67 | 45% |
| Berne Township | 15 | $4,897 | $490.66 | 37% |
| Swan Township | 111 | $4,727 | $334.40 | 49% |
| South Bloomingville | 129 | $4,565 | $312.34 | 48% |
| Laurelville | 145 | $4,519 | $348.68 | 45% |