New Straitsville Airbnb Market Analysis 2026: Short Term Rental Data & Vacation Rental Statistics in Ohio, United States
Is Airbnb profitable in New Straitsville in 2026? Explore comprehensive Airbnb analytics for New Straitsville, Ohio, United States to uncover income potential. This 2026 STR market report for New Straitsville, based on AirROI data from February 2025 to January 2026, reveals key trends in the niche market of 25 active listings.
Whether you're considering an Airbnb investment in New Straitsville, optimizing your existing vacation rental, or exploring rental arbitrage opportunities, understanding the New Straitsville Airbnb data is crucial. Leveraging the low regulation environment is key to maximizing your short term rental income potential. Let's dive into the specifics.
Key New Straitsville Airbnb Performance Metrics Overview
Monthly Airbnb Revenue Variations & Income Potential in New Straitsville (2026)
Understanding the monthly revenue variations for Airbnb listings in New Straitsville is key to maximizing your short term rental income potential. Seasonality significantly impacts earnings. Our analysis, based on data from the past 12 months, shows that the peak revenue month for STRs in New Straitsville is typically August, while February often presents the lowest earnings, highlighting opportunities for strategic pricing adjustments during shoulder and low seasons. Explore the typical Airbnb income in New Straitsville across different performance tiers:
- Best-in-class properties (Top 10%) achieve $5,143+ monthly, often utilizing dynamic pricing and superior guest experiences.
- Strong performing properties (Top 25%) earn $3,841 or more, indicating effective management and desirable locations/amenities.
- Typical properties (Median) generate around $2,585 per month, representing the average market performance.
- Entry-level properties (Bottom 25%) see earnings around $1,352, often with potential for optimization.
Average Monthly Airbnb Earnings Trend in New Straitsville
New Straitsville Airbnb Occupancy Rate Trends (2026)
Maximize your bookings by understanding the New Straitsville STR occupancy trends. Seasonal demand shifts significantly influence how often properties are booked. Typically, Augustsees the highest demand (peak season occupancy), while February experiences the lowest (low season). Effective strategies, like adjusting minimum stays or offering promotions, can boost occupancy during slower periods. Here's how different property tiers perform in New Straitsville:
- Best-in-class properties (Top 10%) achieve 70%+ occupancy, indicating high desirability and potentially optimized availability.
- Strong performing properties (Top 25%) maintain 55% or higher occupancy, suggesting good market fit and guest satisfaction.
- Typical properties (Median) have an occupancy rate around 38%.
- Entry-level properties (Bottom 25%) average 21% occupancy, potentially facing higher vacancy.
Average Monthly Occupancy Rate Trend in New Straitsville
Average Daily Rate (ADR) Airbnb Trends in New Straitsville (2026)
Effective short term rental pricing strategy in New Straitsville involves understanding monthly ADR fluctuations. The Average Daily Rate (ADR) for Airbnb in New Straitsville typically peaks in October and dips lowest during April. Leveraging Airbnb dynamic pricing tools or strategies based on this seasonality can significantly boost revenue. Here's a look at the typical nightly rates achieved:
- Best-in-class properties (Top 10%) command rates of $345+ per night, often due to premium features or locations.
- Strong performing properties (Top 25%) achieve nightly rates of $238 or more.
- Typical properties (Median) charge around $208 per night.
- Entry-level properties (Bottom 25%) earn around $160 per night.
Average Daily Rate (ADR) Trend by Month in New Straitsville
Get Live New Straitsville Market Intelligence 👇

Explore Real-time Analytics
Airbnb Seasonality Analysis & Trends in New Straitsville (2026)
Peak Season (August, October, September)
- Revenue averages $3,726 per month
- Occupancy rates average 53.1%
- Daily rates average $230
Shoulder Season
- Revenue averages $2,894 per month
- Occupancy maintains around 39.1%
- Daily rates hold near $226
Low Season (January, February, April)
- Revenue drops to average $2,000 per month
- Occupancy decreases to average 30.5%
- Daily rates adjust to average $203
Seasonality Insights for New Straitsville
- The Airbnb seasonality in New Straitsville shows highly seasonal trends requiring careful strategy. While the sections above show seasonal averages, it's also insightful to look at the extremes:
- During the high season, the absolute peak month showcases New Straitsville's highest earning potential, with monthly revenues capable of climbing to $3,981, occupancy reaching a high of 56.8%, and ADRs peaking at $273.
- Conversely, the slowest single month of the year, typically falling within the low season, marks the market's lowest point. In this month, revenue might dip to $1,746, occupancy could drop to 26.7%, and ADRs may adjust down to $197.
- Understanding both the seasonal averages and these monthly peaks and troughs in revenue, occupancy, and ADR is crucial for maximizing your Airbnb profit potential in New Straitsville.
Seasonal Strategies for Maximizing Profit
- Peak Season: Maximize revenue through premium pricing and potentially longer minimum stays. Ensure high availability.
- Low Season: Offer competitive pricing, special promotions (e.g., extended stay discounts), and flexible cancellation policies. Target off-season travelers like remote workers or budget-conscious guests.
- Shoulder Seasons: Implement dynamic pricing that balances peak and low rates. Target weekend travelers or specific events. Offer slightly more flexible terms than peak season.
- Regularly analyze your own performance against these New Straitsville seasonality benchmarks and adjust your pricing and availability strategy accordingly.
Best Areas for Airbnb Investment in New Straitsville (2026)
Exploring the top neighborhoods for short-term rentals in New Straitsville? This section highlights key areas, outlining why they are attractive for hosts and guests, along with notable local attractions. Consider these locations based on your target guest profile and investment strategy.
| Neighborhood / Area | Why Host Here? (Target Guests & Appeal) | Key Attractions & Landmarks |
|---|---|---|
| New Straitsville Main Street | The heart of New Straitsville with local shops, eateries, and easy access to nearby outdoor activities. A cozy small-town atmosphere that appeals to those looking to explore the Appalachian region. | Local diners, Historic buildings, Hocking Hills State Park, Wayne National Forest, Local festivals |
| Hocking Hills Region | Known for its stunning natural beauty and outdoor recreation, this area attracts tourists year-round for hiking, photography, and nature activities. Perfect for nature enthusiasts and adventure seekers. | Old Man's Cave, Cedar Falls, Ash Cave, Hocking Hills State Park, Zipline tours |
| Salt Fork State Park | A large state park with a wealth of outdoor activities such as fishing, hiking, and camping. An ideal place for guests looking to immerse themselves in nature during their stay. | Salt Fork Lake, Hiking trails, Wildlife viewing, Camping sites, Scenic picnic areas |
| Logan | A nearby town with charming historic sites and access to Hocking Hills. It's a gateway for visitors exploring the region, making it a prime location for short-term rentals. | Hocking Hills Scenic Byway, Local shops and cafes, Hocking Valley Scenic Railway, Historical sites |
| Nelsonville | Rich in cultural history and arts, Nelsonville hosts events and has many attractions for visitors, making it another great spot for Airbnb hosting. | Nelsonville Antique Mall, Stuart's Opera House, Broughton Cemetery, Arts and Crafts Fair |
| Bremen | A peaceful village atmosphere with local charm, offering a retreat for travelers looking for tranquility while being close to major hiking and nature activities. | Local craft shops, Community events, Access to hiking trails |
| Amanda | A small village with a quaint feel, attracting visitors who wish to escape the hustle of city life. Potential for serene retreats and local exploration. | Historic sites, Small local parks, Community centers |
| Reynoldsburg | Though a bit outside of New Straitsville, this suburban area offers ample amenities and easy access to urban attractions, appealing to those visiting nearby cities while enjoying a quieter stay. | Local parks, Shopping centers, Dining options, Cultural attractions in Columbus |
Understanding Airbnb License Requirements & STR Laws in New Straitsville (2026)
While New Straitsville, Ohio, United States currently shows low STR regulations, specific Airbnb license requirements might still exist or change. Always verify the latest short term rental regulations and Airbnb license requirements directly with local government authorities for New Straitsville to ensure full compliance before hosting.
(Source: AirROI data, 2026, finding no licensed listings among those analyzed)
Top Performing Airbnb Properties in New Straitsville (2026)
Benchmark your potential! Explore examples of top-performing Airbnb properties in New Straitsvillebased on Trailing Twelve Month (TTM) revenue. Analyze their characteristics, revenue, occupancy rate, and ADR to understand what drives success in this market.
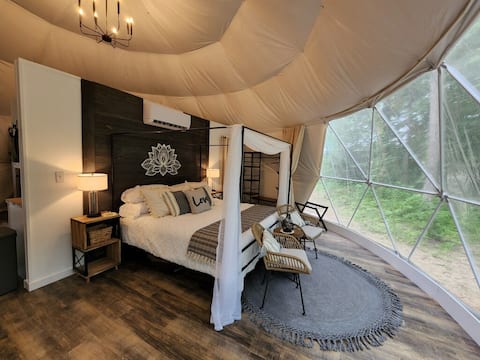
Bunny Bungalow Spacious Geodome
Entire Place • 1 bedroom

Hidden Falls Lodge in Hocking Hills
Entire Place • 4 bedrooms
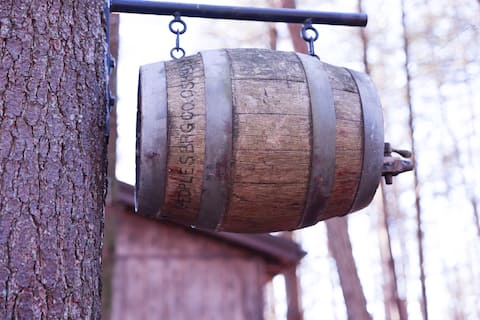
The Old Moonshiners at Avenwood Cabins
Entire Place • 1 bedroom
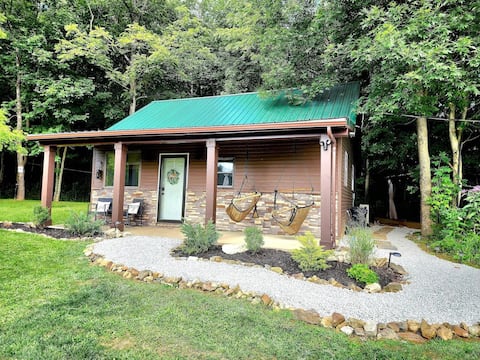
Deer Haven Cabin
Entire Place • 1 bedroom

Secluded Wooded Cabin Near The Hocking Hills
Entire Place • 2 bedrooms

Tiny House! Hot Tub! Firepit! Pets! Secluded!
Entire Place • 1 bedroom
Note: Performance varies based on location, size, amenities, seasonality, and management quality. Data reflects the past 12 months.
Top Performing Airbnb Hosts in New Straitsville (2026)
Learn from the best! This table showcases top-performing Airbnb hosts in New Straitsville based on the number of properties managed and estimated total revenue over the past year. Analyze their scale and performance metrics.
| Host Name | Properties | Grossing Revenue | Stay Reviews | Avg Rating |
|---|---|---|---|---|
| Britney | 15 | $362,463 | 1696 | 4.59/5.0 |
| Brent | 2 | $123,814 | 243 | 4.92/5.0 |
| Book Hocking | 1 | $68,795 | 31 | 4.74/5.0 |
| Layne | 1 | $46,298 | 151 | 5.00/5.0 |
| Chelsey | 1 | $38,768 | 218 | 4.81/5.0 |
| Mike And Jan | 3 | $29,072 | 139 | 4.97/5.0 |
| Paul | 1 | $27,302 | 65 | 4.77/5.0 |
| Bridget | 1 | $13,674 | 20 | 4.90/5.0 |
Analyzing the strategies of top hosts, such as their property selection, pricing, and guest communication, can offer valuable lessons for optimizing your own Airbnb operations in New Straitsville.
Dive Deeper: Advanced New Straitsville STR Market Data (2026)
Ready to unlock more insights? AirROI provides access to advanced metrics and comprehensive Airbnb data for New Straitsville. Explore detailed analytics beyond this report to refine your investment strategy, optimize pricing, and maximize your vacation rental profits.
Explore Advanced MetricsNew Straitsville Short-Term Rental Market Composition (2026): Property & Room Types
Room Type Distribution
Property Type Distribution
Market Composition Insights for New Straitsville
- The New Straitsville Airbnb market composition is heavily skewed towards Entire Home/Apt listings, which make up 84% of the 25 active rentals. This indicates strong guest preference for privacy and space.
- Looking at the property type distribution in New Straitsville, Outdoor/Unique properties are the most common (76%), reflecting the local real estate landscape.
- Houses represent a significant 16% portion, catering likely to families or larger groups.
- Smaller segments like hotel/boutique, unique stays (combined 8.0%) offer potential for unique stay experiences.
New Straitsville Airbnb Room Capacity Analysis (2026): Bedroom Distribution
Distribution of Listings by Number of Bedrooms
Room Capacity Insights for New Straitsville
- The dominant room capacity in New Straitsville is 1 bedroom listings, making up 60% of the market. This suggests a strong demand for properties suitable for couples or solo travelers.
- Together, 1 bedroom and 2 bedrooms properties represent 72.0% of the active Airbnb listings in New Straitsville, indicating a high concentration in these sizes.
- With over half the market (60%) consisting of studios or 1-bedroom units, New Straitsville is particularly well-suited for individuals or couples.
- Listings with 3+ bedrooms (8.0%) represent a smaller niche, potentially indicating an underserved market for larger group accommodations in New Straitsville.
New Straitsville Vacation Rental Guest Capacity Trends (2026)
Distribution of Listings by Guest Capacity
Guest Capacity Insights for New Straitsville
- The most common guest capacity trend in New Straitsville vacation rentals is listings accommodating 2 guests (60%). This suggests the primary traveler segment is likely couples or solo travelers.
- Properties designed for 2 guests and 8+ guests dominate the New Straitsville STR market, accounting for 68.0% of listings.
- A significant 60.0% of listings cater specifically to 1-2 guests, highlighting strong demand from couples and solo travelers in New Straitsville.
- 12.0% of properties accommodate 6+ guests, serving the market segment for larger families or group travel in New Straitsville.
- On average, properties in New Straitsville are equipped to host 2.6 guests.
New Straitsville Airbnb Booking Patterns (2026): Available vs. Booked Days
Available Days Distribution
Booked Days Distribution
Booking Pattern Insights for New Straitsville
- The most common availability pattern in New Straitsville falls within the 181-270 days range, representing 60% of listings. This suggests many properties have significant open periods on their calendars.
- Approximately 88.0% of listings show high availability (181+ days open annually), indicating potential for increased bookings or specific owner usage patterns.
- For booked days, the 91-180 days range is most frequent in New Straitsville (56%), reflecting common guest stay durations or potential owner blocking patterns.
- A notable 16.0% of properties secure long booking periods (181+ days booked per year), highlighting successful long-term rental strategies or significant owner usage.
New Straitsville Airbnb Minimum Stay Requirements Analysis
Distribution of Listings by Minimum Night Requirement
1 Night
16 listings
64% of total
2 Nights
5 listings
20% of total
30+ Nights
4 listings
16% of total
Key Insights
- The most prevalent minimum stay requirement in New Straitsville is 1 Night, adopted by 64% of listings. This highlights the market's preference for shorter, flexible bookings.
- A strong majority (84.0%) of the New Straitsville Airbnb data shows acceptance of very short stays (1-2 nights), indicating a dynamic, high-turnover market.
- A significant segment (16%) caters to monthly stays (30+ nights) in New Straitsville, pointing to opportunities in the extended-stay market.
Recommendations
- Align with the market by considering a 1 Night minimum stay, as 64% of New Straitsville hosts use this setting.
- Explore offering discounts for stays of 30+ nights to attract the 16% of the market seeking extended stays.
- Adjust minimum nights based on seasonality – potentially shorter during low season and longer during peak demand periods in New Straitsville.
New Straitsville Airbnb Cancellation Policy Trends Analysis (2026)
Flexible
3 listings
12% of total
Moderate
2 listings
8% of total
Firm
18 listings
72% of total
Strict
2 listings
8% of total
Cancellation Policy Insights for New Straitsville
- The prevailing Airbnb cancellation policy trend in New Straitsville is Firm, used by 72% of listings.
- A majority (80.0%) of hosts in New Straitsville utilize Firm or Strict policies, indicating a market where hosts prioritize booking security.
- Strict cancellation policies are quite rare (8%), potentially making listings with this policy less competitive unless justified by high demand or property type.
Recommendations for Hosts
- Consider adopting a Firm policy to align with the 72% market standard in New Straitsville.
- Using a Strict policy might deter some guests, as only 8% of listings use it. Evaluate if potential revenue protection outweighs possible lower booking rates.
- Regularly review your cancellation policy against competitors and market demand shifts in New Straitsville.
New Straitsville STR Booking Lead Time Analysis (2026)
Average Booking Lead Time by Month
Booking Lead Time Insights for New Straitsville
- The overall average booking lead time for vacation rentals in New Straitsville is 39 days.
- Guests book furthest in advance for stays during October (average 58 days), likely coinciding with peak travel demand or local events.
- The shortest booking windows occur for stays in December (average 20 days), indicating more last-minute travel plans during this time.
- Seasonally, Fall (55 days avg.) sees the longest lead times, while Winter (27 days avg.) has the shortest, reflecting typical travel planning cycles.
Recommendations for Hosts
- Use the overall average lead time (39 days) as a baseline for your pricing and availability strategy in New Straitsville.
- For October stays, consider implementing length-of-stay discounts or slightly higher rates for bookings made less than 58 days out to capitalize on advance planning.
- Target marketing efforts for the Fall season well in advance (at least 55 days) to capture early planners.
- Monitor your own booking lead times against these New Straitsville averages to identify opportunities for dynamic pricing adjustments.
Popular & Essential Airbnb Amenities in New Straitsville (2026)
Amenity Prevalence
Amenity Insights for New Straitsville
- Essential amenities in New Straitsville that guests expect include: Air conditioning, Free parking on premises, Carbon monoxide alarm, Kitchen, Smoke alarm, Fire extinguisher, Bed linens, Fire pit, Coffee maker, Heating. Lacking these (any) could significantly impact bookings.
Recommendations for Hosts
- Ensure your listing includes all essential amenities for New Straitsville: Air conditioning, Free parking on premises, Carbon monoxide alarm, Kitchen, Smoke alarm, Fire extinguisher, Bed linens, Fire pit, Coffee maker, Heating.
- Prioritize adding missing essentials: Bed linens, Fire pit, Coffee maker, Heating.
- Highlight unique or less common amenities you offer (e.g., hot tub, dedicated workspace, EV charger) in your listing description and photos.
- Regularly check competitor amenities in New Straitsville to stay competitive.
New Straitsville Airbnb Guest Demographics & Profile Analysis (2026)
Guest Profile Summary for New Straitsville
- The typical guest profile for Airbnb in New Straitsville consists of primarily domestic travelers (99%), often arriving from nearby Columbus, typically belonging to the Post-2000s (Gen Z/Alpha) group (50%), primarily speaking English or Spanish.
- Domestic travelers account for 98.7% of guests.
- Key international markets include United States (98.7%) and Japan (0.6%).
- Top languages spoken are English (76%) followed by Spanish (9.3%).
- A significant demographic segment is the Post-2000s (Gen Z/Alpha) group, representing 50% of guests.
Recommendations for Hosts
- Target domestic marketing efforts towards travelers from Columbus and Pittsburgh.
- Tailor amenities and listing descriptions to appeal to the dominant Post-2000s (Gen Z/Alpha) demographic (e.g., highlight fast WiFi, smart home features, local guides).
- Highlight unique local experiences or amenities relevant to the primary guest profile.
- Consider seasonal promotions aligned with peak travel times for key origin markets.
Nearby Short-Term Rental Market Comparison
How does the New Straitsville Airbnb market stack up against its neighbors? Compare key performance metrics like average monthly revenue, ADR, and occupancy rates in surrounding areas to understand the broader regional STR landscape.
| Market | Active Properties | Monthly Revenue | Daily Rate | Avg. Occupancy |
|---|---|---|---|---|
| Sugar Grove | 16 | $6,172 | $489.99 | 43% |
| Creola | 18 | $5,899 | $403.00 | 53% |
| Hocking County | 11 | $5,712 | $508.21 | 49% |
| Rockbridge | 229 | $5,257 | $400.48 | 46% |
| Berlin Township | 11 | $5,023 | $386.97 | 46% |
| Logan | 688 | $4,907 | $388.67 | 45% |
| Berne Township | 15 | $4,897 | $490.66 | 37% |
| Swan Township | 111 | $4,727 | $334.40 | 49% |
| South Bloomingville | 129 | $4,565 | $312.34 | 48% |
| Laurelville | 145 | $4,519 | $348.68 | 45% |