Loudonville Airbnb Market Analysis 2026: Short Term Rental Data & Vacation Rental Statistics in Ohio, United States
Is Airbnb profitable in Loudonville in 2026? Explore comprehensive Airbnb analytics for Loudonville, Ohio, United States to uncover income potential. This 2026 STR market report for Loudonville, based on AirROI data from February 2025 to January 2026, reveals key trends in the niche market of 31 active listings.
Whether you're considering an Airbnb investment in Loudonville, optimizing your existing vacation rental, or exploring rental arbitrage opportunities, understanding the Loudonville Airbnb data is crucial. Leveraging the low regulation environment is key to maximizing your short term rental income potential. Let's dive into the specifics.
Key Loudonville Airbnb Performance Metrics Overview
Monthly Airbnb Revenue Variations & Income Potential in Loudonville (2026)
Understanding the monthly revenue variations for Airbnb listings in Loudonville is key to maximizing your short term rental income potential. Seasonality significantly impacts earnings. Our analysis, based on data from the past 12 months, shows that the peak revenue month for STRs in Loudonville is typically July, while April often presents the lowest earnings, highlighting opportunities for strategic pricing adjustments during shoulder and low seasons. Explore the typical Airbnb income in Loudonville across different performance tiers:
- Best-in-class properties (Top 10%) achieve $3,897+ monthly, often utilizing dynamic pricing and superior guest experiences.
- Strong performing properties (Top 25%) earn $2,722 or more, indicating effective management and desirable locations/amenities.
- Typical properties (Median) generate around $1,789 per month, representing the average market performance.
- Entry-level properties (Bottom 25%) see earnings around $1,119, often with potential for optimization.
Average Monthly Airbnb Earnings Trend in Loudonville
Loudonville Airbnb Occupancy Rate Trends (2026)
Maximize your bookings by understanding the Loudonville STR occupancy trends. Seasonal demand shifts significantly influence how often properties are booked. Typically, Augustsees the highest demand (peak season occupancy), while January experiences the lowest (low season). Effective strategies, like adjusting minimum stays or offering promotions, can boost occupancy during slower periods. Here's how different property tiers perform in Loudonville:
- Best-in-class properties (Top 10%) achieve 62%+ occupancy, indicating high desirability and potentially optimized availability.
- Strong performing properties (Top 25%) maintain 46% or higher occupancy, suggesting good market fit and guest satisfaction.
- Typical properties (Median) have an occupancy rate around 32%.
- Entry-level properties (Bottom 25%) average 18% occupancy, potentially facing higher vacancy.
Average Monthly Occupancy Rate Trend in Loudonville
Average Daily Rate (ADR) Airbnb Trends in Loudonville (2026)
Effective short term rental pricing strategy in Loudonville involves understanding monthly ADR fluctuations. The Average Daily Rate (ADR) for Airbnb in Loudonville typically peaks in October and dips lowest during February. Leveraging Airbnb dynamic pricing tools or strategies based on this seasonality can significantly boost revenue. Here's a look at the typical nightly rates achieved:
- Best-in-class properties (Top 10%) command rates of $360+ per night, often due to premium features or locations.
- Strong performing properties (Top 25%) achieve nightly rates of $257 or more.
- Typical properties (Median) charge around $183 per night.
- Entry-level properties (Bottom 25%) earn around $129 per night.
Average Daily Rate (ADR) Trend by Month in Loudonville
Get Live Loudonville Market Intelligence 👇

Explore Real-time Analytics
Airbnb Seasonality Analysis & Trends in Loudonville (2026)
Peak Season (July, August, October)
- Revenue averages $3,090 per month
- Occupancy rates average 45.3%
- Daily rates average $227
Shoulder Season
- Revenue averages $2,218 per month
- Occupancy maintains around 33.7%
- Daily rates hold near $224
Low Season (January, February, April)
- Revenue drops to average $1,358 per month
- Occupancy decreases to average 24.5%
- Daily rates adjust to average $203
Seasonality Insights for Loudonville
- The Airbnb seasonality in Loudonville shows highly seasonal trends requiring careful strategy. While the sections above show seasonal averages, it's also insightful to look at the extremes:
- During the high season, the absolute peak month showcases Loudonville's highest earning potential, with monthly revenues capable of climbing to $3,163, occupancy reaching a high of 45.7%, and ADRs peaking at $263.
- Conversely, the slowest single month of the year, typically falling within the low season, marks the market's lowest point. In this month, revenue might dip to $1,303, occupancy could drop to 18.1%, and ADRs may adjust down to $184.
- Understanding both the seasonal averages and these monthly peaks and troughs in revenue, occupancy, and ADR is crucial for maximizing your Airbnb profit potential in Loudonville.
Seasonal Strategies for Maximizing Profit
- Peak Season: Maximize revenue through premium pricing and potentially longer minimum stays. Ensure high availability.
- Low Season: Offer competitive pricing, special promotions (e.g., extended stay discounts), and flexible cancellation policies. Target off-season travelers like remote workers or budget-conscious guests.
- Shoulder Seasons: Implement dynamic pricing that balances peak and low rates. Target weekend travelers or specific events. Offer slightly more flexible terms than peak season.
- Regularly analyze your own performance against these Loudonville seasonality benchmarks and adjust your pricing and availability strategy accordingly.
Best Areas for Airbnb Investment in Loudonville (2026)
Exploring the top neighborhoods for short-term rentals in Loudonville? This section highlights key areas, outlining why they are attractive for hosts and guests, along with notable local attractions. Consider these locations based on your target guest profile and investment strategy.
| Neighborhood / Area | Why Host Here? (Target Guests & Appeal) | Key Attractions & Landmarks |
|---|---|---|
| Downtown Loudonville | The heart of Loudonville, offering a unique small-town experience with quaint shops, restaurants, and local events. Ideal for visitors looking to explore the village's charm and access local attractions easily. | Mohican River, Loudonville Canoe Livery, Miller's Trail, Local shops and cafes, Annual Festivals |
| Mohican State Park | A beautiful and expansive state park that attracts outdoor enthusiasts, offering hiking, camping, and scenic views. Perfect for Airbnb hosts looking to cater to nature lovers and adventure seekers. | Mohican State Park, Clear Fork Gorge, Hayden Run Falls, Hiking Trails, Camping Facilities |
| The Village of Loudonville | A charming village atmosphere with local flavors and hospitality. Great for families looking for a quiet getaway, with plenty of outdoor activities in the surrounding area. | Historical Society, Local Breweries, Restaurants, Festivals, Bird watching |
| Nearby Holmes County | Famous for its Amish community, this area offers unique cultural experiences and attracts visitors interested in local crafts, foods, and traditions. An excellent spot for unique Airbnb stays. | Amish Country, Covered Bridges, Local Farmers Markets, Heritage Center, Scenic Drives |
| Kahuna Beach | A scenic spot along the Mohican River, offering recreational activities such as swimming, tubing, and fishing. It's an ideal location for active guests looking for outdoor fun. | Mohican River Tubing, Fishing Spots, Swimming, Picnic Areas, Scenic Views |
| Ashland County | Nearby Ashland County provides additional amenities and attractions, making it a good secondary option for visitors to Loudonville seeking entertainment and dining. | Ashland University, Local Festivals, Shopping Centers, Parks, Theatre |
| Loudonville Historic District | Rich in history, this area attracts tourists interested in the local heritage and architecture. Perfect for Airbnb stays that offer a touch of history. | Historical Buildings, Local Tours, Cultural Events, Museums, Walking Tours |
| Nearby Mansfield | A larger city nearby that offers a variety of attractions, dining, and shopping opportunities. It serves as a supplementary location for guests visiting Loudonville. | Richland Carrousel Park, Mansfield Reformatory, Shopping Malls, Theatre, Restaurants |
Understanding Airbnb License Requirements & STR Laws in Loudonville (2026)
While Loudonville, Ohio, United States currently shows low STR regulations, specific Airbnb license requirements might still exist or change. Always verify the latest short term rental regulations and Airbnb license requirements directly with local government authorities for Loudonville to ensure full compliance before hosting.
(Source: AirROI data, 2026, finding no licensed listings among those analyzed)
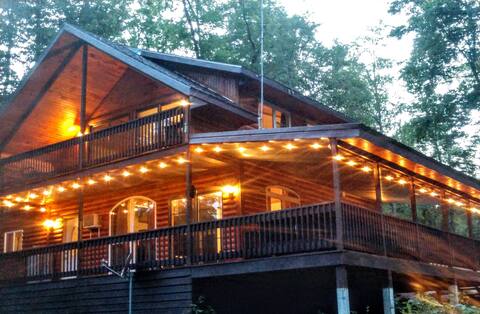
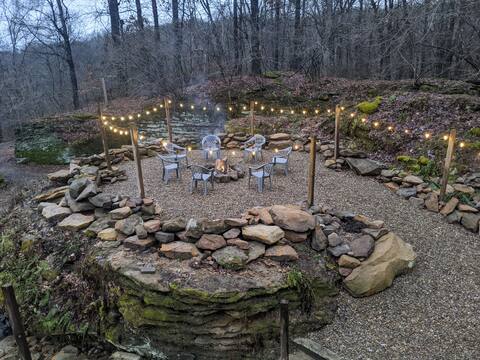
Top Performing Airbnb Properties in Loudonville (2026)
Benchmark your potential! Explore examples of top-performing Airbnb properties in Loudonvillebased on Trailing Twelve Month (TTM) revenue. Analyze their characteristics, revenue, occupancy rate, and ADR to understand what drives success in this market.

The Barn on Wally
Entire Place • 6 bedrooms
Serenity Hill Escape in Mohican with Pavilion
Entire Place • 3 bedrooms
Mystic Cliffs Hideaway
Entire Place • 3 bedrooms

Walk to River: Loudonville Retreat w/ Hot Tub!
Entire Place • 3 bedrooms

The Riverside Cottage
Entire Place • 2 bedrooms

The River Town Getaway
Entire Place • 3 bedrooms
Note: Performance varies based on location, size, amenities, seasonality, and management quality. Data reflects the past 12 months.
Top Performing Airbnb Hosts in Loudonville (2026)
Learn from the best! This table showcases top-performing Airbnb hosts in Loudonville based on the number of properties managed and estimated total revenue over the past year. Analyze their scale and performance metrics.
| Host Name | Properties | Grossing Revenue | Stay Reviews | Avg Rating |
|---|---|---|---|---|
| Nick | 1 | $112,465 | 59 | 4.92/5.0 |
| Sam | 3 | $66,472 | 471 | 4.95/5.0 |
| Amanda | 2 | $47,390 | 170 | 4.95/5.0 |
| Michelle | 2 | $44,213 | 293 | 4.97/5.0 |
| Andrea | 1 | $39,547 | 272 | 4.88/5.0 |
| Amy | 1 | $39,000 | 156 | 4.99/5.0 |
| Evolve | 1 | $32,086 | 20 | 4.85/5.0 |
| Megan Elizabeth | 3 | $31,070 | 64 | 4.85/5.0 |
| Stephanie | 1 | $28,043 | 27 | 5.00/5.0 |
| Kathy | 2 | $26,479 | 101 | 4.70/5.0 |
Analyzing the strategies of top hosts, such as their property selection, pricing, and guest communication, can offer valuable lessons for optimizing your own Airbnb operations in Loudonville.
Dive Deeper: Advanced Loudonville STR Market Data (2026)
Ready to unlock more insights? AirROI provides access to advanced metrics and comprehensive Airbnb data for Loudonville. Explore detailed analytics beyond this report to refine your investment strategy, optimize pricing, and maximize your vacation rental profits.
Explore Advanced MetricsLoudonville Short-Term Rental Market Composition (2026): Property & Room Types
Room Type Distribution
Property Type Distribution
Market Composition Insights for Loudonville
- The Loudonville Airbnb market composition is heavily skewed towards Entire Home/Apt listings, which make up 93.5% of the 31 active rentals. This indicates strong guest preference for privacy and space.
- Looking at the property type distribution in Loudonville, Apartment/Condo properties are the most common (41.9%), reflecting the local real estate landscape.
- Houses represent a significant 38.7% portion, catering likely to families or larger groups.
- Smaller segments like unique stays, others, hotel/boutique (combined 9.6%) offer potential for unique stay experiences.
Loudonville Airbnb Room Capacity Analysis (2026): Bedroom Distribution
Distribution of Listings by Number of Bedrooms
Room Capacity Insights for Loudonville
- The dominant room capacity in Loudonville is 2 bedrooms listings, making up 48.4% of the market. This suggests a strong demand for properties suitable for couples or solo travelers.
- Together, 2 bedrooms and 3 bedrooms properties represent 71.0% of the active Airbnb listings in Loudonville, indicating a high concentration in these sizes.
- A significant 29.1% of listings offer 3+ bedrooms, catering to larger groups and families seeking more space in Loudonville.
Loudonville Vacation Rental Guest Capacity Trends (2026)
Distribution of Listings by Guest Capacity
Guest Capacity Insights for Loudonville
- The most common guest capacity trend in Loudonville vacation rentals is listings accommodating 8+ guests (35.5%). This suggests the primary traveler segment is likely larger groups.
- Properties designed for 8+ guests and 4 guests dominate the Loudonville STR market, accounting for 54.9% of listings.
- 54.9% of properties accommodate 6+ guests, serving the market segment for larger families or group travel in Loudonville.
- On average, properties in Loudonville are equipped to host 5.5 guests.
Loudonville Airbnb Booking Patterns (2026): Available vs. Booked Days
Available Days Distribution
Booked Days Distribution
Booking Pattern Insights for Loudonville
- The most common availability pattern in Loudonville falls within the 181-270 days range, representing 51.6% of listings. This suggests many properties have significant open periods on their calendars.
- Approximately 96.8% of listings show high availability (181+ days open annually), indicating potential for increased bookings or specific owner usage patterns.
- For booked days, the 91-180 days range is most frequent in Loudonville (54.8%), reflecting common guest stay durations or potential owner blocking patterns.
- A notable 6.5% of properties secure long booking periods (181+ days booked per year), highlighting successful long-term rental strategies or significant owner usage.
Loudonville Airbnb Minimum Stay Requirements Analysis
Distribution of Listings by Minimum Night Requirement
1 Night
17 listings
54.8% of total
2 Nights
8 listings
25.8% of total
3 Nights
2 listings
6.5% of total
30+ Nights
4 listings
12.9% of total
Key Insights
- The most prevalent minimum stay requirement in Loudonville is 1 Night, adopted by 54.8% of listings. This highlights the market's preference for shorter, flexible bookings.
- A strong majority (80.6%) of the Loudonville Airbnb data shows acceptance of very short stays (1-2 nights), indicating a dynamic, high-turnover market.
- A significant segment (12.9%) caters to monthly stays (30+ nights) in Loudonville, pointing to opportunities in the extended-stay market.
Recommendations
- Align with the market by considering a 1 Night minimum stay, as 54.8% of Loudonville hosts use this setting.
- Explore offering discounts for stays of 30+ nights to attract the 12.9% of the market seeking extended stays.
- Adjust minimum nights based on seasonality – potentially shorter during low season and longer during peak demand periods in Loudonville.
Loudonville Airbnb Cancellation Policy Trends Analysis (2026)
Super Strict 30 Days
1 listings
3.2% of total
Flexible
6 listings
19.4% of total
Moderate
6 listings
19.4% of total
Firm
12 listings
38.7% of total
Strict
6 listings
19.4% of total
Cancellation Policy Insights for Loudonville
- The prevailing Airbnb cancellation policy trend in Loudonville is Firm, used by 38.7% of listings.
- A majority (58.1%) of hosts in Loudonville utilize Firm or Strict policies, indicating a market where hosts prioritize booking security.
Recommendations for Hosts
- Consider adopting a Firm policy to align with the 38.7% market standard in Loudonville.
- Regularly review your cancellation policy against competitors and market demand shifts in Loudonville.
Loudonville STR Booking Lead Time Analysis (2026)
Average Booking Lead Time by Month
Booking Lead Time Insights for Loudonville
- The overall average booking lead time for vacation rentals in Loudonville is 58 days.
- Guests book furthest in advance for stays during July (average 92 days), likely coinciding with peak travel demand or local events.
- The shortest booking windows occur for stays in March (average 18 days), indicating more last-minute travel plans during this time.
- Seasonally, Summer (72 days avg.) sees the longest lead times, while Winter (35 days avg.) has the shortest, reflecting typical travel planning cycles.
Recommendations for Hosts
- Use the overall average lead time (58 days) as a baseline for your pricing and availability strategy in Loudonville.
- For July stays, consider implementing length-of-stay discounts or slightly higher rates for bookings made less than 92 days out to capitalize on advance planning.
- Target marketing efforts for the Summer season well in advance (at least 72 days) to capture early planners.
- Monitor your own booking lead times against these Loudonville averages to identify opportunities for dynamic pricing adjustments.
Popular & Essential Airbnb Amenities in Loudonville (2026)
Amenity Prevalence
Amenity Insights for Loudonville
- Essential amenities in Loudonville that guests expect include: TV, Smoke alarm, Wifi, Kitchen. Lacking these (any) could significantly impact bookings.
- Popular amenities like Air conditioning, Hot water, Heating are common but not universal. Offering these can provide a competitive edge.
Recommendations for Hosts
- Ensure your listing includes all essential amenities for Loudonville: TV, Smoke alarm, Wifi, Kitchen.
- Prioritize adding missing essentials: Smoke alarm, Wifi, Kitchen.
- Consider adding popular differentiators like Air conditioning or Hot water to increase appeal.
- Highlight unique or less common amenities you offer (e.g., hot tub, dedicated workspace, EV charger) in your listing description and photos.
- Regularly check competitor amenities in Loudonville to stay competitive.
Loudonville Airbnb Guest Demographics & Profile Analysis (2026)
Guest Profile Summary for Loudonville
- The typical guest profile for Airbnb in Loudonville consists of primarily domestic travelers (99%), often arriving from nearby Columbus, typically belonging to the Post-2000s (Gen Z/Alpha) group (50%), primarily speaking English or Spanish.
- Domestic travelers account for 99.0% of guests.
- Key international markets include United States (99%) and Spain (1%).
- Top languages spoken are English (82.3%) followed by Spanish (9.7%).
- A significant demographic segment is the Post-2000s (Gen Z/Alpha) group, representing 50% of guests.
Recommendations for Hosts
- Target domestic marketing efforts towards travelers from Columbus and Cleveland.
- Tailor amenities and listing descriptions to appeal to the dominant Post-2000s (Gen Z/Alpha) demographic (e.g., highlight fast WiFi, smart home features, local guides).
- Highlight unique local experiences or amenities relevant to the primary guest profile.
- Consider seasonal promotions aligned with peak travel times for key origin markets.
Nearby Short-Term Rental Market Comparison
How does the Loudonville Airbnb market stack up against its neighbors? Compare key performance metrics like average monthly revenue, ADR, and occupancy rates in surrounding areas to understand the broader regional STR landscape.
| Market | Active Properties | Monthly Revenue | Daily Rate | Avg. Occupancy |
|---|---|---|---|---|
| Sugar Grove | 16 | $6,172 | $489.99 | 43% |
| Creola | 18 | $5,899 | $403.00 | 53% |
| Hocking County | 11 | $5,712 | $508.21 | 49% |
| Rockbridge | 229 | $5,257 | $400.48 | 46% |
| Huron Township | 17 | $5,053 | $484.21 | 40% |
| Berlin Township | 11 | $5,023 | $386.97 | 46% |
| Logan | 688 | $4,907 | $388.67 | 45% |
| Berne Township | 15 | $4,897 | $490.66 | 37% |
| Swan Township | 111 | $4,727 | $334.40 | 49% |
| South Bloomingville | 129 | $4,565 | $312.34 | 48% |