Liberty Township Airbnb Market Analysis 2026: Short Term Rental Data & Vacation Rental Statistics in Ohio, United States
Is Airbnb profitable in Liberty Township in 2026? Explore comprehensive Airbnb analytics for Liberty Township, Ohio, United States to uncover income potential. This 2026 STR market report for Liberty Township, based on AirROI data from February 2025 to January 2026, reveals key trends in the niche market of 64 active listings.
Whether you're considering an Airbnb investment in Liberty Township, optimizing your existing vacation rental, or exploring rental arbitrage opportunities, understanding the Liberty Township Airbnb data is crucial. Leveraging the low regulation environment is key to maximizing your short term rental income potential. Let's dive into the specifics.
Key Liberty Township Airbnb Performance Metrics Overview
Monthly Airbnb Revenue Variations & Income Potential in Liberty Township (2026)
Understanding the monthly revenue variations for Airbnb listings in Liberty Township is key to maximizing your short term rental income potential. Seasonality significantly impacts earnings. Our analysis, based on data from the past 12 months, shows that the peak revenue month for STRs in Liberty Township is typically August, while February often presents the lowest earnings, highlighting opportunities for strategic pricing adjustments during shoulder and low seasons. Explore the typical Airbnb income in Liberty Township across different performance tiers:
- Best-in-class properties (Top 10%) achieve $7,861+ monthly, often utilizing dynamic pricing and superior guest experiences.
- Strong performing properties (Top 25%) earn $4,086 or more, indicating effective management and desirable locations/amenities.
- Typical properties (Median) generate around $2,098 per month, representing the average market performance.
- Entry-level properties (Bottom 25%) see earnings around $956, often with potential for optimization.
Average Monthly Airbnb Earnings Trend in Liberty Township
Liberty Township Airbnb Occupancy Rate Trends (2026)
Maximize your bookings by understanding the Liberty Township STR occupancy trends. Seasonal demand shifts significantly influence how often properties are booked. Typically, Augustsees the highest demand (peak season occupancy), while January experiences the lowest (low season). Effective strategies, like adjusting minimum stays or offering promotions, can boost occupancy during slower periods. Here's how different property tiers perform in Liberty Township:
- Best-in-class properties (Top 10%) achieve 71%+ occupancy, indicating high desirability and potentially optimized availability.
- Strong performing properties (Top 25%) maintain 55% or higher occupancy, suggesting good market fit and guest satisfaction.
- Typical properties (Median) have an occupancy rate around 35%.
- Entry-level properties (Bottom 25%) average 18% occupancy, potentially facing higher vacancy.
Average Monthly Occupancy Rate Trend in Liberty Township
Average Daily Rate (ADR) Airbnb Trends in Liberty Township (2026)
Effective short term rental pricing strategy in Liberty Township involves understanding monthly ADR fluctuations. The Average Daily Rate (ADR) for Airbnb in Liberty Township typically peaks in October and dips lowest during February. Leveraging Airbnb dynamic pricing tools or strategies based on this seasonality can significantly boost revenue. Here's a look at the typical nightly rates achieved:
- Best-in-class properties (Top 10%) command rates of $630+ per night, often due to premium features or locations.
- Strong performing properties (Top 25%) achieve nightly rates of $322 or more.
- Typical properties (Median) charge around $193 per night.
- Entry-level properties (Bottom 25%) earn around $99 per night.
Average Daily Rate (ADR) Trend by Month in Liberty Township
Get Live Liberty Township Market Intelligence 👇

Explore Real-time Analytics
Airbnb Seasonality Analysis & Trends in Liberty Township (2026)
Peak Season (August, July, June)
- Revenue averages $4,394 per month
- Occupancy rates average 43.8%
- Daily rates average $274
Shoulder Season
- Revenue averages $3,211 per month
- Occupancy maintains around 38.0%
- Daily rates hold near $272
Low Season (January, February, April)
- Revenue drops to average $2,127 per month
- Occupancy decreases to average 31.8%
- Daily rates adjust to average $244
Seasonality Insights for Liberty Township
- The Airbnb seasonality in Liberty Township shows highly seasonal trends requiring careful strategy. While the sections above show seasonal averages, it's also insightful to look at the extremes:
- During the high season, the absolute peak month showcases Liberty Township's highest earning potential, with monthly revenues capable of climbing to $4,663, occupancy reaching a high of 45.3%, and ADRs peaking at $292.
- Conversely, the slowest single month of the year, typically falling within the low season, marks the market's lowest point. In this month, revenue might dip to $1,863, occupancy could drop to 29.8%, and ADRs may adjust down to $225.
- Understanding both the seasonal averages and these monthly peaks and troughs in revenue, occupancy, and ADR is crucial for maximizing your Airbnb profit potential in Liberty Township.
Seasonal Strategies for Maximizing Profit
- Peak Season: Maximize revenue through premium pricing and potentially longer minimum stays. Ensure high availability.
- Low Season: Offer competitive pricing, special promotions (e.g., extended stay discounts), and flexible cancellation policies. Target off-season travelers like remote workers or budget-conscious guests.
- Shoulder Seasons: Implement dynamic pricing that balances peak and low rates. Target weekend travelers or specific events. Offer slightly more flexible terms than peak season.
- Regularly analyze your own performance against these Liberty Township seasonality benchmarks and adjust your pricing and availability strategy accordingly.
Best Areas for Airbnb Investment in Liberty Township (2026)
Exploring the top neighborhoods for short-term rentals in Liberty Township? This section highlights key areas, outlining why they are attractive for hosts and guests, along with notable local attractions. Consider these locations based on your target guest profile and investment strategy.
| Neighborhood / Area | Why Host Here? (Target Guests & Appeal) | Key Attractions & Landmarks |
|---|---|---|
| Liberty Township | A growing community in southwest Ohio with a suburban feel, known for its family-friendly environment and proximity to Cincinnati and Dayton. Ideal for families and individuals looking for a peaceful neighborhood with all amenities nearby. | Voice of America MetroPark, Liberty Center, Civic Center Park, Sharon Woods, Atrium Medical Center, Warren County Historical Society |
| Cincinnati | Just a short drive from Liberty Township, Cincinnati offers a vibrant cultural scene, great food, and various attractions. Ideal for travelers looking for urban experiences. | Fifth Third Bank Ballpark, Cincinnati Art Museum, Findlay Market, Cincinnati Zoo & Botanical Garden, Krohn Conservatory, Carew Tower Observation Deck |
| Dayton | Another nearby city, known for its historical significance and arts scene. Hosts many events and festivals, making it attractive for short-term rentals. | National Museum of the U.S. Air Force, Carillon Historical Park, Oregon District, Dayton Art Institute, Wright-Patterson Air Force Base, The Schuster Center |
| West Chester | Adjacent to Liberty Township, West Chester is a thriving suburban area with plenty of shopping and dining options, attracting both leisure and business travelers. | The Mall at Fairfield Commons, Keehner Park, West Chester Township History, Entertrainment Junction, Liberty Park |
| Mason | Known for its amusement parks and family-friendly attractions, Mason offers opportunities for vacationing families, especially during the summer months. | Kings Island, The Beach Waterpark, Lynde Schott Park, Great Wolf Lodge, Mason Community Center |
| Springboro | A charming small town with a strong sense of community and picturesque parks, perfect for those looking for a quieter stay. | Clearcreek Park, Gardens of the Fossils, Springboro Historical Society, Nostalgia Park, Springboro Town Square |
| Hamilton | A revitalized city with a rich history and a growing arts community, Hamilton is perfect for those looking for a cultural experience. | Fitton Center for Creative Arts, Butler County Historical Society, The Pyramid Hill Sculpture Park, Hamilton Flea, Great Miami River |
| Beavercreek | An affluent suburb with easy access to Dayton, well-known for its shopping, dining, and recreational options, appealing to a range of visitors. | Beavercreek Wetlands Preserve, The Greene Town Center, Wright State University, Beavercreek Community Park, Dayton Mall |
Understanding Airbnb License Requirements & STR Laws in Liberty Township (2026)
While Liberty Township, Ohio, United States currently shows low STR regulations, specific Airbnb license requirements might still exist or change. Always verify the latest short term rental regulations and Airbnb license requirements directly with local government authorities for Liberty Township to ensure full compliance before hosting.
(Source: AirROI data, 2026, finding no licensed listings among those analyzed)
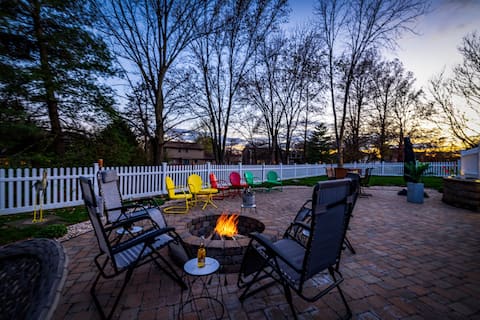
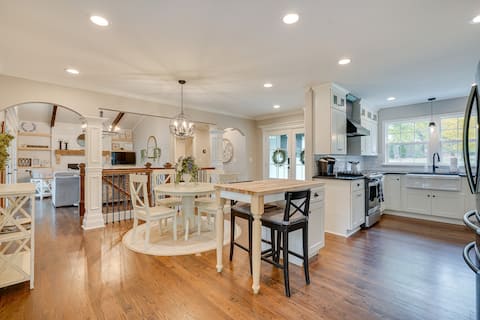
Top Performing Airbnb Properties in Liberty Township (2026)
Benchmark your potential! Explore examples of top-performing Airbnb properties in Liberty Townshipbased on Trailing Twelve Month (TTM) revenue. Analyze their characteristics, revenue, occupancy rate, and ADR to understand what drives success in this market.
Versatility on Princeton
Entire Place • 6 bedrooms

Cheerful 6-Bedroom Villa with fishing pond.
Entire Place • 6 bedrooms

KingsIsland~Sauna~Arcade~22miZoo~5Bd3ba~PlayArea
Entire Place • 5 bedrooms

Rustic Log Cabin on Eleven Acres - Sleeps 24
Entire Place • 7 bedrooms

Suburban paradise in Liberty TWP
Entire Place • 5 bedrooms
Powell Home w/ Fire Pit - 5 Mi to Columbus Zoo!
Entire Place • 5 bedrooms
Note: Performance varies based on location, size, amenities, seasonality, and management quality. Data reflects the past 12 months.
Top Performing Airbnb Hosts in Liberty Township (2026)
Learn from the best! This table showcases top-performing Airbnb hosts in Liberty Township based on the number of properties managed and estimated total revenue over the past year. Analyze their scale and performance metrics.
| Host Name | Properties | Grossing Revenue | Stay Reviews | Avg Rating |
|---|---|---|---|---|
| Jason | 16 | $570,707 | 696 | 4.83/5.0 |
| Michael | 1 | $116,294 | 20 | 4.95/5.0 |
| Reshma | 1 | $103,718 | 92 | 4.90/5.0 |
| Karthik | 1 | $90,564 | 26 | 4.42/5.0 |
| Evolve | 1 | $75,784 | 49 | 4.69/5.0 |
| Ryan | 1 | $66,386 | 75 | 4.80/5.0 |
| Asal | 1 | $66,177 | 12 | 4.67/5.0 |
| Venkat | 1 | $64,040 | 78 | 4.91/5.0 |
| J V | 3 | $62,967 | 20 | 4.83/5.0 |
| Eric | 1 | $58,864 | 28 | 4.96/5.0 |
Analyzing the strategies of top hosts, such as their property selection, pricing, and guest communication, can offer valuable lessons for optimizing your own Airbnb operations in Liberty Township.
Dive Deeper: Advanced Liberty Township STR Market Data (2026)
Ready to unlock more insights? AirROI provides access to advanced metrics and comprehensive Airbnb data for Liberty Township. Explore detailed analytics beyond this report to refine your investment strategy, optimize pricing, and maximize your vacation rental profits.
Explore Advanced MetricsLiberty Township Short-Term Rental Market Composition (2026): Property & Room Types
Room Type Distribution
Property Type Distribution
Market Composition Insights for Liberty Township
- The Liberty Township Airbnb market composition is heavily skewed towards Entire Home/Apt listings, which make up 84.4% of the 64 active rentals. This indicates strong guest preference for privacy and space.
- Looking at the property type distribution in Liberty Township, House properties are the most common (62.5%), reflecting the local real estate landscape.
- Houses represent a significant 62.5% portion, catering likely to families or larger groups.
- Smaller segments like hotel/boutique (combined 4.7%) offer potential for unique stay experiences.
Liberty Township Airbnb Room Capacity Analysis (2026): Bedroom Distribution
Distribution of Listings by Number of Bedrooms
Room Capacity Insights for Liberty Township
- The dominant room capacity in Liberty Township is 1 bedroom listings, making up 20.3% of the market. This suggests a strong demand for properties suitable for couples or solo travelers.
- Together, 1 bedroom and 5+ bedrooms properties represent 39.1% of the active Airbnb listings in Liberty Township, indicating a high concentration in these sizes.
- A significant 50.1% of listings offer 3+ bedrooms, catering to larger groups and families seeking more space in Liberty Township.
Liberty Township Vacation Rental Guest Capacity Trends (2026)
Distribution of Listings by Guest Capacity
Guest Capacity Insights for Liberty Township
- The most common guest capacity trend in Liberty Township vacation rentals is listings accommodating 8+ guests (37.5%). This suggests the primary traveler segment is likely larger groups.
- Properties designed for 8+ guests and 4 guests dominate the Liberty Township STR market, accounting for 54.7% of listings.
- 56.3% of properties accommodate 6+ guests, serving the market segment for larger families or group travel in Liberty Township.
- On average, properties in Liberty Township are equipped to host 5.1 guests.
Liberty Township Airbnb Booking Patterns (2026): Available vs. Booked Days
Available Days Distribution
Booked Days Distribution
Booking Pattern Insights for Liberty Township
- The most common availability pattern in Liberty Township falls within the 271-366 days range, representing 51.6% of listings. This suggests many properties have significant open periods on their calendars.
- Approximately 87.5% of listings show high availability (181+ days open annually), indicating potential for increased bookings or specific owner usage patterns.
- For booked days, the 91-180 days range is most frequent in Liberty Township (35.9%), reflecting common guest stay durations or potential owner blocking patterns.
- A notable 14.1% of properties secure long booking periods (181+ days booked per year), highlighting successful long-term rental strategies or significant owner usage.
Liberty Township Airbnb Minimum Stay Requirements Analysis
Distribution of Listings by Minimum Night Requirement
1 Night
13 listings
20.3% of total
2 Nights
25 listings
39.1% of total
3 Nights
3 listings
4.7% of total
4-6 Nights
2 listings
3.1% of total
7-29 Nights
6 listings
9.4% of total
30+ Nights
15 listings
23.4% of total
Key Insights
- The most prevalent minimum stay requirement in Liberty Township is 2 Nights, adopted by 39.1% of listings. This highlights the market's preference for shorter, flexible bookings.
- A significant segment (23.4%) caters to monthly stays (30+ nights) in Liberty Township, pointing to opportunities in the extended-stay market.
Recommendations
- Align with the market by considering a 2 Nights minimum stay, as 39.1% of Liberty Township hosts use this setting.
- If feasible, allowing 1-night stays, especially midweek or during low season, could capture last-minute bookings, as only 20.3% currently do.
- Explore offering discounts for stays of 30+ nights to attract the 23.4% of the market seeking extended stays.
- Adjust minimum nights based on seasonality – potentially shorter during low season and longer during peak demand periods in Liberty Township.
Liberty Township Airbnb Cancellation Policy Trends Analysis (2026)
Super Strict 30 Days
1 listings
1.6% of total
Flexible
15 listings
23.8% of total
Moderate
15 listings
23.8% of total
Firm
26 listings
41.3% of total
Strict
6 listings
9.5% of total
Cancellation Policy Insights for Liberty Township
- The prevailing Airbnb cancellation policy trend in Liberty Township is Firm, used by 41.3% of listings.
- A majority (50.8%) of hosts in Liberty Township utilize Firm or Strict policies, indicating a market where hosts prioritize booking security.
- Strict cancellation policies are quite rare (9.5%), potentially making listings with this policy less competitive unless justified by high demand or property type.
Recommendations for Hosts
- Consider adopting a Firm policy to align with the 41.3% market standard in Liberty Township.
- Using a Strict policy might deter some guests, as only 9.5% of listings use it. Evaluate if potential revenue protection outweighs possible lower booking rates.
- Regularly review your cancellation policy against competitors and market demand shifts in Liberty Township.
Liberty Township STR Booking Lead Time Analysis (2026)
Average Booking Lead Time by Month
Booking Lead Time Insights for Liberty Township
- The overall average booking lead time for vacation rentals in Liberty Township is 41 days.
- Guests book furthest in advance for stays during May (average 83 days), likely coinciding with peak travel demand or local events.
- The shortest booking windows occur for stays in January (average 11 days), indicating more last-minute travel plans during this time.
- Seasonally, Summer (50 days avg.) sees the longest lead times, while Winter (21 days avg.) has the shortest, reflecting typical travel planning cycles.
Recommendations for Hosts
- Use the overall average lead time (41 days) as a baseline for your pricing and availability strategy in Liberty Township.
- For May stays, consider implementing length-of-stay discounts or slightly higher rates for bookings made less than 83 days out to capitalize on advance planning.
- During January, focus on last-minute booking availability and promotions, as guests book with very short notice (11 days avg.).
- Target marketing efforts for the Summer season well in advance (at least 50 days) to capture early planners.
- Monitor your own booking lead times against these Liberty Township averages to identify opportunities for dynamic pricing adjustments.
Popular & Essential Airbnb Amenities in Liberty Township (2026)
Amenity Prevalence
Amenity Insights for Liberty Township
- Essential amenities in Liberty Township that guests expect include: Wifi, Smoke alarm, Free parking on premises. Lacking these (any) could significantly impact bookings.
- Popular amenities like Heating, Air conditioning, TV are common but not universal. Offering these can provide a competitive edge.
Recommendations for Hosts
- Ensure your listing includes all essential amenities for Liberty Township: Wifi, Smoke alarm, Free parking on premises.
- Prioritize adding missing essentials: Smoke alarm, Free parking on premises.
- Consider adding popular differentiators like Heating or Air conditioning to increase appeal.
- Highlight unique or less common amenities you offer (e.g., hot tub, dedicated workspace, EV charger) in your listing description and photos.
- Regularly check competitor amenities in Liberty Township to stay competitive.
Liberty Township Airbnb Guest Demographics & Profile Analysis (2026)
Guest Profile Summary for Liberty Township
- The typical guest profile for Airbnb in Liberty Township consists of primarily domestic travelers (98%), often arriving from nearby Columbus, typically belonging to the Post-2000s (Gen Z/Alpha) group (50%), primarily speaking English or Spanish.
- Domestic travelers account for 98.1% of guests.
- Key international markets include United States (98.1%) and Canada (0.3%).
- Top languages spoken are English (76.1%) followed by Spanish (9.7%).
- A significant demographic segment is the Post-2000s (Gen Z/Alpha) group, representing 50% of guests.
Recommendations for Hosts
- Target domestic marketing efforts towards travelers from Columbus and Cincinnati.
- Tailor amenities and listing descriptions to appeal to the dominant Post-2000s (Gen Z/Alpha) demographic (e.g., highlight fast WiFi, smart home features, local guides).
- Highlight unique local experiences or amenities relevant to the primary guest profile.
- Consider seasonal promotions aligned with peak travel times for key origin markets.
Nearby Short-Term Rental Market Comparison
How does the Liberty Township Airbnb market stack up against its neighbors? Compare key performance metrics like average monthly revenue, ADR, and occupancy rates in surrounding areas to understand the broader regional STR landscape.
| Market | Active Properties | Monthly Revenue | Daily Rate | Avg. Occupancy |
|---|---|---|---|---|
| Sugar Grove | 16 | $6,172 | $489.99 | 43% |
| Creola | 18 | $5,899 | $403.00 | 53% |
| Hocking County | 11 | $5,712 | $508.21 | 49% |
| Rockbridge | 229 | $5,257 | $400.48 | 46% |
| Berlin Township | 11 | $5,023 | $386.97 | 46% |
| Logan | 688 | $4,907 | $388.67 | 45% |
| Berne Township | 15 | $4,897 | $490.66 | 37% |
| Swan Township | 111 | $4,727 | $334.40 | 49% |
| South Bloomingville | 129 | $4,565 | $312.34 | 48% |
| Laurelville | 145 | $4,519 | $348.68 | 45% |