Lebanon Airbnb Market Analysis 2026: Short Term Rental Data & Vacation Rental Statistics in Ohio, United States
Is Airbnb profitable in Lebanon in 2026? Explore comprehensive Airbnb analytics for Lebanon, Ohio, United States to uncover income potential. This 2026 STR market report for Lebanon, based on AirROI data from February 2025 to January 2026, reveals key trends in the niche market of 30 active listings.
Whether you're considering an Airbnb investment in Lebanon, optimizing your existing vacation rental, or exploring rental arbitrage opportunities, understanding the Lebanon Airbnb data is crucial. Leveraging the low regulation environment is key to maximizing your short term rental income potential. Let's dive into the specifics.
Key Lebanon Airbnb Performance Metrics Overview
Monthly Airbnb Revenue Variations & Income Potential in Lebanon (2026)
Understanding the monthly revenue variations for Airbnb listings in Lebanon is key to maximizing your short term rental income potential. Seasonality significantly impacts earnings. Our analysis, based on data from the past 12 months, shows that the peak revenue month for STRs in Lebanon is typically July, while January often presents the lowest earnings, highlighting opportunities for strategic pricing adjustments during shoulder and low seasons. Explore the typical Airbnb income in Lebanon across different performance tiers:
- Best-in-class properties (Top 10%) achieve $6,126+ monthly, often utilizing dynamic pricing and superior guest experiences.
- Strong performing properties (Top 25%) earn $4,687 or more, indicating effective management and desirable locations/amenities.
- Typical properties (Median) generate around $3,011 per month, representing the average market performance.
- Entry-level properties (Bottom 25%) see earnings around $1,767, often with potential for optimization.
Average Monthly Airbnb Earnings Trend in Lebanon
Lebanon Airbnb Occupancy Rate Trends (2026)
Maximize your bookings by understanding the Lebanon STR occupancy trends. Seasonal demand shifts significantly influence how often properties are booked. Typically, Julysees the highest demand (peak season occupancy), while January experiences the lowest (low season). Effective strategies, like adjusting minimum stays or offering promotions, can boost occupancy during slower periods. Here's how different property tiers perform in Lebanon:
- Best-in-class properties (Top 10%) achieve 78%+ occupancy, indicating high desirability and potentially optimized availability.
- Strong performing properties (Top 25%) maintain 63% or higher occupancy, suggesting good market fit and guest satisfaction.
- Typical properties (Median) have an occupancy rate around 44%.
- Entry-level properties (Bottom 25%) average 28% occupancy, potentially facing higher vacancy.
Average Monthly Occupancy Rate Trend in Lebanon
Average Daily Rate (ADR) Airbnb Trends in Lebanon (2026)
Effective short term rental pricing strategy in Lebanon involves understanding monthly ADR fluctuations. The Average Daily Rate (ADR) for Airbnb in Lebanon typically peaks in September and dips lowest during February. Leveraging Airbnb dynamic pricing tools or strategies based on this seasonality can significantly boost revenue. Here's a look at the typical nightly rates achieved:
- Best-in-class properties (Top 10%) command rates of $511+ per night, often due to premium features or locations.
- Strong performing properties (Top 25%) achieve nightly rates of $261 or more.
- Typical properties (Median) charge around $190 per night.
- Entry-level properties (Bottom 25%) earn around $145 per night.
Average Daily Rate (ADR) Trend by Month in Lebanon
Get Live Lebanon Market Intelligence 👇

Explore Real-time Analytics
Airbnb Seasonality Analysis & Trends in Lebanon (2026)
Peak Season (July, October, August)
- Revenue averages $5,581 per month
- Occupancy rates average 56.6%
- Daily rates average $267
Shoulder Season
- Revenue averages $4,162 per month
- Occupancy maintains around 45.8%
- Daily rates hold near $252
Low Season (January, November, December)
- Revenue drops to average $2,504 per month
- Occupancy decreases to average 35.8%
- Daily rates adjust to average $255
Seasonality Insights for Lebanon
- The Airbnb seasonality in Lebanon shows highly seasonal trends requiring careful strategy. While the sections above show seasonal averages, it's also insightful to look at the extremes:
- During the high season, the absolute peak month showcases Lebanon's highest earning potential, with monthly revenues capable of climbing to $6,032, occupancy reaching a high of 64.8%, and ADRs peaking at $271.
- Conversely, the slowest single month of the year, typically falling within the low season, marks the market's lowest point. In this month, revenue might dip to $1,523, occupancy could drop to 24.7%, and ADRs may adjust down to $238.
- Understanding both the seasonal averages and these monthly peaks and troughs in revenue, occupancy, and ADR is crucial for maximizing your Airbnb profit potential in Lebanon.
Seasonal Strategies for Maximizing Profit
- Peak Season: Maximize revenue through premium pricing and potentially longer minimum stays. Ensure high availability.
- Low Season: Offer competitive pricing, special promotions (e.g., extended stay discounts), and flexible cancellation policies. Target off-season travelers like remote workers or budget-conscious guests.
- Shoulder Seasons: Implement dynamic pricing that balances peak and low rates. Target weekend travelers or specific events. Offer slightly more flexible terms than peak season.
- Regularly analyze your own performance against these Lebanon seasonality benchmarks and adjust your pricing and availability strategy accordingly.
Best Areas for Airbnb Investment in Lebanon (2026)
Exploring the top neighborhoods for short-term rentals in Lebanon? This section highlights key areas, outlining why they are attractive for hosts and guests, along with notable local attractions. Consider these locations based on your target guest profile and investment strategy.
| Neighborhood / Area | Why Host Here? (Target Guests & Appeal) | Key Attractions & Landmarks |
|---|---|---|
| Historic Downtown Lebanon | Charming historic district with beautifully preserved buildings and a strong sense of community. Ideal for guests who appreciate small-town charm and access to local shops and restaurants. | Lebanon Historic District, Lebanon Mason Metro Park, Golden Lamb Restaurant, Warren County Visitor Center, Countryside YMCA |
| Little Miami Scenic Trail | A recreational gem for outdoor enthusiasts, the Little Miami Scenic Trail offers biking and hiking opportunities. Attractive to nature lovers and travelers looking for an active getaway. | Little Miami River, Scenic Trail, Outdoor recreational activities, Nature walks, Biking paths |
| Cedar Ridge | A quiet neighborhood that provides a suburban feel, attracting families and business travelers alike. A great base for exploring Lebanon and surrounding attractions. | Local parks, Family-friendly environment, Proximity to shops, Lebanon City Park, Shopping areas |
| Glennwood Gardens | A beautiful nature park that serves as a natural retreat for visitors seeking peace and tranquility. Great for families or individuals looking for a nature escape close to the city. | Glennwood Gardens, Nature trails, Picnic areas, Birdwatching spots, Flora and fauna |
| Cincinnati Premium Outlets | A shopping haven for bargain hunters, attracting visitors looking for extensive shopping options and convenience. Ideal for those who come for the retail experience. | Cincinnati Premium Outlets, Variety of brand stores, Dining options, Family-friendly environment, Proximity to hotels |
| Warren County Fairgrounds | Host to various events throughout the year, this location draws visitors for fairs, festivals, and local events. Great for short-term stays during event periods. | Warren County Fair, Local events, Community gatherings, Family entertainment, Food vendors |
| Lebanon Countryside | Offers a rural experience with the charm of the countryside. Attracts those looking for a peaceful stay away from city life but close enough to urban amenities. | Countryside views, Peaceful environment, Farmers markets, Local farms, Rural charm |
| Lebanon Theatre Company | For those interested in the arts, the local theater company provides entertainment and a glimpse into the cultural life of Lebanon. Appeals to visitors looking for a mix of cultural activities. | Lebanon Theatre Company, Live performances, Community events, Cultural showcases, Workshops |
Understanding Airbnb License Requirements & STR Laws in Lebanon (2026)
While Lebanon, Ohio, United States currently shows low STR regulations, specific Airbnb license requirements might still exist or change. Always verify the latest short term rental regulations and Airbnb license requirements directly with local government authorities for Lebanon to ensure full compliance before hosting.
(Source: AirROI data, 2026, finding no licensed listings among those analyzed)
Top Performing Airbnb Properties in Lebanon (2026)
Benchmark your potential! Explore examples of top-performing Airbnb properties in Lebanonbased on Trailing Twelve Month (TTM) revenue. Analyze their characteristics, revenue, occupancy rate, and ADR to understand what drives success in this market.

The Estate at Byerpatch Farm | Luxury Rental
Entire Place • 6 bedrooms
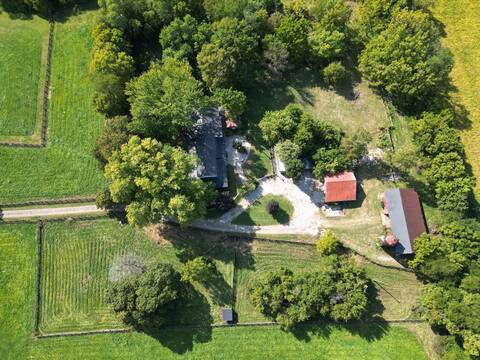
Historic, updated farm close to it all!
Entire Place • 6 bedrooms

Large Executive Home In Lebanon Golf Community
Entire Place • 5 bedrooms
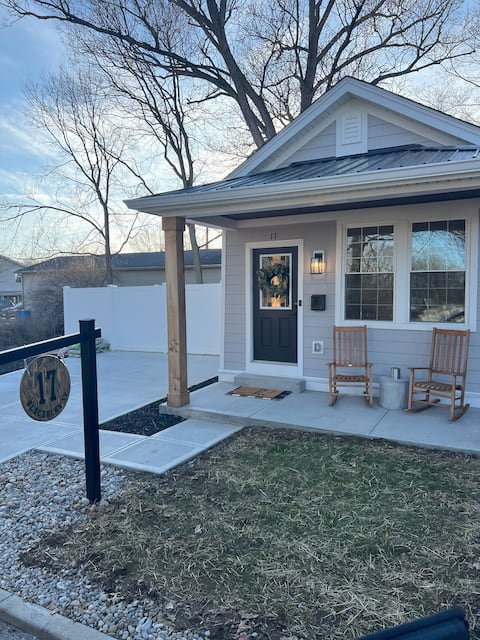
Bungalow in Downtown Lebanon
Entire Place • 1 bedroom
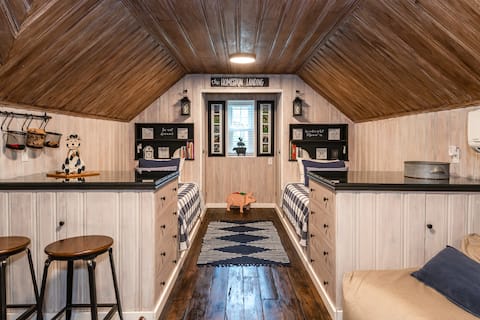
The Homespun Landing
Entire Place • 3 bedrooms
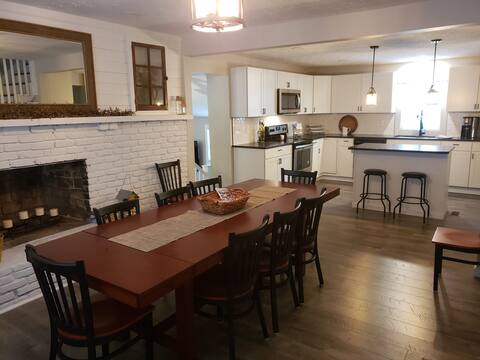
Cozy Cape Cod in Downtown Lebanon
Entire Place • 4 bedrooms
Note: Performance varies based on location, size, amenities, seasonality, and management quality. Data reflects the past 12 months.
Top Performing Airbnb Hosts in Lebanon (2026)
Learn from the best! This table showcases top-performing Airbnb hosts in Lebanon based on the number of properties managed and estimated total revenue over the past year. Analyze their scale and performance metrics.
| Host Name | Properties | Grossing Revenue | Stay Reviews | Avg Rating |
|---|---|---|---|---|
| Jennifer | 1 | $335,148 | 47 | 5.00/5.0 |
| April | 4 | $109,918 | 338 | 4.97/5.0 |
| Leidiane | 1 | $75,039 | 88 | 4.95/5.0 |
| Jason | 2 | $73,401 | 62 | 4.96/5.0 |
| Jessica | 1 | $55,493 | 109 | 4.97/5.0 |
| Rebecca | 1 | $53,329 | 193 | 4.98/5.0 |
| Susan | 1 | $52,497 | 161 | 4.76/5.0 |
| Mandi | 1 | $51,980 | 155 | 4.99/5.0 |
| Mary Ellen | 1 | $51,018 | 82 | 4.89/5.0 |
| Jeff | 1 | $49,513 | 74 | 5.00/5.0 |
Analyzing the strategies of top hosts, such as their property selection, pricing, and guest communication, can offer valuable lessons for optimizing your own Airbnb operations in Lebanon.
Dive Deeper: Advanced Lebanon STR Market Data (2026)
Ready to unlock more insights? AirROI provides access to advanced metrics and comprehensive Airbnb data for Lebanon. Explore detailed analytics beyond this report to refine your investment strategy, optimize pricing, and maximize your vacation rental profits.
Explore Advanced MetricsLebanon Short-Term Rental Market Composition (2026): Property & Room Types
Room Type Distribution
Property Type Distribution
Market Composition Insights for Lebanon
- The Lebanon Airbnb market composition is heavily skewed towards Entire Home/Apt listings, which make up 93.3% of the 30 active rentals. This indicates strong guest preference for privacy and space.
- Looking at the property type distribution in Lebanon, House properties are the most common (63.3%), reflecting the local real estate landscape.
- Houses represent a significant 63.3% portion, catering likely to families or larger groups.
- Smaller segments like unique stays (combined 3.3%) offer potential for unique stay experiences.
Lebanon Airbnb Room Capacity Analysis (2026): Bedroom Distribution
Distribution of Listings by Number of Bedrooms
Room Capacity Insights for Lebanon
- The dominant room capacity in Lebanon is 2 bedrooms listings, making up 30% of the market. This suggests a strong demand for properties suitable for couples or solo travelers.
- Together, 2 bedrooms and 3 bedrooms properties represent 50.0% of the active Airbnb listings in Lebanon, indicating a high concentration in these sizes.
- A significant 46.6% of listings offer 3+ bedrooms, catering to larger groups and families seeking more space in Lebanon.
Lebanon Vacation Rental Guest Capacity Trends (2026)
Distribution of Listings by Guest Capacity
Guest Capacity Insights for Lebanon
- The most common guest capacity trend in Lebanon vacation rentals is listings accommodating 8+ guests (36.7%). This suggests the primary traveler segment is likely larger groups.
- Properties designed for 8+ guests and 6 guests dominate the Lebanon STR market, accounting for 60.0% of listings.
- 60.0% of properties accommodate 6+ guests, serving the market segment for larger families or group travel in Lebanon.
- On average, properties in Lebanon are equipped to host 5.7 guests.
Lebanon Airbnb Booking Patterns (2026): Available vs. Booked Days
Available Days Distribution
Booked Days Distribution
Booking Pattern Insights for Lebanon
- The most common availability pattern in Lebanon falls within the 181-270 days range, representing 43.3% of listings. This suggests many properties have significant open periods on their calendars.
- Approximately 63.3% of listings show high availability (181+ days open annually), indicating potential for increased bookings or specific owner usage patterns.
- For booked days, the 91-180 days range is most frequent in Lebanon (43.3%), reflecting common guest stay durations or potential owner blocking patterns.
- A notable 36.6% of properties secure long booking periods (181+ days booked per year), highlighting successful long-term rental strategies or significant owner usage.
Lebanon Airbnb Minimum Stay Requirements Analysis
Distribution of Listings by Minimum Night Requirement
1 Night
7 listings
23.3% of total
2 Nights
12 listings
40% of total
4-6 Nights
1 listings
3.3% of total
7-29 Nights
2 listings
6.7% of total
30+ Nights
8 listings
26.7% of total
Key Insights
- The most prevalent minimum stay requirement in Lebanon is 2 Nights, adopted by 40% of listings. This highlights the market's preference for shorter, flexible bookings.
- A strong majority (63.3%) of the Lebanon Airbnb data shows acceptance of very short stays (1-2 nights), indicating a dynamic, high-turnover market.
- A significant segment (26.7%) caters to monthly stays (30+ nights) in Lebanon, pointing to opportunities in the extended-stay market.
Recommendations
- Align with the market by considering a 2 Nights minimum stay, as 40% of Lebanon hosts use this setting.
- If feasible, allowing 1-night stays, especially midweek or during low season, could capture last-minute bookings, as only 23.3% currently do.
- Explore offering discounts for stays of 30+ nights to attract the 26.7% of the market seeking extended stays.
- Adjust minimum nights based on seasonality – potentially shorter during low season and longer during peak demand periods in Lebanon.
Lebanon Airbnb Cancellation Policy Trends Analysis (2026)
Limited
1 listings
3.3% of total
Flexible
6 listings
20% of total
Moderate
10 listings
33.3% of total
Firm
12 listings
40% of total
Strict
1 listings
3.3% of total
Cancellation Policy Insights for Lebanon
- The prevailing Airbnb cancellation policy trend in Lebanon is Firm, used by 40% of listings.
- There's a relatively balanced mix between guest-friendly (53.3%) and stricter (43.3%) policies, offering choices for different guest needs.
- Strict cancellation policies are quite rare (3.3%), potentially making listings with this policy less competitive unless justified by high demand or property type.
Recommendations for Hosts
- Consider adopting a Firm policy to align with the 40% market standard in Lebanon.
- Using a Strict policy might deter some guests, as only 3.3% of listings use it. Evaluate if potential revenue protection outweighs possible lower booking rates.
- Regularly review your cancellation policy against competitors and market demand shifts in Lebanon.
Lebanon STR Booking Lead Time Analysis (2026)
Average Booking Lead Time by Month
Booking Lead Time Insights for Lebanon
- The overall average booking lead time for vacation rentals in Lebanon is 53 days.
- Guests book furthest in advance for stays during August (average 102 days), likely coinciding with peak travel demand or local events.
- The shortest booking windows occur for stays in February (average 14 days), indicating more last-minute travel plans during this time.
- Seasonally, Summer (74 days avg.) sees the longest lead times, while Spring (34 days avg.) has the shortest, reflecting typical travel planning cycles.
Recommendations for Hosts
- Use the overall average lead time (53 days) as a baseline for your pricing and availability strategy in Lebanon.
- For August stays, consider implementing length-of-stay discounts or slightly higher rates for bookings made less than 102 days out to capitalize on advance planning.
- During February, focus on last-minute booking availability and promotions, as guests book with very short notice (14 days avg.).
- Target marketing efforts for the Summer season well in advance (at least 74 days) to capture early planners.
- Monitor your own booking lead times against these Lebanon averages to identify opportunities for dynamic pricing adjustments.
Popular & Essential Airbnb Amenities in Lebanon (2026)
Amenity Prevalence
Amenity Insights for Lebanon
- Essential amenities in Lebanon that guests expect include: TV, Air conditioning, Cooking basics, Coffee maker, Refrigerator, Heating, Dryer, Bed linens, Dishes and silverware, Wifi. Lacking these (any) could significantly impact bookings.
Recommendations for Hosts
- Ensure your listing includes all essential amenities for Lebanon: TV, Air conditioning, Cooking basics, Coffee maker, Refrigerator, Heating, Dryer, Bed linens, Dishes and silverware, Wifi.
- Prioritize adding missing essentials: Dryer, Bed linens, Dishes and silverware, Wifi.
- Highlight unique or less common amenities you offer (e.g., hot tub, dedicated workspace, EV charger) in your listing description and photos.
- Regularly check competitor amenities in Lebanon to stay competitive.
Lebanon Airbnb Guest Demographics & Profile Analysis (2026)
Guest Profile Summary for Lebanon
- The typical guest profile for Airbnb in Lebanon consists of primarily domestic travelers (99%), often arriving from nearby Cincinnati, typically belonging to the Post-2000s (Gen Z/Alpha) group (50%), primarily speaking English or Spanish.
- Domestic travelers account for 98.6% of guests.
- Key international markets include United States (98.6%) and Canada (0.5%).
- Top languages spoken are English (83.7%) followed by Spanish (6.8%).
- A significant demographic segment is the Post-2000s (Gen Z/Alpha) group, representing 50% of guests.
Recommendations for Hosts
- Target domestic marketing efforts towards travelers from Cincinnati and Columbus.
- Tailor amenities and listing descriptions to appeal to the dominant Post-2000s (Gen Z/Alpha) demographic (e.g., highlight fast WiFi, smart home features, local guides).
- Highlight unique local experiences or amenities relevant to the primary guest profile.
- Consider seasonal promotions aligned with peak travel times for key origin markets.
Nearby Short-Term Rental Market Comparison
How does the Lebanon Airbnb market stack up against its neighbors? Compare key performance metrics like average monthly revenue, ADR, and occupancy rates in surrounding areas to understand the broader regional STR landscape.
| Market | Active Properties | Monthly Revenue | Daily Rate | Avg. Occupancy |
|---|---|---|---|---|
| Lawrenceburg | 65 | $4,477 | $360.32 | 45% |
| Crittenden | 18 | $3,944 | $261.97 | 48% |
| Walton | 22 | $3,840 | $225.35 | 58% |
| Burlington | 17 | $3,773 | $236.57 | 48% |
| Williamstown | 204 | $3,674 | $263.96 | 49% |
| Deerfield Township | 33 | $3,565 | $288.53 | 41% |
| Corinth | 17 | $3,457 | $270.49 | 48% |
| Oxford | 120 | $3,412 | $562.95 | 36% |
| Versailles | 61 | $3,375 | $350.32 | 44% |
| Delaware | 30 | $3,362 | $257.23 | 47% |