Green Township Airbnb Market Analysis 2026: Short Term Rental Data & Vacation Rental Statistics in Ohio, United States
Is Airbnb profitable in Green Township in 2026? Explore comprehensive Airbnb analytics for Green Township, Ohio, United States to uncover income potential. This 2026 STR market report for Green Township, based on AirROI data from February 2025 to January 2026, reveals key trends in the niche market of 31 active listings.
Whether you're considering an Airbnb investment in Green Township, optimizing your existing vacation rental, or exploring rental arbitrage opportunities, understanding the Green Township Airbnb data is crucial. Leveraging the low regulation environment is key to maximizing your short term rental income potential. Let's dive into the specifics.
Key Green Township Airbnb Performance Metrics Overview
Monthly Airbnb Revenue Variations & Income Potential in Green Township (2026)
Understanding the monthly revenue variations for Airbnb listings in Green Township is key to maximizing your short term rental income potential. Seasonality significantly impacts earnings. Our analysis, based on data from the past 12 months, shows that the peak revenue month for STRs in Green Township is typically July, while January often presents the lowest earnings, highlighting opportunities for strategic pricing adjustments during shoulder and low seasons. Explore the typical Airbnb income in Green Township across different performance tiers:
- Best-in-class properties (Top 10%) achieve $6,898+ monthly, often utilizing dynamic pricing and superior guest experiences.
- Strong performing properties (Top 25%) earn $3,404 or more, indicating effective management and desirable locations/amenities.
- Typical properties (Median) generate around $2,188 per month, representing the average market performance.
- Entry-level properties (Bottom 25%) see earnings around $1,368, often with potential for optimization.
Average Monthly Airbnb Earnings Trend in Green Township
Green Township Airbnb Occupancy Rate Trends (2026)
Maximize your bookings by understanding the Green Township STR occupancy trends. Seasonal demand shifts significantly influence how often properties are booked. Typically, Julysees the highest demand (peak season occupancy), while January experiences the lowest (low season). Effective strategies, like adjusting minimum stays or offering promotions, can boost occupancy during slower periods. Here's how different property tiers perform in Green Township:
- Best-in-class properties (Top 10%) achieve 73%+ occupancy, indicating high desirability and potentially optimized availability.
- Strong performing properties (Top 25%) maintain 55% or higher occupancy, suggesting good market fit and guest satisfaction.
- Typical properties (Median) have an occupancy rate around 40%.
- Entry-level properties (Bottom 25%) average 24% occupancy, potentially facing higher vacancy.
Average Monthly Occupancy Rate Trend in Green Township
Average Daily Rate (ADR) Airbnb Trends in Green Township (2026)
Effective short term rental pricing strategy in Green Township involves understanding monthly ADR fluctuations. The Average Daily Rate (ADR) for Airbnb in Green Township typically peaks in July and dips lowest during March. Leveraging Airbnb dynamic pricing tools or strategies based on this seasonality can significantly boost revenue. Here's a look at the typical nightly rates achieved:
- Best-in-class properties (Top 10%) command rates of $412+ per night, often due to premium features or locations.
- Strong performing properties (Top 25%) achieve nightly rates of $253 or more.
- Typical properties (Median) charge around $155 per night.
- Entry-level properties (Bottom 25%) earn around $105 per night.
Average Daily Rate (ADR) Trend by Month in Green Township
Get Live Green Township Market Intelligence 👇

Explore Real-time Analytics
Airbnb Seasonality Analysis & Trends in Green Township (2026)
Peak Season (July, June, August)
- Revenue averages $4,311 per month
- Occupancy rates average 48.4%
- Daily rates average $239
Shoulder Season
- Revenue averages $2,948 per month
- Occupancy maintains around 40.1%
- Daily rates hold near $231
Low Season (January, March, April)
- Revenue drops to average $2,285 per month
- Occupancy decreases to average 36.0%
- Daily rates adjust to average $215
Seasonality Insights for Green Township
- The Airbnb seasonality in Green Township shows highly seasonal trends requiring careful strategy. While the sections above show seasonal averages, it's also insightful to look at the extremes:
- During the high season, the absolute peak month showcases Green Township's highest earning potential, with monthly revenues capable of climbing to $4,845, occupancy reaching a high of 53.7%, and ADRs peaking at $247.
- Conversely, the slowest single month of the year, typically falling within the low season, marks the market's lowest point. In this month, revenue might dip to $2,105, occupancy could drop to 28.7%, and ADRs may adjust down to $206.
- Understanding both the seasonal averages and these monthly peaks and troughs in revenue, occupancy, and ADR is crucial for maximizing your Airbnb profit potential in Green Township.
Seasonal Strategies for Maximizing Profit
- Peak Season: Maximize revenue through premium pricing and potentially longer minimum stays. Ensure high availability.
- Low Season: Offer competitive pricing, special promotions (e.g., extended stay discounts), and flexible cancellation policies. Target off-season travelers like remote workers or budget-conscious guests.
- Shoulder Seasons: Implement dynamic pricing that balances peak and low rates. Target weekend travelers or specific events. Offer slightly more flexible terms than peak season.
- Regularly analyze your own performance against these Green Township seasonality benchmarks and adjust your pricing and availability strategy accordingly.
Best Areas for Airbnb Investment in Green Township (2026)
Exploring the top neighborhoods for short-term rentals in Green Township? This section highlights key areas, outlining why they are attractive for hosts and guests, along with notable local attractions. Consider these locations based on your target guest profile and investment strategy.
| Neighborhood / Area | Why Host Here? (Target Guests & Appeal) | Key Attractions & Landmarks |
|---|---|---|
| Green Township Center | The heart of Green Township with convenient access to shopping, dining, and recreational parks. It's a great hub for families and visitors looking for local community experiences. | Green Township Park, Dellecker Park, Tennis Center of Green Township, Green Township Library, Shopping areas at Glenway Crossing |
| Mount Healthy | Close to Green Township, Mount Healthy offers suburban charm with access to local restaurants and parks. It's an ideal location for visitors looking for a quieter stay while remaining close to urban amenities. | Mount Healthy Park, Mount Healthy Historic District, St. Paul Community Baptist Church, Local restaurants and cafes |
| Westwood | A nearby neighborhood with a family-friendly atmosphere, Westwood features local shops and green spaces, making it ideal for visitors wanting a suburban getaway with city access. | Westwood Town Hall, Oak Hills Park, Local eateries and shops, Green Township Historical Society, Westwood Northern Boulevard area |
| Cincinnati Zoo Area | Just a short drive from Green Township, the Cincinnati Zoo attracts families and animal lovers. Hosting here can cater to zoo visitors looking for nearby accommodations. | Cincinnati Zoo & Botanical Garden, Cincinnati Museum Center, Eden Park, Fiona the Hippo Statue, Local parks and dining options |
| Cincinnati Downtown | Downtown Cincinnati is a vibrant location with arts, dining, and entertainment. Hosts can attract business travelers or tourists looking for a city experience close to Green Township. | Fountain Square, Findlay Market, Cincinnati Art Museum, Smale Riverfront Park, Over-the-Rhine District |
| Oakley | Oakley is a growing neighborhood with a vibrant retail district. Perfect for visitors wanting a mix of suburban comfort and urban excitement, with easy access to surrounding areas. | Oakley Station, Local restaurants and shops, Oakley Recreation Center, Madisonville Rec Center, Nearby parks |
| Mason | A bit farther yet highly popular for family visits, Mason is home to Kings Island amusement park and hosts many tourists, making it great for Airbnb investments. | Kings Island Amusement Park, Cormorant Park, Local shopping areas, Various eateries, Great parks and recreation areas |
| Florence | Just a short drive from Green Township, Florence offers convenient access to shopping and entertainment options. It’s good for hosting families visiting nearby attractions. | Florence Mall, St. Barbara Church, Local parks, Nearby entertainment venues, Cincinnati Golf Club |
Understanding Airbnb License Requirements & STR Laws in Green Township (2026)
While Green Township, Ohio, United States currently shows low STR regulations, specific Airbnb license requirements might still exist or change. Always verify the latest short term rental regulations and Airbnb license requirements directly with local government authorities for Green Township to ensure full compliance before hosting.
(Source: AirROI data, 2026, finding no licensed listings among those analyzed)
Top Performing Airbnb Properties in Green Township (2026)
Benchmark your potential! Explore examples of top-performing Airbnb properties in Green Townshipbased on Trailing Twelve Month (TTM) revenue. Analyze their characteristics, revenue, occupancy rate, and ADR to understand what drives success in this market.
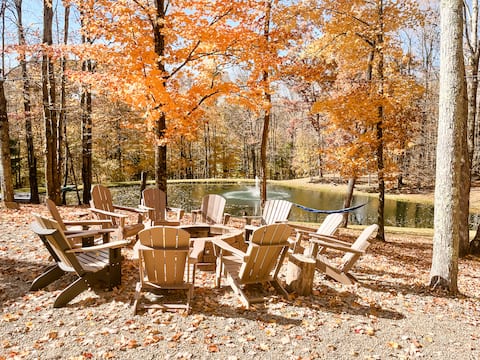
Fire Pit + Pond + Space to Unwind Together
Entire Place • 5 bedrooms

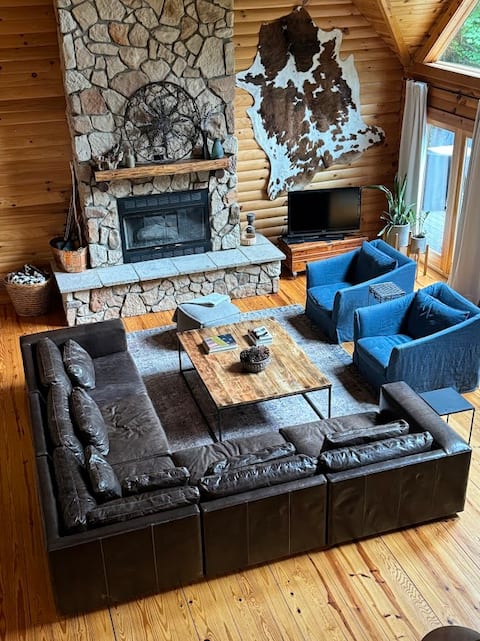
Creekbank Chalet
Entire Place • 3 bedrooms

Hot Tub • Fire Pit • Pool Table • Ping Pong
Entire Place • 2 bedrooms
Trove of Trees Log Cabin in Mohican on 24+ acres
Entire Place • 4 bedrooms
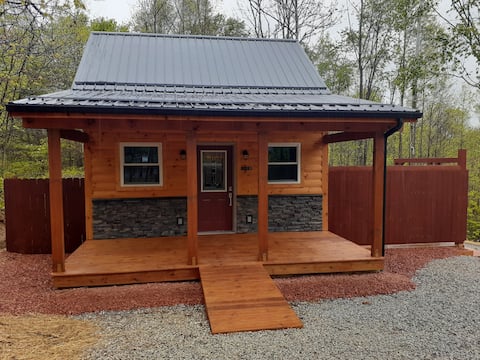
Pet Friendly, Hot Tub, Secluded
Entire Place • 1 bedroom
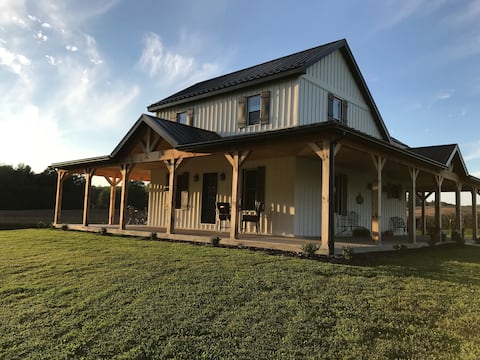
Raylin Farmhouse Mohican Area Vacation Rental
Entire Place • 3 bedrooms
Note: Performance varies based on location, size, amenities, seasonality, and management quality. Data reflects the past 12 months.
Top Performing Airbnb Hosts in Green Township (2026)
Learn from the best! This table showcases top-performing Airbnb hosts in Green Township based on the number of properties managed and estimated total revenue over the past year. Analyze their scale and performance metrics.
| Host Name | Properties | Grossing Revenue | Stay Reviews | Avg Rating |
|---|---|---|---|---|
| Jodi | 2 | $244,290 | 199 | 5.00/5.0 |
| Seth | 1 | $71,351 | 265 | 5.00/5.0 |
| Lauren | 1 | $66,757 | 65 | 4.89/5.0 |
| Kathy | 2 | $62,852 | 193 | 4.82/5.0 |
| Chris | 2 | $52,605 | 113 | 5.00/5.0 |
| Jeremy | 1 | $38,626 | 74 | 4.92/5.0 |
| Linda | 1 | $38,008 | 58 | 4.98/5.0 |
| Valley View Cottage | 1 | $37,381 | 33 | 5.00/5.0 |
| Melissa | 1 | $36,591 | 45 | 5.00/5.0 |
| Justin | 1 | $31,492 | 233 | 4.96/5.0 |
Analyzing the strategies of top hosts, such as their property selection, pricing, and guest communication, can offer valuable lessons for optimizing your own Airbnb operations in Green Township.
Dive Deeper: Advanced Green Township STR Market Data (2026)
Ready to unlock more insights? AirROI provides access to advanced metrics and comprehensive Airbnb data for Green Township. Explore detailed analytics beyond this report to refine your investment strategy, optimize pricing, and maximize your vacation rental profits.
Explore Advanced MetricsGreen Township Short-Term Rental Market Composition (2026): Property & Room Types
Room Type Distribution
Property Type Distribution
Market Composition Insights for Green Township
- The Green Township Airbnb market composition is heavily skewed towards Entire Home/Apt listings, which make up 93.5% of the 31 active rentals. This indicates strong guest preference for privacy and space.
- Looking at the property type distribution in Green Township, House properties are the most common (61.3%), reflecting the local real estate landscape.
- Houses represent a significant 61.3% portion, catering likely to families or larger groups.
Green Township Airbnb Room Capacity Analysis (2026): Bedroom Distribution
Distribution of Listings by Number of Bedrooms
Room Capacity Insights for Green Township
- The dominant room capacity in Green Township is 2 bedrooms listings, making up 32.3% of the market. This suggests a strong demand for properties suitable for couples or solo travelers.
- Together, 2 bedrooms and 3 bedrooms properties represent 58.1% of the active Airbnb listings in Green Township, indicating a high concentration in these sizes.
- A significant 38.7% of listings offer 3+ bedrooms, catering to larger groups and families seeking more space in Green Township.
Green Township Vacation Rental Guest Capacity Trends (2026)
Distribution of Listings by Guest Capacity
Guest Capacity Insights for Green Township
- The most common guest capacity trend in Green Township vacation rentals is listings accommodating 8+ guests (25.8%). This suggests the primary traveler segment is likely larger groups.
- Properties designed for 8+ guests and 4 guests dominate the Green Township STR market, accounting for 48.4% of listings.
- 42.0% of properties accommodate 6+ guests, serving the market segment for larger families or group travel in Green Township.
- On average, properties in Green Township are equipped to host 4.9 guests.
Green Township Airbnb Booking Patterns (2026): Available vs. Booked Days
Available Days Distribution
Booked Days Distribution
Booking Pattern Insights for Green Township
- The most common availability pattern in Green Township falls within the 181-270 days range, representing 41.9% of listings. This suggests many properties have significant open periods on their calendars.
- Approximately 80.6% of listings show high availability (181+ days open annually), indicating potential for increased bookings or specific owner usage patterns.
- For booked days, the 91-180 days range is most frequent in Green Township (41.9%), reflecting common guest stay durations or potential owner blocking patterns.
- A notable 22.6% of properties secure long booking periods (181+ days booked per year), highlighting successful long-term rental strategies or significant owner usage.
Green Township Airbnb Minimum Stay Requirements Analysis
Distribution of Listings by Minimum Night Requirement
1 Night
12 listings
38.7% of total
2 Nights
8 listings
25.8% of total
3 Nights
1 listings
3.2% of total
7-29 Nights
4 listings
12.9% of total
30+ Nights
6 listings
19.4% of total
Key Insights
- The most prevalent minimum stay requirement in Green Township is 1 Night, adopted by 38.7% of listings. This highlights the market's preference for shorter, flexible bookings.
- A strong majority (64.5%) of the Green Township Airbnb data shows acceptance of very short stays (1-2 nights), indicating a dynamic, high-turnover market.
- A significant segment (19.4%) caters to monthly stays (30+ nights) in Green Township, pointing to opportunities in the extended-stay market.
Recommendations
- Align with the market by considering a 1 Night minimum stay, as 38.7% of Green Township hosts use this setting.
- Explore offering discounts for stays of 30+ nights to attract the 19.4% of the market seeking extended stays.
- Adjust minimum nights based on seasonality – potentially shorter during low season and longer during peak demand periods in Green Township.
Green Township Airbnb Cancellation Policy Trends Analysis (2026)
Flexible
11 listings
35.5% of total
Moderate
8 listings
25.8% of total
Firm
7 listings
22.6% of total
Strict
5 listings
16.1% of total
Cancellation Policy Insights for Green Township
- The prevailing Airbnb cancellation policy trend in Green Township is Flexible, used by 35.5% of listings.
- There's a relatively balanced mix between guest-friendly (61.3%) and stricter (38.7%) policies, offering choices for different guest needs.
Recommendations for Hosts
- Consider adopting a Flexible policy to align with the 35.5% market standard in Green Township.
- Regularly review your cancellation policy against competitors and market demand shifts in Green Township.
Green Township STR Booking Lead Time Analysis (2026)
Average Booking Lead Time by Month
Booking Lead Time Insights for Green Township
- The overall average booking lead time for vacation rentals in Green Township is 43 days.
- Guests book furthest in advance for stays during October (average 65 days), likely coinciding with peak travel demand or local events.
- The shortest booking windows occur for stays in February (average 15 days), indicating more last-minute travel plans during this time.
- Seasonally, Fall (57 days avg.) sees the longest lead times, while Winter (28 days avg.) has the shortest, reflecting typical travel planning cycles.
Recommendations for Hosts
- Use the overall average lead time (43 days) as a baseline for your pricing and availability strategy in Green Township.
- For October stays, consider implementing length-of-stay discounts or slightly higher rates for bookings made less than 65 days out to capitalize on advance planning.
- Target marketing efforts for the Fall season well in advance (at least 57 days) to capture early planners.
- Monitor your own booking lead times against these Green Township averages to identify opportunities for dynamic pricing adjustments.
Popular & Essential Airbnb Amenities in Green Township (2026)
Amenity Prevalence
Amenity Insights for Green Township
- Essential amenities in Green Township that guests expect include: Wifi, Heating, TV. Lacking these (any) could significantly impact bookings.
- Popular amenities like Smoke alarm, Bed linens, Air conditioning are common but not universal. Offering these can provide a competitive edge.
Recommendations for Hosts
- Ensure your listing includes all essential amenities for Green Township: Wifi, Heating, TV.
- Prioritize adding missing essentials: Heating, TV.
- Consider adding popular differentiators like Smoke alarm or Bed linens to increase appeal.
- Highlight unique or less common amenities you offer (e.g., hot tub, dedicated workspace, EV charger) in your listing description and photos.
- Regularly check competitor amenities in Green Township to stay competitive.
Green Township Airbnb Guest Demographics & Profile Analysis (2026)
Guest Profile Summary for Green Township
- The typical guest profile for Airbnb in Green Township consists of primarily domestic travelers (96%), often arriving from nearby Cincinnati, typically belonging to the Post-2000s (Gen Z/Alpha) group (50%), primarily speaking English or Spanish.
- Domestic travelers account for 96.1% of guests.
- Key international markets include United States (96.1%) and Netherlands (0.4%).
- Top languages spoken are English (79.2%) followed by Spanish (8.3%).
- A significant demographic segment is the Post-2000s (Gen Z/Alpha) group, representing 50% of guests.
Recommendations for Hosts
- Target domestic marketing efforts towards travelers from Cincinnati and Columbus.
- Tailor amenities and listing descriptions to appeal to the dominant Post-2000s (Gen Z/Alpha) demographic (e.g., highlight fast WiFi, smart home features, local guides).
- Highlight unique local experiences or amenities relevant to the primary guest profile.
- Consider seasonal promotions aligned with peak travel times for key origin markets.
Nearby Short-Term Rental Market Comparison
How does the Green Township Airbnb market stack up against its neighbors? Compare key performance metrics like average monthly revenue, ADR, and occupancy rates in surrounding areas to understand the broader regional STR landscape.
| Market | Active Properties | Monthly Revenue | Daily Rate | Avg. Occupancy |
|---|---|---|---|---|
| Sugar Grove | 16 | $6,172 | $489.99 | 43% |
| Creola | 18 | $5,899 | $403.00 | 53% |
| Hocking County | 11 | $5,712 | $508.21 | 49% |
| Rockbridge | 229 | $5,257 | $400.48 | 46% |
| Berlin Township | 11 | $5,023 | $386.97 | 46% |
| Logan | 688 | $4,907 | $388.67 | 45% |
| Berne Township | 15 | $4,897 | $490.66 | 37% |
| Swan Township | 111 | $4,727 | $334.40 | 49% |
| South Bloomingville | 129 | $4,565 | $312.34 | 48% |
| Laurelville | 145 | $4,519 | $348.68 | 45% |