Fort Shawnee Airbnb Market Analysis 2026: Short Term Rental Data & Vacation Rental Statistics in Ohio, United States
Is Airbnb profitable in Fort Shawnee in 2026? Explore comprehensive Airbnb analytics for Fort Shawnee, Ohio, United States to uncover income potential. This 2026 STR market report for Fort Shawnee, based on AirROI data from February 2025 to January 2026, reveals key trends in the niche market of 22 active listings.
Whether you're considering an Airbnb investment in Fort Shawnee, optimizing your existing vacation rental, or exploring rental arbitrage opportunities, understanding the Fort Shawnee Airbnb data is crucial. Leveraging the low regulation environment is key to maximizing your short term rental income potential. Let's dive into the specifics.
Key Fort Shawnee Airbnb Performance Metrics Overview
Monthly Airbnb Revenue Variations & Income Potential in Fort Shawnee (2026)
Understanding the monthly revenue variations for Airbnb listings in Fort Shawnee is key to maximizing your short term rental income potential. Seasonality significantly impacts earnings. Our analysis, based on data from the past 12 months, shows that the peak revenue month for STRs in Fort Shawnee is typically July, while November often presents the lowest earnings, highlighting opportunities for strategic pricing adjustments during shoulder and low seasons. Explore the typical Airbnb income in Fort Shawnee across different performance tiers:
- Best-in-class properties (Top 10%) achieve $1,744+ monthly, often utilizing dynamic pricing and superior guest experiences.
- Strong performing properties (Top 25%) earn $1,431 or more, indicating effective management and desirable locations/amenities.
- Typical properties (Median) generate around $847 per month, representing the average market performance.
- Entry-level properties (Bottom 25%) see earnings around $470, often with potential for optimization.
Average Monthly Airbnb Earnings Trend in Fort Shawnee
Fort Shawnee Airbnb Occupancy Rate Trends (2026)
Maximize your bookings by understanding the Fort Shawnee STR occupancy trends. Seasonal demand shifts significantly influence how often properties are booked. Typically, Maysees the highest demand (peak season occupancy), while November experiences the lowest (low season). Effective strategies, like adjusting minimum stays or offering promotions, can boost occupancy during slower periods. Here's how different property tiers perform in Fort Shawnee:
- Best-in-class properties (Top 10%) achieve 84%+ occupancy, indicating high desirability and potentially optimized availability.
- Strong performing properties (Top 25%) maintain 61% or higher occupancy, suggesting good market fit and guest satisfaction.
- Typical properties (Median) have an occupancy rate around 39%.
- Entry-level properties (Bottom 25%) average 21% occupancy, potentially facing higher vacancy.
Average Monthly Occupancy Rate Trend in Fort Shawnee
Average Daily Rate (ADR) Airbnb Trends in Fort Shawnee (2026)
Effective short term rental pricing strategy in Fort Shawnee involves understanding monthly ADR fluctuations. The Average Daily Rate (ADR) for Airbnb in Fort Shawnee typically peaks in June and dips lowest during February. Leveraging Airbnb dynamic pricing tools or strategies based on this seasonality can significantly boost revenue. Here's a look at the typical nightly rates achieved:
- Best-in-class properties (Top 10%) command rates of $86+ per night, often due to premium features or locations.
- Strong performing properties (Top 25%) achieve nightly rates of $63 or more.
- Typical properties (Median) charge around $58 per night.
- Entry-level properties (Bottom 25%) earn around $53 per night.
Average Daily Rate (ADR) Trend by Month in Fort Shawnee
Get Live Fort Shawnee Market Intelligence 👇

Explore Real-time Analytics
Airbnb Seasonality Analysis & Trends in Fort Shawnee (2026)
Peak Season (July, March, May)
- Revenue averages $1,167 per month
- Occupancy rates average 52.9%
- Daily rates average $61
Shoulder Season
- Revenue averages $993 per month
- Occupancy maintains around 45.6%
- Daily rates hold near $61
Low Season (February, November, December)
- Revenue drops to average $713 per month
- Occupancy decreases to average 33.1%
- Daily rates adjust to average $61
Seasonality Insights for Fort Shawnee
- The Airbnb seasonality in Fort Shawnee shows moderate seasonality with distinct peak and low periods. While the sections above show seasonal averages, it's also insightful to look at the extremes:
- During the high season, the absolute peak month showcases Fort Shawnee's highest earning potential, with monthly revenues capable of climbing to $1,237, occupancy reaching a high of 56.8%, and ADRs peaking at $62.
- Conversely, the slowest single month of the year, typically falling within the low season, marks the market's lowest point. In this month, revenue might dip to $646, occupancy could drop to 23.3%, and ADRs may adjust down to $60.
- Understanding both the seasonal averages and these monthly peaks and troughs in revenue, occupancy, and ADR is crucial for maximizing your Airbnb profit potential in Fort Shawnee.
Seasonal Strategies for Maximizing Profit
- Peak Season: Maximize revenue through premium pricing and potentially longer minimum stays. Ensure high availability.
- Low Season: Offer competitive pricing, special promotions (e.g., extended stay discounts), and flexible cancellation policies. Target off-season travelers like remote workers or budget-conscious guests.
- Shoulder Seasons: Implement dynamic pricing that balances peak and low rates. Target weekend travelers or specific events. Offer slightly more flexible terms than peak season.
- Regularly analyze your own performance against these Fort Shawnee seasonality benchmarks and adjust your pricing and availability strategy accordingly.
Best Areas for Airbnb Investment in Fort Shawnee (2026)
Exploring the top neighborhoods for short-term rentals in Fort Shawnee? This section highlights key areas, outlining why they are attractive for hosts and guests, along with notable local attractions. Consider these locations based on your target guest profile and investment strategy.
| Neighborhood / Area | Why Host Here? (Target Guests & Appeal) | Key Attractions & Landmarks |
|---|---|---|
| Miamisburg | Charming suburb of Dayton with a revitalized downtown area. Ideal for families and couples looking for a quieter retreat with access to parks and local attractions. | Miamisburg Mound, Miamisburg's Historic Downtown, Cox Arboretum MetroPark, Sycamore State Park, Cox Arboretum |
| Troy | Quaint small town with rich history and a strong community feel. Perfect for guests interested in local culture and the outdoors, with easy access to scenic parks. | Troy Hayner Cultural Center, Davis-Linden State Park, Troy Main Street, Treasure Island Park, The Overfield Tavern Museum |
| Bellefontaine | Known for its beautiful countryside and outdoor activities. Great for nature lovers and those seeking relaxation in a more rural setting. | McKinney Park, Bowers Park, Pine Lake Park, Hiking trails in the Logan County area, Local farmer's markets |
| Springfield | A city with a mix of history, sports, and nature. Attractive for families and visitors interested in both leisure and cultural experiences. | Hartman Rock Garden, Cedarville University, Springfield Museum of Art, Clark County Fairgrounds, Lagonda Water Park |
| Dayton | A major city in Ohio with a vibrant arts scene, rich history, and many attractions. Perfect for business travelers and tourists alike. | National Museum of the U.S. Air Force, Carillon Historical Park, Oregon District, Dayton Art Institute, Five Rivers MetroParks |
| Xenia | Historic town with a charming downtown area. Attracts guests looking for a quieter stay with access to local history and beautiful parks. | Xenia Station, Cox Arboretum MetroPark, Yellow Springs, Parks and nature trails, Various local restaurants |
| Sidney | A city combining small-town charm with big-city amenities. Great for visitors seeking convenience and a local feel. | Shelby County Historical Society, Lake Loramie State Park, Big Splash Family Aquatic Center, Sidney-Shelby County YMCA, Local dining and shopping options |
| Urbana | A peaceful city with a strong community and proximity to nature. Ideal for guests interested in relaxation and outdoor adventures. | Urbana University, Sycamore State Park, Urbana's Historic Downtown, Local vineyards and farms, Outdoor recreational activities |
Understanding Airbnb License Requirements & STR Laws in Fort Shawnee (2026)
While Fort Shawnee, Ohio, United States currently shows low STR regulations, specific Airbnb license requirements might still exist or change. Always verify the latest short term rental regulations and Airbnb license requirements directly with local government authorities for Fort Shawnee to ensure full compliance before hosting.
(Source: AirROI data, 2026, based on 5% licensed listings)
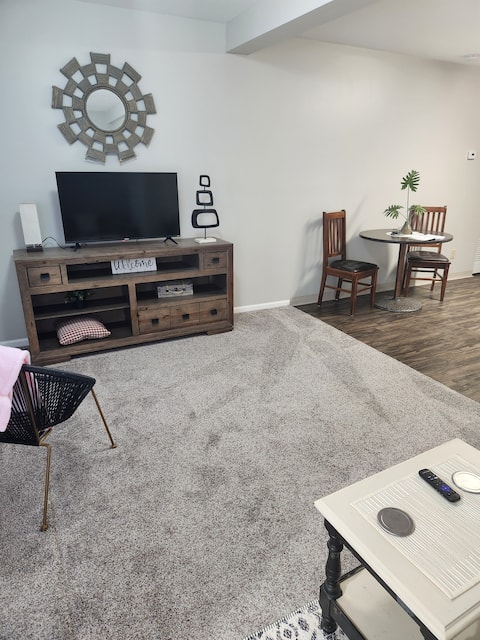
Top Performing Airbnb Properties in Fort Shawnee (2026)
Benchmark your potential! Explore examples of top-performing Airbnb properties in Fort Shawneebased on Trailing Twelve Month (TTM) revenue. Analyze their characteristics, revenue, occupancy rate, and ADR to understand what drives success in this market.

Comfy & Functional Efficiency Apartment #16
Entire Place • 1 bedroom
Flamingo 1 Person unit. No exceptions.
Entire Place • 1 bedroom

Blue Heron 1 Person Unit
Entire Place • 1 bedroom

Blue Lagoon. 1 person only 1 bedroom
Entire Place • 1 bedroom

Pier 41 1 person only
Entire Place • 1 bedroom

Travelers quiet one bedroom apt
Entire Place • 1 bedroom
Note: Performance varies based on location, size, amenities, seasonality, and management quality. Data reflects the past 12 months.
Top Performing Airbnb Hosts in Fort Shawnee (2026)
Learn from the best! This table showcases top-performing Airbnb hosts in Fort Shawnee based on the number of properties managed and estimated total revenue over the past year. Analyze their scale and performance metrics.
| Host Name | Properties | Grossing Revenue | Stay Reviews | Avg Rating |
|---|---|---|---|---|
| Shela | 10 | $82,353 | 212 | 4.97/5.0 |
| Corie | 7 | $27,178 | 66 | 4.97/5.0 |
| Premier Real Estate | 3 | $26,351 | 160 | 4.48/5.0 |
| Vicki | 1 | $5,019 | 11 | 4.91/5.0 |
| Tabitha | 1 | $5,010 | 5 | 4.60/5.0 |
Analyzing the strategies of top hosts, such as their property selection, pricing, and guest communication, can offer valuable lessons for optimizing your own Airbnb operations in Fort Shawnee.
Dive Deeper: Advanced Fort Shawnee STR Market Data (2026)
Ready to unlock more insights? AirROI provides access to advanced metrics and comprehensive Airbnb data for Fort Shawnee. Explore detailed analytics beyond this report to refine your investment strategy, optimize pricing, and maximize your vacation rental profits.
Explore Advanced MetricsFort Shawnee Short-Term Rental Market Composition (2026): Property & Room Types
Room Type Distribution
Property Type Distribution
Market Composition Insights for Fort Shawnee
- The Fort Shawnee Airbnb market composition is heavily skewed towards Entire Home/Apt listings, which make up 90.9% of the 22 active rentals. This indicates strong guest preference for privacy and space.
- Looking at the property type distribution in Fort Shawnee, Apartment/Condo properties are the most common (86.4%), reflecting the local real estate landscape.
Fort Shawnee Airbnb Room Capacity Analysis (2026): Bedroom Distribution
Distribution of Listings by Number of Bedrooms
Room Capacity Insights for Fort Shawnee
- The dominant room capacity in Fort Shawnee is 1 bedroom listings, making up 77.3% of the market. This suggests a strong demand for properties suitable for couples or solo travelers.
- Together, 1 bedroom and 2 bedrooms properties represent 81.8% of the active Airbnb listings in Fort Shawnee, indicating a high concentration in these sizes.
- With over half the market (77.3%) consisting of studios or 1-bedroom units, Fort Shawnee is particularly well-suited for individuals or couples.
- Listings with 3+ bedrooms (4.5%) represent a smaller niche, potentially indicating an underserved market for larger group accommodations in Fort Shawnee.
Fort Shawnee Vacation Rental Guest Capacity Trends (2026)
Distribution of Listings by Guest Capacity
Guest Capacity Insights for Fort Shawnee
- The most common guest capacity trend in Fort Shawnee vacation rentals is listings accommodating 1 guest (68.2%). This suggests the primary traveler segment is likely couples or solo travelers.
- Properties designed for 1 guest and 2 guests dominate the Fort Shawnee STR market, accounting for 81.8% of listings.
- A significant 81.8% of listings cater specifically to 1-2 guests, highlighting strong demand from couples and solo travelers in Fort Shawnee.
- Listings for large groups (6+ guests) are relatively rare (4.5%), potentially indicating an opportunity for hosts targeting this segment in Fort Shawnee.
- On average, properties in Fort Shawnee are equipped to host 1.5 guests.
Fort Shawnee Airbnb Booking Patterns (2026): Available vs. Booked Days
Available Days Distribution
Booked Days Distribution
Booking Pattern Insights for Fort Shawnee
- The most common availability pattern in Fort Shawnee falls within the 271-366 days range, representing 54.5% of listings. This suggests many properties have significant open periods on their calendars.
- Approximately 77.2% of listings show high availability (181+ days open annually), indicating potential for increased bookings or specific owner usage patterns.
- For booked days, the 31-90 days range is most frequent in Fort Shawnee (31.8%), reflecting common guest stay durations or potential owner blocking patterns.
- A notable 27.3% of properties secure long booking periods (181+ days booked per year), highlighting successful long-term rental strategies or significant owner usage.
Fort Shawnee Airbnb Minimum Stay Requirements Analysis
Distribution of Listings by Minimum Night Requirement
1 Night
2 listings
9.1% of total
2 Nights
1 listings
4.5% of total
4-6 Nights
11 listings
50% of total
7-29 Nights
6 listings
27.3% of total
30+ Nights
2 listings
9.1% of total
Key Insights
- The most prevalent minimum stay requirement in Fort Shawnee is 4-6 Nights, adopted by 50% of listings. This highlights the market's preference for longer commitments.
- Very short stays (1-2 nights) are less common (13.6%), suggesting hosts prefer slightly longer bookings to optimize turnover.
Recommendations
- Align with the market by considering a 4-6 Nights minimum stay, as 50% of Fort Shawnee hosts use this setting.
- If feasible, allowing 1-night stays, especially midweek or during low season, could capture last-minute bookings, as only 9.1% currently do.
- Explore offering discounts for stays of 30+ nights to attract the 9.1% of the market seeking extended stays.
- Adjust minimum nights based on seasonality – potentially shorter during low season and longer during peak demand periods in Fort Shawnee.
Fort Shawnee Airbnb Cancellation Policy Trends Analysis (2026)
Flexible
11 listings
50% of total
Moderate
4 listings
18.2% of total
Firm
5 listings
22.7% of total
Strict
2 listings
9.1% of total
Cancellation Policy Insights for Fort Shawnee
- The prevailing Airbnb cancellation policy trend in Fort Shawnee is Flexible, used by 50% of listings.
- There's a relatively balanced mix between guest-friendly (68.2%) and stricter (31.8%) policies, offering choices for different guest needs.
- Strict cancellation policies are quite rare (9.1%), potentially making listings with this policy less competitive unless justified by high demand or property type.
Recommendations for Hosts
- Consider adopting a Flexible policy to align with the 50% market standard in Fort Shawnee.
- Using a Strict policy might deter some guests, as only 9.1% of listings use it. Evaluate if potential revenue protection outweighs possible lower booking rates.
- Regularly review your cancellation policy against competitors and market demand shifts in Fort Shawnee.
Fort Shawnee STR Booking Lead Time Analysis (2026)
Average Booking Lead Time by Month
Booking Lead Time Insights for Fort Shawnee
- The overall average booking lead time for vacation rentals in Fort Shawnee is 16 days.
- Guests book furthest in advance for stays during November (average 28 days), likely coinciding with peak travel demand or local events.
- The shortest booking windows occur for stays in January (average 7 days), indicating more last-minute travel plans during this time.
- Seasonally, Spring (19 days avg.) sees the longest lead times, while Winter (15 days avg.) has the shortest, reflecting typical travel planning cycles.
Recommendations for Hosts
- Use the overall average lead time (16 days) as a baseline for your pricing and availability strategy in Fort Shawnee.
- For November stays, consider implementing length-of-stay discounts or slightly higher rates for bookings made less than 28 days out to capitalize on advance planning.
- During January, focus on last-minute booking availability and promotions, as guests book with very short notice (7 days avg.).
- Target marketing efforts for the Spring season well in advance (at least 19 days) to capture early planners.
- Monitor your own booking lead times against these Fort Shawnee averages to identify opportunities for dynamic pricing adjustments.
Popular & Essential Airbnb Amenities in Fort Shawnee (2026)
Amenity Prevalence
Amenity Insights for Fort Shawnee
- Essential amenities in Fort Shawnee that guests expect include: Hot water, Essentials, Wifi, Smoke alarm, Heating, Air conditioning, Free parking on premises, TV, Bed linens, Cooking basics. Lacking these (any) could significantly impact bookings.
Recommendations for Hosts
- Ensure your listing includes all essential amenities for Fort Shawnee: Hot water, Essentials, Wifi, Smoke alarm, Heating, Air conditioning, Free parking on premises, TV, Bed linens, Cooking basics.
- Prioritize adding missing essentials: Free parking on premises, TV, Bed linens, Cooking basics.
- Highlight unique or less common amenities you offer (e.g., hot tub, dedicated workspace, EV charger) in your listing description and photos.
- Regularly check competitor amenities in Fort Shawnee to stay competitive.
Fort Shawnee Airbnb Guest Demographics & Profile Analysis (2026)
Guest Profile Summary for Fort Shawnee
- The typical guest profile for Airbnb in Fort Shawnee consists of primarily domestic travelers (88%), often arriving from nearby Katy, typically belonging to the Post-2000s (Gen Z/Alpha) group (50%), primarily speaking English or Spanish.
- Domestic travelers account for 87.5% of guests.
- Key international markets include United States (87.5%) and South Africa (6.3%).
- Top languages spoken are English (66.7%) followed by Spanish (22.2%).
- A significant demographic segment is the Post-2000s (Gen Z/Alpha) group, representing 50% of guests.
Recommendations for Hosts
- Target domestic marketing efforts towards travelers from Katy and Dayton.
- Tailor amenities and listing descriptions to appeal to the dominant Post-2000s (Gen Z/Alpha) demographic (e.g., highlight fast WiFi, smart home features, local guides).
- Highlight unique local experiences or amenities relevant to the primary guest profile.
- Consider seasonal promotions aligned with peak travel times for key origin markets.
Nearby Short-Term Rental Market Comparison
How does the Fort Shawnee Airbnb market stack up against its neighbors? Compare key performance metrics like average monthly revenue, ADR, and occupancy rates in surrounding areas to understand the broader regional STR landscape.
| Market | Active Properties | Monthly Revenue | Daily Rate | Avg. Occupancy |
|---|---|---|---|---|
| Fremont | 16 | $4,898 | $436.31 | 42% |
| White Pigeon Township | 10 | $4,264 | $312.31 | 50% |
| Erie Township | 10 | $3,857 | $246.01 | 51% |
| Burlington | 17 | $3,773 | $236.57 | 48% |
| Deerfield Township | 33 | $3,565 | $288.53 | 41% |
| Lebanon | 30 | $3,554 | $277.26 | 44% |
| Oxford | 120 | $3,412 | $562.95 | 36% |
| Rome City | 13 | $3,390 | $323.31 | 40% |
| Delaware | 30 | $3,362 | $257.23 | 47% |
| Fabius Township | 18 | $3,281 | $384.81 | 35% |