Dublin Airbnb Market Analysis 2025: Short Term Rental Data & Vacation Rental Statistics in Ohio, United States
Is Airbnb profitable in Dublin in 2025? Explore comprehensive Airbnb analytics for Dublin, Ohio, United States to uncover income potential. This 2025 STR market report for Dublin, based on AirROI data from December 2024 to November 2025, reveals key trends in the niche market of 20 active listings.
Whether you're considering an Airbnb investment in Dublin, optimizing your existing vacation rental, or exploring rental arbitrage opportunities, understanding the Dublin Airbnb data is crucial. Leveraging the low regulation environment is key to maximizing your short term rental income potential. Let's dive into the specifics.
Key Dublin Airbnb Performance Metrics Overview
Monthly Airbnb Revenue Variations & Income Potential in Dublin (2025)
Understanding the monthly revenue variations for Airbnb listings in Dublin is key to maximizing your short term rental income potential. Seasonality significantly impacts earnings. Our analysis, based on data from the past 12 months, shows that the peak revenue month for STRs in Dublin is typically June, while January often presents the lowest earnings, highlighting opportunities for strategic pricing adjustments during shoulder and low seasons. Explore the typical Airbnb income in Dublin across different performance tiers:
- Best-in-class properties (Top 10%) achieve $14,006+ monthly, often utilizing dynamic pricing and superior guest experiences.
- Strong performing properties (Top 25%) earn $6,964 or more, indicating effective management and desirable locations/amenities.
- Typical properties (Median) generate around $3,332 per month, representing the average market performance.
- Entry-level properties (Bottom 25%) see earnings around $1,315, often with potential for optimization.
Average Monthly Airbnb Earnings Trend in Dublin
Dublin Airbnb Occupancy Rate Trends (2025)
Maximize your bookings by understanding the Dublin STR occupancy trends. Seasonal demand shifts significantly influence how often properties are booked. Typically, Augustsees the highest demand (peak season occupancy), while January experiences the lowest (low season). Effective strategies, like adjusting minimum stays or offering promotions, can boost occupancy during slower periods. Here's how different property tiers perform in Dublin:
- Best-in-class properties (Top 10%) achieve 87%+ occupancy, indicating high desirability and potentially optimized availability.
- Strong performing properties (Top 25%) maintain 76% or higher occupancy, suggesting good market fit and guest satisfaction.
- Typical properties (Median) have an occupancy rate around 44%.
- Entry-level properties (Bottom 25%) average 19% occupancy, potentially facing higher vacancy.
Average Monthly Occupancy Rate Trend in Dublin
Average Daily Rate (ADR) Airbnb Trends in Dublin (2025)
Effective short term rental pricing strategy in Dublin involves understanding monthly ADR fluctuations. The Average Daily Rate (ADR) for Airbnb in Dublin typically peaks in July and dips lowest during January. Leveraging Airbnb dynamic pricing tools or strategies based on this seasonality can significantly boost revenue. Here's a look at the typical nightly rates achieved:
- Best-in-class properties (Top 10%) command rates of $907+ per night, often due to premium features or locations.
- Strong performing properties (Top 25%) achieve nightly rates of $440 or more.
- Typical properties (Median) charge around $154 per night.
- Entry-level properties (Bottom 25%) earn around $106 per night.
Average Daily Rate (ADR) Trend by Month in Dublin
Get Live Dublin Market Intelligence 👇

Explore Real-time Analytics
Airbnb Seasonality Analysis & Trends in Dublin (2025)
Peak Season (June, May, September)
- Revenue averages $8,034 per month
- Occupancy rates average 48.8%
- Daily rates average $416
Shoulder Season
- Revenue averages $5,481 per month
- Occupancy maintains around 51.5%
- Daily rates hold near $418
Low Season (January, February, November)
- Revenue drops to average $3,235 per month
- Occupancy decreases to average 42.9%
- Daily rates adjust to average $401
Seasonality Insights for Dublin
- The Airbnb seasonality in Dublin shows highly seasonal trends requiring careful strategy. While the sections above show seasonal averages, it's also insightful to look at the extremes:
- During the high season, the absolute peak month showcases Dublin's highest earning potential, with monthly revenues capable of climbing to $9,220, occupancy reaching a high of 57.6%, and ADRs peaking at $485.
- Conversely, the slowest single month of the year, typically falling within the low season, marks the market's lowest point. In this month, revenue might dip to $2,939, occupancy could drop to 34.5%, and ADRs may adjust down to $397.
- Understanding both the seasonal averages and these monthly peaks and troughs in revenue, occupancy, and ADR is crucial for maximizing your Airbnb profit potential in Dublin.
Seasonal Strategies for Maximizing Profit
- Peak Season: Maximize revenue through premium pricing and potentially longer minimum stays. Ensure high availability.
- Low Season: Offer competitive pricing, special promotions (e.g., extended stay discounts), and flexible cancellation policies. Target off-season travelers like remote workers or budget-conscious guests.
- Shoulder Seasons: Implement dynamic pricing that balances peak and low rates. Target weekend travelers or specific events. Offer slightly more flexible terms than peak season.
- Regularly analyze your own performance against these Dublin seasonality benchmarks and adjust your pricing and availability strategy accordingly.
Best Areas for Airbnb Investment in Dublin (2025)
Exploring the top neighborhoods for short-term rentals in Dublin? This section highlights key areas, outlining why they are attractive for hosts and guests, along with notable local attractions. Consider these locations based on your target guest profile and investment strategy.
| Neighborhood / Area | Why Host Here? (Target Guests & Appeal) | Key Attractions & Landmarks |
|---|---|---|
| Downtown Dublin | The heart of Dublin, featuring a vibrant atmosphere with shops, restaurants, and cultural spots. It attracts visitors looking for convenience and local charm, making it ideal for short-term rentals. | Dublin Park, Indian Run Falls Park, Dublin Village Tavern, Celebration Park, The Dublin Link Bridge |
| Bridge Park | A modern mixed-use development along the Scioto River with dining, shopping, and entertainment. It attracts younger travelers and families seeking a lively experience with easy access to various amenities. | Bridge Park, Dublin Entrepreneurial Center, The Big Local Arts Festival, Restaurants and bars, Scioto River views |
| Sawmill Road | A busy commercial corridor in Dublin, close to shopping centers and easy access to major highways. Perfect for business travelers who want convenience and proximity to corporate offices. | Tuttle Crossing Mall, Shopping plazas, Restaurants, Parks nearby, Easy access to I-270 |
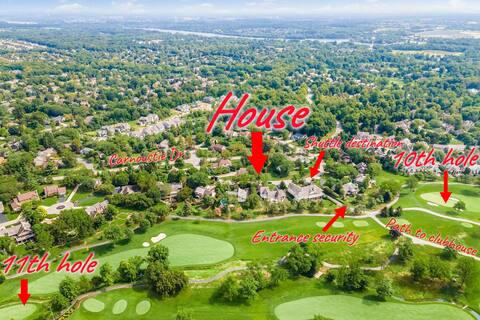
| Muirfield Village | A prestigious golf community known for the Muirfield Village Golf Club. Attracts golf enthusiasts and visitors during events, making it a unique rental opportunity. | Muirfield Village Golf Club, Parks and nature trails, Golf events, Luxury homes, Community amenities |
| Old Dublin | A historic area filled with quaint buildings and a charming small-town feel. Attracts tourists looking for a unique cultural experience and local flair. | Old Town Hall, The Dublin Arts Council, Historic buildings, Local shops, Seasonal festivals |
| Emerald Parkway | A suburban area with business centers and residential neighborhoods. It appeals to families and professionals looking for spacious accommodations near corporate offices. | Dublin Community Recreation Center, Sports facilities, Schools and parks, Corporate offices, Family-friendly amenities |
| Perimeter Loop | A suburban area that offers a mix of residential options and is close to outdoor activities. It caters to families and outdoor enthusiasts looking for a tranquil stay. | Parks, Walking trails, Community events, Nearby golf courses, Low-traffic neighborhoods |
| Scioto Park | An area known for its scenic parks and outdoor spaces. Popular with families and nature lovers seeking a peaceful retreat close to Dublin's recreational offerings. | Scioto Park, Walking trails, Playgrounds, Picnic areas, Nature watching |
Understanding Airbnb License Requirements & STR Laws in Dublin (2025)
While Dublin, Ohio, United States currently shows low STR regulations, specific Airbnb license requirements might still exist or change. Always verify the latest short term rental regulations and Airbnb license requirements directly with local government authorities for Dublin to ensure full compliance before hosting.
(Source: AirROI data, 2025, finding no licensed listings among those analyzed)
Top Performing Airbnb Properties in Dublin (2025)
Benchmark your potential! Explore examples of top-performing Airbnb properties in Dublinbased on Trailing Twelve Month (TTM) revenue. Analyze their characteristics, revenue, occupancy rate, and ADR to understand what drives success in this market.
Tournament at your front door 3 min to zoo
Entire Place • 4 bedrooms

Bridge Park ~ Dublin 1BR/1BA Wonderfully Decorated
Entire Place • 1 bedroom

The Riverhouse-Riverfront
Entire Place • 4 bedrooms

The River House
Entire Place • 3 bedrooms

Beautiful Dublin Ohio Home
Entire Place • 3 bedrooms

Muirfield Village home, golf course lot
Entire Place • 4 bedrooms
Note: Performance varies based on location, size, amenities, seasonality, and management quality. Data reflects the past 12 months.
Top Performing Airbnb Hosts in Dublin (2025)
Learn from the best! This table showcases top-performing Airbnb hosts in Dublin based on the number of properties managed and estimated total revenue over the past year. Analyze their scale and performance metrics.
| Host Name | Properties | Grossing Revenue | Stay Reviews | Avg Rating |
|---|---|---|---|---|
| Ning | 1 | $134,006 | 1 | Not Rated |
| Jeff And Gina | 1 | $109,571 | 4 | 5.00/5.0 |
| Nicole | 1 | $105,549 | 55 | 4.91/5.0 |
| Jen | 1 | $89,231 | 53 | 4.91/5.0 |
| Erich | 2 | $69,249 | 17 | 5.00/5.0 |
| Mark | 1 | $51,568 | 3 | 5.00/5.0 |
| Kristen | 1 | $45,185 | 5 | 5.00/5.0 |
| Matthew | 2 | $32,287 | 36 | 4.46/5.0 |
| Chris | 2 | $16,916 | 10 | 4.83/5.0 |
| Emily | 1 | $16,456 | 9 | 4.89/5.0 |
Analyzing the strategies of top hosts, such as their property selection, pricing, and guest communication, can offer valuable lessons for optimizing your own Airbnb operations in Dublin.
Dive Deeper: Advanced Dublin STR Market Data (2025)
Ready to unlock more insights? AirROI provides access to advanced metrics and comprehensive Airbnb data for Dublin. Explore detailed analytics beyond this report to refine your investment strategy, optimize pricing, and maximize your vacation rental profits.
Explore Advanced MetricsDublin Short-Term Rental Market Composition (2025): Property & Room Types
Room Type Distribution
Property Type Distribution
Market Composition Insights for Dublin
- The Dublin Airbnb market composition is heavily skewed towards Entire Home/Apt listings, which make up 90% of the 20 active rentals. This indicates strong guest preference for privacy and space.
- Looking at the property type distribution in Dublin, House properties are the most common (55%), reflecting the local real estate landscape.
- Houses represent a significant 55% portion, catering likely to families or larger groups.
Dublin Airbnb Room Capacity Analysis (2025): Bedroom Distribution
Distribution of Listings by Number of Bedrooms
Room Capacity Insights for Dublin
- The dominant room capacity in Dublin is 1 bedroom listings, making up 35% of the market. This suggests a strong demand for properties suitable for couples or solo travelers.
- Together, 1 bedroom and 3 bedrooms properties represent 70.0% of the active Airbnb listings in Dublin, indicating a high concentration in these sizes.
- A significant 55.0% of listings offer 3+ bedrooms, catering to larger groups and families seeking more space in Dublin.
Dublin Vacation Rental Guest Capacity Trends (2025)
Distribution of Listings by Guest Capacity
Guest Capacity Insights for Dublin
- The most common guest capacity trend in Dublin vacation rentals is listings accommodating 6 guests (30%). This suggests the primary traveler segment is likely larger groups.
- Properties designed for 6 guests and 2 guests dominate the Dublin STR market, accounting for 55.0% of listings.
- 50.0% of properties accommodate 6+ guests, serving the market segment for larger families or group travel in Dublin.
- On average, properties in Dublin are equipped to host 4.5 guests.
Dublin Airbnb Booking Patterns (2025): Available vs. Booked Days
Available Days Distribution
Booked Days Distribution
Booking Pattern Insights for Dublin
- The most common availability pattern in Dublin falls within the 271-366 days range, representing 65% of listings. This suggests many properties have significant open periods on their calendars.
- Approximately 85.0% of listings show high availability (181+ days open annually), indicating potential for increased bookings or specific owner usage patterns.
- For booked days, the 1-30 days range is most frequent in Dublin (35%), reflecting common guest stay durations or potential owner blocking patterns.
- A notable 15.0% of properties secure long booking periods (181+ days booked per year), highlighting successful long-term rental strategies or significant owner usage.
Dublin Airbnb Minimum Stay Requirements Analysis
Distribution of Listings by Minimum Night Requirement
1 Night
1 listings
5% of total
2 Nights
3 listings
15% of total
3 Nights
2 listings
10% of total
4-6 Nights
1 listings
5% of total
7-29 Nights
6 listings
30% of total
30+ Nights
7 listings
35% of total
Key Insights
- The most prevalent minimum stay requirement in Dublin is 30+ Nights, adopted by 35% of listings. This highlights the market's preference for longer commitments.
- A significant segment (35%) caters to monthly stays (30+ nights) in Dublin, pointing to opportunities in the extended-stay market.
Recommendations
- Align with the market by considering a 30+ Nights minimum stay, as 35% of Dublin hosts use this setting.
- If feasible, allowing 1-night stays, especially midweek or during low season, could capture last-minute bookings, as only 5% currently do.
- Explore offering discounts for stays of 30+ nights to attract the 35% of the market seeking extended stays.
- Adjust minimum nights based on seasonality – potentially shorter during low season and longer during peak demand periods in Dublin.
Dublin Airbnb Cancellation Policy Trends Analysis (2025)
Flexible
3 listings
15% of total
Moderate
4 listings
20% of total
Firm
9 listings
45% of total
Strict
4 listings
20% of total
Cancellation Policy Insights for Dublin
- The prevailing Airbnb cancellation policy trend in Dublin is Firm, used by 45% of listings.
- A majority (65.0%) of hosts in Dublin utilize Firm or Strict policies, indicating a market where hosts prioritize booking security.
Recommendations for Hosts
- Consider adopting a Firm policy to align with the 45% market standard in Dublin.
- Regularly review your cancellation policy against competitors and market demand shifts in Dublin.
Dublin STR Booking Lead Time Analysis (2025)
Average Booking Lead Time by Month
Booking Lead Time Insights for Dublin
- The overall average booking lead time for vacation rentals in Dublin is 36 days.
- Guests book furthest in advance for stays during August (average 68 days), likely coinciding with peak travel demand or local events.
- The shortest booking windows occur for stays in January (average 7 days), indicating more last-minute travel plans during this time.
- Seasonally, Summer (53 days avg.) sees the longest lead times, while Winter (23 days avg.) has the shortest, reflecting typical travel planning cycles.
Recommendations for Hosts
- Use the overall average lead time (36 days) as a baseline for your pricing and availability strategy in Dublin.
- For August stays, consider implementing length-of-stay discounts or slightly higher rates for bookings made less than 68 days out to capitalize on advance planning.
- During January, focus on last-minute booking availability and promotions, as guests book with very short notice (7 days avg.).
- Target marketing efforts for the Summer season well in advance (at least 53 days) to capture early planners.
- Monitor your own booking lead times against these Dublin averages to identify opportunities for dynamic pricing adjustments.
Popular & Essential Airbnb Amenities in Dublin (2025)
Amenity Prevalence
Amenity Insights for Dublin
- Essential amenities in Dublin that guests expect include: Washer, TV, Wifi, Air conditioning, Smoke alarm, Kitchen, Free parking on premises. Lacking these (any) could significantly impact bookings.
- Popular amenities like Dryer, Fire extinguisher, Dishes and silverware are common but not universal. Offering these can provide a competitive edge.
Recommendations for Hosts
- Ensure your listing includes all essential amenities for Dublin: Washer, TV, Wifi, Air conditioning, Smoke alarm, Kitchen, Free parking on premises.
- Prioritize adding missing essentials: Free parking on premises.
- Consider adding popular differentiators like Dryer or Fire extinguisher to increase appeal.
- Highlight unique or less common amenities you offer (e.g., hot tub, dedicated workspace, EV charger) in your listing description and photos.
- Regularly check competitor amenities in Dublin to stay competitive.
Dublin Airbnb Guest Demographics & Profile Analysis (2025)
Guest Profile Summary for Dublin
- The typical guest profile for Airbnb in Dublin consists of primarily domestic travelers (91%), often arriving from nearby Crescent Springs, typically belonging to the Post-2000s (Gen Z/Alpha) group (50%), primarily speaking English or Spanish.
- Domestic travelers account for 90.8% of guests.
- Key international markets include United States (90.8%) and United Kingdom (2.6%).
- Top languages spoken are English (77.4%) followed by Spanish (12.9%).
- A significant demographic segment is the Post-2000s (Gen Z/Alpha) group, representing 50% of guests.
Recommendations for Hosts
- Target domestic marketing efforts towards travelers from Crescent Springs and Columbus.
- Tailor amenities and listing descriptions to appeal to the dominant Post-2000s (Gen Z/Alpha) demographic (e.g., highlight fast WiFi, smart home features, local guides).
- Highlight unique local experiences or amenities relevant to the primary guest profile.
- Consider seasonal promotions aligned with peak travel times for key origin markets.
Nearby Short-Term Rental Market Comparison
How does the Dublin Airbnb market stack up against its neighbors? Compare key performance metrics like average monthly revenue, ADR, and occupancy rates in surrounding areas to understand the broader regional STR landscape.
| Market | Active Properties | Monthly Revenue | Daily Rate | Avg. Occupancy |
|---|---|---|---|---|
| Sugar Grove | 16 | $6,170 | $497.05 | 43% |
| Hocking County | 10 | $5,949 | $503.81 | 53% |
| Creola | 18 | $5,845 | $414.15 | 54% |
| Rockbridge | 222 | $5,508 | $418.08 | 47% |
| Berne Township | 15 | $5,342 | $507.57 | 36% |
| Huron Township | 17 | $5,212 | $494.15 | 39% |
| Logan | 670 | $5,135 | $396.43 | 45% |
| Swan Township | 111 | $5,008 | $349.61 | 49% |
| Berlin Township | 11 | $4,922 | $395.62 | 43% |
| South Bloomingville | 125 | $4,852 | $324.81 | 49% |