Dover Airbnb Market Analysis 2026: Short Term Rental Data & Vacation Rental Statistics in Ohio, United States
Is Airbnb profitable in Dover in 2026? Explore comprehensive Airbnb analytics for Dover, Ohio, United States to uncover income potential. This 2026 STR market report for Dover, based on AirROI data from February 2025 to January 2026, reveals key trends in the niche market of 21 active listings.
Whether you're considering an Airbnb investment in Dover, optimizing your existing vacation rental, or exploring rental arbitrage opportunities, understanding the Dover Airbnb data is crucial. Leveraging the low regulation environment is key to maximizing your short term rental income potential. Let's dive into the specifics.
Key Dover Airbnb Performance Metrics Overview
Monthly Airbnb Revenue Variations & Income Potential in Dover (2026)
Understanding the monthly revenue variations for Airbnb listings in Dover is key to maximizing your short term rental income potential. Seasonality significantly impacts earnings. Our analysis, based on data from the past 12 months, shows that the peak revenue month for STRs in Dover is typically July, while February often presents the lowest earnings, highlighting opportunities for strategic pricing adjustments during shoulder and low seasons. Explore the typical Airbnb income in Dover across different performance tiers:
- Best-in-class properties (Top 10%) achieve $6,356+ monthly, often utilizing dynamic pricing and superior guest experiences.
- Strong performing properties (Top 25%) earn $4,124 or more, indicating effective management and desirable locations/amenities.
- Typical properties (Median) generate around $2,527 per month, representing the average market performance.
- Entry-level properties (Bottom 25%) see earnings around $1,537, often with potential for optimization.
Average Monthly Airbnb Earnings Trend in Dover
Dover Airbnb Occupancy Rate Trends (2026)
Maximize your bookings by understanding the Dover STR occupancy trends. Seasonal demand shifts significantly influence how often properties are booked. Typically, Augustsees the highest demand (peak season occupancy), while April experiences the lowest (low season). Effective strategies, like adjusting minimum stays or offering promotions, can boost occupancy during slower periods. Here's how different property tiers perform in Dover:
- Best-in-class properties (Top 10%) achieve 78%+ occupancy, indicating high desirability and potentially optimized availability.
- Strong performing properties (Top 25%) maintain 60% or higher occupancy, suggesting good market fit and guest satisfaction.
- Typical properties (Median) have an occupancy rate around 43%.
- Entry-level properties (Bottom 25%) average 27% occupancy, potentially facing higher vacancy.
Average Monthly Occupancy Rate Trend in Dover
Average Daily Rate (ADR) Airbnb Trends in Dover (2026)
Effective short term rental pricing strategy in Dover involves understanding monthly ADR fluctuations. The Average Daily Rate (ADR) for Airbnb in Dover typically peaks in June and dips lowest during February. Leveraging Airbnb dynamic pricing tools or strategies based on this seasonality can significantly boost revenue. Here's a look at the typical nightly rates achieved:
- Best-in-class properties (Top 10%) command rates of $486+ per night, often due to premium features or locations.
- Strong performing properties (Top 25%) achieve nightly rates of $285 or more.
- Typical properties (Median) charge around $182 per night.
- Entry-level properties (Bottom 25%) earn around $118 per night.
Average Daily Rate (ADR) Trend by Month in Dover
Get Live Dover Market Intelligence 👇

Explore Real-time Analytics
Airbnb Seasonality Analysis & Trends in Dover (2026)
Peak Season (July, August, October)
- Revenue averages $4,817 per month
- Occupancy rates average 60.2%
- Daily rates average $247
Shoulder Season
- Revenue averages $3,044 per month
- Occupancy maintains around 42.4%
- Daily rates hold near $241
Low Season (January, February, March)
- Revenue drops to average $2,161 per month
- Occupancy decreases to average 38.8%
- Daily rates adjust to average $226
Seasonality Insights for Dover
- The Airbnb seasonality in Dover shows highly seasonal trends requiring careful strategy. While the sections above show seasonal averages, it's also insightful to look at the extremes:
- During the high season, the absolute peak month showcases Dover's highest earning potential, with monthly revenues capable of climbing to $5,460, occupancy reaching a high of 61.5%, and ADRs peaking at $254.
- Conversely, the slowest single month of the year, typically falling within the low season, marks the market's lowest point. In this month, revenue might dip to $2,047, occupancy could drop to 35.4%, and ADRs may adjust down to $225.
- Understanding both the seasonal averages and these monthly peaks and troughs in revenue, occupancy, and ADR is crucial for maximizing your Airbnb profit potential in Dover.
Seasonal Strategies for Maximizing Profit
- Peak Season: Maximize revenue through premium pricing and potentially longer minimum stays. Ensure high availability.
- Low Season: Offer competitive pricing, special promotions (e.g., extended stay discounts), and flexible cancellation policies. Target off-season travelers like remote workers or budget-conscious guests.
- Shoulder Seasons: Implement dynamic pricing that balances peak and low rates. Target weekend travelers or specific events. Offer slightly more flexible terms than peak season.
- Regularly analyze your own performance against these Dover seasonality benchmarks and adjust your pricing and availability strategy accordingly.
Best Areas for Airbnb Investment in Dover (2026)
Exploring the top neighborhoods for short-term rentals in Dover? This section highlights key areas, outlining why they are attractive for hosts and guests, along with notable local attractions. Consider these locations based on your target guest profile and investment strategy.
| Neighborhood / Area | Why Host Here? (Target Guests & Appeal) | Key Attractions & Landmarks |
|---|---|---|
| Dover Historic District | Charming area with historic homes and architecture, ideal for tourists interested in history and culture. Close to local dining and shopping. | Dover Public Library, The Dover Library, Historical Society of Tuscarawas County, Tuscora Park, Dover City Park |
| Tuscora Park | A family-friendly park with recreational activities and events, making it attractive for families visiting the area. | Tuscora Park Carousel, Tuscora Park Pool, Playground Equipment, Picnic Areas, Walking Trails |
| Local Restaurants | Dover is home to a variety of popular local eateries, making it a great spot for food enthusiasts looking to experience local cuisine. | Buehler's Fresh Foods, Moe's Restaurant, The Morning Bowl, China Star, Pizza Oven |
| Nearby Amish Country | Attracts visitors interested in Amish culture and crafts, providing a unique rural experience. | Amish Heritage Center, Yoder's Amish Home, Heini's Cheese Chalet, Guggisberg Cheese Factory, Holmes County Trail |
| New Philadelphia | A neighboring city with additional amenities, shopping, and attractions, making it a good option for Airbnb hosts. | New Philadelphia City Park, Heritage Park, Tuscawaras Valley Historical Society, Pioneer Village, Walnut Creek Flea Market |
| Tuscarawas County Fairgrounds | Hosts annual fairs and events, drawing visitors who need short-term accommodations. | Annual Tuscarawas County Fair, Flea Market Events, Concerts and Community Events |
| Proximity to Attractions | Dover is strategically located near major attractions in Eastern Ohio, attracting visitors looking for a home base to explore. | Cuyahoga Valley National Park, The Pro Football Hall of Fame, Cleveland, Holmes County, Zoar Village |
| Outdoor Recreation Areas | Ideal for nature lovers, with parks and outdoor venues that appeal to those wanting a getaway in nature, boosting Airbnb interest. | Dover Dam, Walnut Creek, Ohio & Erie Canal Towpath, Hiking Trails, Fishing Spots |
Understanding Airbnb License Requirements & STR Laws in Dover (2026)
While Dover, Ohio, United States currently shows low STR regulations, specific Airbnb license requirements might still exist or change. Always verify the latest short term rental regulations and Airbnb license requirements directly with local government authorities for Dover to ensure full compliance before hosting.
(Source: AirROI data, 2026, finding no licensed listings among those analyzed)
Top Performing Airbnb Properties in Dover (2026)
Benchmark your potential! Explore examples of top-performing Airbnb properties in Doverbased on Trailing Twelve Month (TTM) revenue. Analyze their characteristics, revenue, occupancy rate, and ADR to understand what drives success in this market.
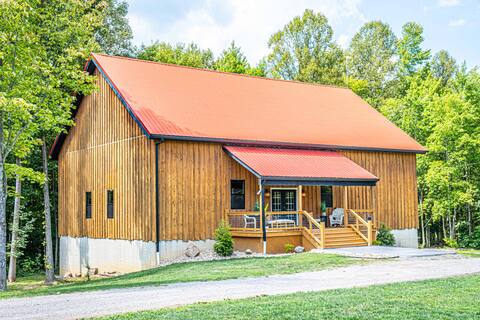
Timber Frame Barndominium - The Hemlock Place
Entire Place • 5 bedrooms

The Trio- Unique Country Setting
Entire Place • 7 bedrooms
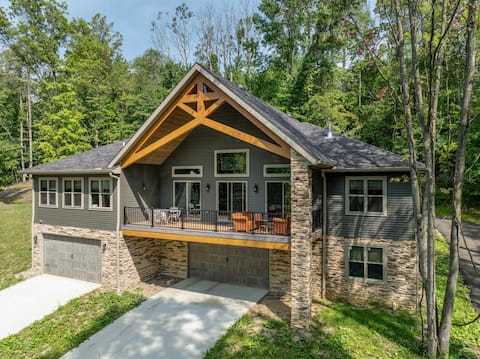
Lodge at Hilton's Hideaway | Private Hot Tub
Entire Place • 4 bedrooms

The Chalet with Hot Tub
Entire Place • 3 bedrooms

Fire Pit Private Hot Tub 4 Bed
Entire Place • 3 bedrooms
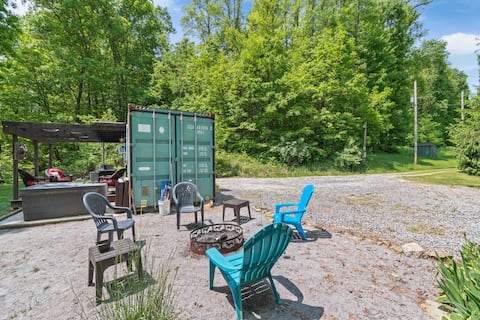
Riverside Hideout Shipping Container with Hot tub!
Entire Place • 1 bedroom
Note: Performance varies based on location, size, amenities, seasonality, and management quality. Data reflects the past 12 months.
Top Performing Airbnb Hosts in Dover (2026)
Learn from the best! This table showcases top-performing Airbnb hosts in Dover based on the number of properties managed and estimated total revenue over the past year. Analyze their scale and performance metrics.
| Host Name | Properties | Grossing Revenue | Stay Reviews | Avg Rating |
|---|---|---|---|---|
| Franklin | 2 | $126,527 | 135 | 4.99/5.0 |
| Brian | 4 | $79,708 | 528 | 4.89/5.0 |
| Kari | 1 | $77,192 | 25 | 4.88/5.0 |
| Amish Country Lodges | 1 | $64,944 | 29 | 5.00/5.0 |
| Lindsay | 1 | $57,332 | 136 | 4.91/5.0 |
| Carol | 2 | $43,192 | 48 | 4.83/5.0 |
| Ryann | 1 | $40,290 | 905 | 4.95/5.0 |
| Kathy | 1 | $33,238 | 10 | 5.00/5.0 |
| Adam | 1 | $31,863 | 27 | 4.93/5.0 |
| Kylie | 1 | $23,859 | 17 | 5.00/5.0 |
Analyzing the strategies of top hosts, such as their property selection, pricing, and guest communication, can offer valuable lessons for optimizing your own Airbnb operations in Dover.
Dive Deeper: Advanced Dover STR Market Data (2026)
Ready to unlock more insights? AirROI provides access to advanced metrics and comprehensive Airbnb data for Dover. Explore detailed analytics beyond this report to refine your investment strategy, optimize pricing, and maximize your vacation rental profits.
Explore Advanced MetricsDover Short-Term Rental Market Composition (2026): Property & Room Types
Room Type Distribution
Property Type Distribution
Market Composition Insights for Dover
- The Dover Airbnb market composition is heavily skewed towards Entire Home/Apt listings, which make up 100% of the 21 active rentals. This indicates strong guest preference for privacy and space.
- Looking at the property type distribution in Dover, House properties are the most common (52.4%), reflecting the local real estate landscape.
- Houses represent a significant 52.4% portion, catering likely to families or larger groups.
Dover Airbnb Room Capacity Analysis (2026): Bedroom Distribution
Distribution of Listings by Number of Bedrooms
Room Capacity Insights for Dover
- The dominant room capacity in Dover is 3 bedrooms listings, making up 28.6% of the market. This suggests a strong demand for properties suitable for families or small groups.
- Together, 3 bedrooms and 1 bedroom properties represent 52.4% of the active Airbnb listings in Dover, indicating a high concentration in these sizes.
- A significant 52.4% of listings offer 3+ bedrooms, catering to larger groups and families seeking more space in Dover.
Dover Vacation Rental Guest Capacity Trends (2026)
Distribution of Listings by Guest Capacity
Guest Capacity Insights for Dover
- The most common guest capacity trend in Dover vacation rentals is listings accommodating 8+ guests (42.9%). This suggests the primary traveler segment is likely larger groups.
- Properties designed for 8+ guests and 4 guests dominate the Dover STR market, accounting for 71.5% of listings.
- 62.0% of properties accommodate 6+ guests, serving the market segment for larger families or group travel in Dover.
- On average, properties in Dover are equipped to host 6.0 guests.
Dover Airbnb Booking Patterns (2026): Available vs. Booked Days
Available Days Distribution
Booked Days Distribution
Booking Pattern Insights for Dover
- The most common availability pattern in Dover falls within the 181-270 days range, representing 52.4% of listings. This suggests many properties have significant open periods on their calendars.
- Approximately 76.2% of listings show high availability (181+ days open annually), indicating potential for increased bookings or specific owner usage patterns.
- For booked days, the 91-180 days range is most frequent in Dover (57.1%), reflecting common guest stay durations or potential owner blocking patterns.
- A notable 23.8% of properties secure long booking periods (181+ days booked per year), highlighting successful long-term rental strategies or significant owner usage.
Dover Airbnb Minimum Stay Requirements Analysis
Distribution of Listings by Minimum Night Requirement
1 Night
11 listings
52.4% of total
2 Nights
4 listings
19% of total
7-29 Nights
1 listings
4.8% of total
30+ Nights
5 listings
23.8% of total
Key Insights
- The most prevalent minimum stay requirement in Dover is 1 Night, adopted by 52.4% of listings. This highlights the market's preference for shorter, flexible bookings.
- A strong majority (71.4%) of the Dover Airbnb data shows acceptance of very short stays (1-2 nights), indicating a dynamic, high-turnover market.
- A significant segment (23.8%) caters to monthly stays (30+ nights) in Dover, pointing to opportunities in the extended-stay market.
Recommendations
- Align with the market by considering a 1 Night minimum stay, as 52.4% of Dover hosts use this setting.
- Explore offering discounts for stays of 30+ nights to attract the 23.8% of the market seeking extended stays.
- Adjust minimum nights based on seasonality – potentially shorter during low season and longer during peak demand periods in Dover.
Dover Airbnb Cancellation Policy Trends Analysis (2026)
Limited
2 listings
9.5% of total
Flexible
8 listings
38.1% of total
Moderate
5 listings
23.8% of total
Firm
4 listings
19% of total
Strict
2 listings
9.5% of total
Cancellation Policy Insights for Dover
- The prevailing Airbnb cancellation policy trend in Dover is Flexible, used by 38.1% of listings.
- There's a relatively balanced mix between guest-friendly (61.9%) and stricter (28.5%) policies, offering choices for different guest needs.
- Strict cancellation policies are quite rare (9.5%), potentially making listings with this policy less competitive unless justified by high demand or property type.
Recommendations for Hosts
- Consider adopting a Flexible policy to align with the 38.1% market standard in Dover.
- Using a Strict policy might deter some guests, as only 9.5% of listings use it. Evaluate if potential revenue protection outweighs possible lower booking rates.
- Regularly review your cancellation policy against competitors and market demand shifts in Dover.
Dover STR Booking Lead Time Analysis (2026)
Average Booking Lead Time by Month
Booking Lead Time Insights for Dover
- The overall average booking lead time for vacation rentals in Dover is 52 days.
- Guests book furthest in advance for stays during October (average 77 days), likely coinciding with peak travel demand or local events.
- The shortest booking windows occur for stays in January (average 20 days), indicating more last-minute travel plans during this time.
- Seasonally, Fall (69 days avg.) sees the longest lead times, while Winter (28 days avg.) has the shortest, reflecting typical travel planning cycles.
Recommendations for Hosts
- Use the overall average lead time (52 days) as a baseline for your pricing and availability strategy in Dover.
- For October stays, consider implementing length-of-stay discounts or slightly higher rates for bookings made less than 77 days out to capitalize on advance planning.
- Target marketing efforts for the Fall season well in advance (at least 69 days) to capture early planners.
- Monitor your own booking lead times against these Dover averages to identify opportunities for dynamic pricing adjustments.
Popular & Essential Airbnb Amenities in Dover (2026)
Amenity Prevalence
No amenities with partial availability (less than 100%) were found to display in the chart. All essential amenities might be present in all listings. Check insights below.
Amenity Insights for Dover
- Essential amenities in Dover that guests expect include: Heating, Hot water, Wifi, Free parking on premises, Smoke alarm, Air conditioning, Bed linens, Coffee maker, Microwave, Kitchen. Lacking these (any) could significantly impact bookings.
Recommendations for Hosts
- Ensure your listing includes all essential amenities for Dover: Heating, Hot water, Wifi, Free parking on premises, Smoke alarm, Air conditioning, Bed linens, Coffee maker, Microwave, Kitchen.
- Highlight unique or less common amenities you offer (e.g., hot tub, dedicated workspace, EV charger) in your listing description and photos.
- Regularly check competitor amenities in Dover to stay competitive.
Dover Airbnb Guest Demographics & Profile Analysis (2026)
Guest Profile Summary for Dover
- The typical guest profile for Airbnb in Dover consists of primarily domestic travelers (100%), often arriving from nearby Cleveland, typically belonging to the Post-2000s (Gen Z/Alpha) group (50%), primarily speaking English or Spanish.
- Domestic travelers account for 99.5% of guests.
- Key international markets include United States (99.5%) and DC (0.5%).
- Top languages spoken are English (74.7%) followed by Spanish (13.2%).
- A significant demographic segment is the Post-2000s (Gen Z/Alpha) group, representing 50% of guests.
Recommendations for Hosts
- Target domestic marketing efforts towards travelers from Cleveland and Columbus.
- Tailor amenities and listing descriptions to appeal to the dominant Post-2000s (Gen Z/Alpha) demographic (e.g., highlight fast WiFi, smart home features, local guides).
- Highlight unique local experiences or amenities relevant to the primary guest profile.
- Consider seasonal promotions aligned with peak travel times for key origin markets.
Nearby Short-Term Rental Market Comparison
How does the Dover Airbnb market stack up against its neighbors? Compare key performance metrics like average monthly revenue, ADR, and occupancy rates in surrounding areas to understand the broader regional STR landscape.
| Market | Active Properties | Monthly Revenue | Daily Rate | Avg. Occupancy |
|---|---|---|---|---|
| Sugar Grove | 16 | $6,172 | $489.99 | 43% |
| Creola | 18 | $5,899 | $403.00 | 53% |
| Hocking County | 11 | $5,712 | $508.21 | 49% |
| Rockbridge | 229 | $5,257 | $400.48 | 46% |
| Huron Township | 17 | $5,053 | $484.21 | 40% |
| Berlin Township | 11 | $5,023 | $386.97 | 46% |
| Logan | 688 | $4,907 | $388.67 | 45% |
| Berne Township | 15 | $4,897 | $490.66 | 37% |
| Swan Township | 111 | $4,727 | $334.40 | 49% |
| South Bloomingville | 129 | $4,565 | $312.34 | 48% |