Deerfield Township Airbnb Market Analysis 2026: Short Term Rental Data & Vacation Rental Statistics in Ohio, United States
Is Airbnb profitable in Deerfield Township in 2026? Explore comprehensive Airbnb analytics for Deerfield Township, Ohio, United States to uncover income potential. This 2026 STR market report for Deerfield Township, based on AirROI data from February 2025 to January 2026, reveals key trends in the niche market of 33 active listings.
Whether you're considering an Airbnb investment in Deerfield Township, optimizing your existing vacation rental, or exploring rental arbitrage opportunities, understanding the Deerfield Township Airbnb data is crucial. Leveraging the low regulation environment is key to maximizing your short term rental income potential. Let's dive into the specifics.
Key Deerfield Township Airbnb Performance Metrics Overview
Monthly Airbnb Revenue Variations & Income Potential in Deerfield Township (2026)
Understanding the monthly revenue variations for Airbnb listings in Deerfield Township is key to maximizing your short term rental income potential. Seasonality significantly impacts earnings. Our analysis, based on data from the past 12 months, shows that the peak revenue month for STRs in Deerfield Township is typically July, while February often presents the lowest earnings, highlighting opportunities for strategic pricing adjustments during shoulder and low seasons. Explore the typical Airbnb income in Deerfield Township across different performance tiers:
- Best-in-class properties (Top 10%) achieve $8,512+ monthly, often utilizing dynamic pricing and superior guest experiences.
- Strong performing properties (Top 25%) earn $5,675 or more, indicating effective management and desirable locations/amenities.
- Typical properties (Median) generate around $3,382 per month, representing the average market performance.
- Entry-level properties (Bottom 25%) see earnings around $1,409, often with potential for optimization.
Average Monthly Airbnb Earnings Trend in Deerfield Township
Deerfield Township Airbnb Occupancy Rate Trends (2026)
Maximize your bookings by understanding the Deerfield Township STR occupancy trends. Seasonal demand shifts significantly influence how often properties are booked. Typically, Julysees the highest demand (peak season occupancy), while February experiences the lowest (low season). Effective strategies, like adjusting minimum stays or offering promotions, can boost occupancy during slower periods. Here's how different property tiers perform in Deerfield Township:
- Best-in-class properties (Top 10%) achieve 74%+ occupancy, indicating high desirability and potentially optimized availability.
- Strong performing properties (Top 25%) maintain 57% or higher occupancy, suggesting good market fit and guest satisfaction.
- Typical properties (Median) have an occupancy rate around 41%.
- Entry-level properties (Bottom 25%) average 22% occupancy, potentially facing higher vacancy.
Average Monthly Occupancy Rate Trend in Deerfield Township
Average Daily Rate (ADR) Airbnb Trends in Deerfield Township (2026)
Effective short term rental pricing strategy in Deerfield Township involves understanding monthly ADR fluctuations. The Average Daily Rate (ADR) for Airbnb in Deerfield Township typically peaks in August and dips lowest during February. Leveraging Airbnb dynamic pricing tools or strategies based on this seasonality can significantly boost revenue. Here's a look at the typical nightly rates achieved:
- Best-in-class properties (Top 10%) command rates of $453+ per night, often due to premium features or locations.
- Strong performing properties (Top 25%) achieve nightly rates of $356 or more.
- Typical properties (Median) charge around $249 per night.
- Entry-level properties (Bottom 25%) earn around $189 per night.
Average Daily Rate (ADR) Trend by Month in Deerfield Township
Get Live Deerfield Township Market Intelligence 👇

Explore Real-time Analytics
Airbnb Seasonality Analysis & Trends in Deerfield Township (2026)
Peak Season (July, August, June)
- Revenue averages $6,179 per month
- Occupancy rates average 55.9%
- Daily rates average $330
Shoulder Season
- Revenue averages $4,018 per month
- Occupancy maintains around 41.8%
- Daily rates hold near $282
Low Season (January, February, April)
- Revenue drops to average $2,561 per month
- Occupancy decreases to average 28.6%
- Daily rates adjust to average $254
Seasonality Insights for Deerfield Township
- The Airbnb seasonality in Deerfield Township shows highly seasonal trends requiring careful strategy. While the sections above show seasonal averages, it's also insightful to look at the extremes:
- During the high season, the absolute peak month showcases Deerfield Township's highest earning potential, with monthly revenues capable of climbing to $6,727, occupancy reaching a high of 60.1%, and ADRs peaking at $334.
- Conversely, the slowest single month of the year, typically falling within the low season, marks the market's lowest point. In this month, revenue might dip to $2,055, occupancy could drop to 26.2%, and ADRs may adjust down to $233.
- Understanding both the seasonal averages and these monthly peaks and troughs in revenue, occupancy, and ADR is crucial for maximizing your Airbnb profit potential in Deerfield Township.
Seasonal Strategies for Maximizing Profit
- Peak Season: Maximize revenue through premium pricing and potentially longer minimum stays. Ensure high availability.
- Low Season: Offer competitive pricing, special promotions (e.g., extended stay discounts), and flexible cancellation policies. Target off-season travelers like remote workers or budget-conscious guests.
- Shoulder Seasons: Implement dynamic pricing that balances peak and low rates. Target weekend travelers or specific events. Offer slightly more flexible terms than peak season.
- Regularly analyze your own performance against these Deerfield Township seasonality benchmarks and adjust your pricing and availability strategy accordingly.
Best Areas for Airbnb Investment in Deerfield Township (2026)
Exploring the top neighborhoods for short-term rentals in Deerfield Township? This section highlights key areas, outlining why they are attractive for hosts and guests, along with notable local attractions. Consider these locations based on your target guest profile and investment strategy.
| Neighborhood / Area | Why Host Here? (Target Guests & Appeal) | Key Attractions & Landmarks |
|---|---|---|
| Cedar Lake | A serene neighborhood with beautiful lakes and parks, perfect for families and those looking for outdoor activities. It's a peaceful oasis in the midst of urban life. | Cedar Lake Park, Deerfield Township Community Center, Bass Lake, Voice of America Park, Fiddler's Green Park |
| Beckett Ridge | A well-established residential area with a strong sense of community. Close to shopping, dining, and recreational facilities, making it attractive for both long-term and short-term rentals. | Beckett Park, Beckett Ridge Golf Course, Lindner Family Tennis Center, Cox Arboretum, Floor and Decor |
| Landings | A growing area with new developments, attracting families and young professionals, offering modern amenities and access to schools and shopping centers. | Landings Park, Sharon Woods, Deerfield Towne Center, Great Wolf Lodge, Dartmouth Park |
| Mason | Adjacent to Deerfield Township, Mason is known for its family-friendly atmosphere and attractions like Kings Island amusement park, appealing to tourists. | Kings Island, Cincinnati Premium Outlets, Mason Community Center, Gregory Park, Arboretum Park |
| Landen | A quaint suburb known for its small-town feel, with parks and family-friendly activities. Ideal for those seeking a quiet getaway close to larger city amenities. | Landen Deerfield Park, Landen Park, Eastside Park, Little Miami Scenic Trail, Loveland Historical Society Museum |
| Symmes Township | A suburban area with excellent schools and parks, appealing to families and business travelers looking for a quiet place to stay with local attractions. | Highfield Discovery Garden, Symmes Park, Duchess Park, Bosch Park, Warren County Historical Society |
| Olde West Chester | A historical area with unique local shops and eateries, providing guests with a charming experience and access to community events. | West Chester Antique Center, Keehner Park, Voice of America MetroPark, West Chester Farmer's Market, Olde West Chester Library |
| Mason-Fairfield Road | A commercial area bustling with activity, close to various dining options and shopping, making it ideal for business travelers and short stays. | Tri-County Mall, Fairfield Commons, Cincinnati Sports Club, The Village at Rivers Edge, Winton Woods |
Understanding Airbnb License Requirements & STR Laws in Deerfield Township (2026)
While Deerfield Township, Ohio, United States currently shows low STR regulations, specific Airbnb license requirements might still exist or change. Always verify the latest short term rental regulations and Airbnb license requirements directly with local government authorities for Deerfield Township to ensure full compliance before hosting.
(Source: AirROI data, 2026, finding no licensed listings among those analyzed)
Top Performing Airbnb Properties in Deerfield Township (2026)
Benchmark your potential! Explore examples of top-performing Airbnb properties in Deerfield Townshipbased on Trailing Twelve Month (TTM) revenue. Analyze their characteristics, revenue, occupancy rate, and ADR to understand what drives success in this market.
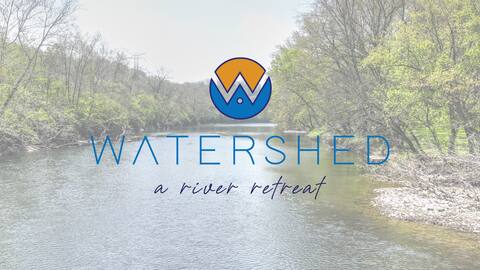
Watershed, A River Retreat
Entire Place • 6 bedrooms

Spacious, Modern 5B in Mason by I-71, Kings Island
Entire Place • 5 bedrooms

Large executive home in pool community Mason, Oh
Entire Place • 4 bedrooms

Serene, newly remodeled home in Mason, Ohio
Entire Place • 4 bedrooms

Spacious Home for 16 by Kings Island
Entire Place • 4 bedrooms

The Lookout, A River Retreat
Entire Place • 4 bedrooms
Note: Performance varies based on location, size, amenities, seasonality, and management quality. Data reflects the past 12 months.
Top Performing Airbnb Hosts in Deerfield Township (2026)
Learn from the best! This table showcases top-performing Airbnb hosts in Deerfield Township based on the number of properties managed and estimated total revenue over the past year. Analyze their scale and performance metrics.
| Host Name | Properties | Grossing Revenue | Stay Reviews | Avg Rating |
|---|---|---|---|---|
| StayList | 3 | $303,700 | 115 | 4.91/5.0 |
| Jason | 2 | $187,747 | 75 | 4.89/5.0 |
| Yiwei | 2 | $133,997 | 93 | 4.99/5.0 |
| Preferred Guest Services | 2 | $116,314 | 211 | 4.92/5.0 |
| Peter | 2 | $87,539 | 256 | 4.92/5.0 |
| Marcy | 1 | $79,467 | 85 | 4.96/5.0 |
| Grand Welcome Ohio Kentucky | 1 | $73,641 | 39 | 4.87/5.0 |
| Ashley | 1 | $58,326 | 53 | 4.92/5.0 |
| Luke | 2 | $55,900 | 51 | 5.00/5.0 |
| Crystal | 1 | $43,618 | 77 | 4.97/5.0 |
Analyzing the strategies of top hosts, such as their property selection, pricing, and guest communication, can offer valuable lessons for optimizing your own Airbnb operations in Deerfield Township.
Dive Deeper: Advanced Deerfield Township STR Market Data (2026)
Ready to unlock more insights? AirROI provides access to advanced metrics and comprehensive Airbnb data for Deerfield Township. Explore detailed analytics beyond this report to refine your investment strategy, optimize pricing, and maximize your vacation rental profits.
Explore Advanced MetricsDeerfield Township Short-Term Rental Market Composition (2026): Property & Room Types
Room Type Distribution
Property Type Distribution
Market Composition Insights for Deerfield Township
- The Deerfield Township Airbnb market composition is heavily skewed towards Entire Home/Apt listings, which make up 93.9% of the 33 active rentals. This indicates strong guest preference for privacy and space.
- Looking at the property type distribution in Deerfield Township, House properties are the most common (69.7%), reflecting the local real estate landscape.
- Houses represent a significant 69.7% portion, catering likely to families or larger groups.
- The presence of 6.1% Hotel/Boutique listings indicates integration with traditional hospitality.
Deerfield Township Airbnb Room Capacity Analysis (2026): Bedroom Distribution
Distribution of Listings by Number of Bedrooms
Room Capacity Insights for Deerfield Township
- The dominant room capacity in Deerfield Township is 4 bedrooms listings, making up 30.3% of the market. This suggests a strong demand for properties suitable for families or small groups.
- Together, 4 bedrooms and 3 bedrooms properties represent 51.5% of the active Airbnb listings in Deerfield Township, indicating a high concentration in these sizes.
- A significant 60.6% of listings offer 3+ bedrooms, catering to larger groups and families seeking more space in Deerfield Township.
Deerfield Township Vacation Rental Guest Capacity Trends (2026)
Distribution of Listings by Guest Capacity
Guest Capacity Insights for Deerfield Township
- The most common guest capacity trend in Deerfield Township vacation rentals is listings accommodating 8+ guests (57.6%). This suggests the primary traveler segment is likely larger groups.
- Properties designed for 8+ guests and 6 guests dominate the Deerfield Township STR market, accounting for 72.8% of listings.
- 75.8% of properties accommodate 6+ guests, serving the market segment for larger families or group travel in Deerfield Township.
- On average, properties in Deerfield Township are equipped to host 6.5 guests.
Deerfield Township Airbnb Booking Patterns (2026): Available vs. Booked Days
Available Days Distribution
Booked Days Distribution
Booking Pattern Insights for Deerfield Township
- The most common availability pattern in Deerfield Township falls within the 271-366 days range, representing 36.4% of listings. This suggests many properties have significant open periods on their calendars.
- Approximately 72.8% of listings show high availability (181+ days open annually), indicating potential for increased bookings or specific owner usage patterns.
- For booked days, the 91-180 days range is most frequent in Deerfield Township (36.4%), reflecting common guest stay durations or potential owner blocking patterns.
- A notable 27.3% of properties secure long booking periods (181+ days booked per year), highlighting successful long-term rental strategies or significant owner usage.
Deerfield Township Airbnb Minimum Stay Requirements Analysis
Distribution of Listings by Minimum Night Requirement
1 Night
11 listings
33.3% of total
2 Nights
11 listings
33.3% of total
3 Nights
1 listings
3% of total
4-6 Nights
1 listings
3% of total
7-29 Nights
3 listings
9.1% of total
30+ Nights
6 listings
18.2% of total
Key Insights
- The most prevalent minimum stay requirement in Deerfield Township is 1 Night, adopted by 33.3% of listings. This highlights the market's preference for shorter, flexible bookings.
- A strong majority (66.6%) of the Deerfield Township Airbnb data shows acceptance of very short stays (1-2 nights), indicating a dynamic, high-turnover market.
- A significant segment (18.2%) caters to monthly stays (30+ nights) in Deerfield Township, pointing to opportunities in the extended-stay market.
Recommendations
- Align with the market by considering a 1 Night minimum stay, as 33.3% of Deerfield Township hosts use this setting.
- Explore offering discounts for stays of 30+ nights to attract the 18.2% of the market seeking extended stays.
- Adjust minimum nights based on seasonality – potentially shorter during low season and longer during peak demand periods in Deerfield Township.
Deerfield Township Airbnb Cancellation Policy Trends Analysis (2026)
Limited
1 listings
3% of total
Super Strict 60 Days
2 listings
6.1% of total
Flexible
4 listings
12.1% of total
Moderate
2 listings
6.1% of total
Firm
24 listings
72.7% of total
Cancellation Policy Insights for Deerfield Township
- The prevailing Airbnb cancellation policy trend in Deerfield Township is Firm, used by 72.7% of listings.
- A majority (72.7%) of hosts in Deerfield Township utilize Firm or Strict policies, indicating a market where hosts prioritize booking security.
Recommendations for Hosts
- Consider adopting a Firm policy to align with the 72.7% market standard in Deerfield Township.
- Regularly review your cancellation policy against competitors and market demand shifts in Deerfield Township.
Deerfield Township STR Booking Lead Time Analysis (2026)
Average Booking Lead Time by Month
Booking Lead Time Insights for Deerfield Township
- The overall average booking lead time for vacation rentals in Deerfield Township is 41 days.
- Guests book furthest in advance for stays during August (average 69 days), likely coinciding with peak travel demand or local events.
- The shortest booking windows occur for stays in January (average 16 days), indicating more last-minute travel plans during this time.
- Seasonally, Summer (61 days avg.) sees the longest lead times, while Winter (26 days avg.) has the shortest, reflecting typical travel planning cycles.
Recommendations for Hosts
- Use the overall average lead time (41 days) as a baseline for your pricing and availability strategy in Deerfield Township.
- For August stays, consider implementing length-of-stay discounts or slightly higher rates for bookings made less than 69 days out to capitalize on advance planning.
- Target marketing efforts for the Summer season well in advance (at least 61 days) to capture early planners.
- Monitor your own booking lead times against these Deerfield Township averages to identify opportunities for dynamic pricing adjustments.
Popular & Essential Airbnb Amenities in Deerfield Township (2026)
Amenity Prevalence
Amenity Insights for Deerfield Township
- Essential amenities in Deerfield Township that guests expect include: Wifi, Air conditioning, Kitchen, Hot water, TV, Carbon monoxide alarm, Heating. Lacking these (any) could significantly impact bookings.
- Popular amenities like Dishes and silverware, Fire extinguisher, Free parking on premises are common but not universal. Offering these can provide a competitive edge.
Recommendations for Hosts
- Ensure your listing includes all essential amenities for Deerfield Township: Wifi, Air conditioning, Kitchen, Hot water, TV, Carbon monoxide alarm, Heating.
- Prioritize adding missing essentials: Hot water, TV, Carbon monoxide alarm, Heating.
- Consider adding popular differentiators like Dishes and silverware or Fire extinguisher to increase appeal.
- Highlight unique or less common amenities you offer (e.g., hot tub, dedicated workspace, EV charger) in your listing description and photos.
- Regularly check competitor amenities in Deerfield Township to stay competitive.
Deerfield Township Airbnb Guest Demographics & Profile Analysis (2026)
Guest Profile Summary for Deerfield Township
- The typical guest profile for Airbnb in Deerfield Township consists of primarily domestic travelers (94%), often arriving from nearby Cincinnati, typically belonging to the Post-2000s (Gen Z/Alpha) group (50%), primarily speaking English or Spanish.
- Domestic travelers account for 94.2% of guests.
- Key international markets include United States (94.2%) and Canada (1.7%).
- Top languages spoken are English (73.9%) followed by Spanish (12.2%).
- A significant demographic segment is the Post-2000s (Gen Z/Alpha) group, representing 50% of guests.
Recommendations for Hosts
- Target domestic marketing efforts towards travelers from Cincinnati and Columbus.
- Tailor amenities and listing descriptions to appeal to the dominant Post-2000s (Gen Z/Alpha) demographic (e.g., highlight fast WiFi, smart home features, local guides).
- Highlight unique local experiences or amenities relevant to the primary guest profile.
- Consider seasonal promotions aligned with peak travel times for key origin markets.
Nearby Short-Term Rental Market Comparison
How does the Deerfield Township Airbnb market stack up against its neighbors? Compare key performance metrics like average monthly revenue, ADR, and occupancy rates in surrounding areas to understand the broader regional STR landscape.
| Market | Active Properties | Monthly Revenue | Daily Rate | Avg. Occupancy |
|---|---|---|---|---|
| Sugar Grove | 16 | $6,172 | $489.99 | 43% |
| Creola | 18 | $5,899 | $403.00 | 53% |
| Hocking County | 11 | $5,712 | $508.21 | 49% |
| Rockbridge | 229 | $5,257 | $400.48 | 46% |
| Berlin Township | 11 | $5,023 | $386.97 | 46% |
| Logan | 688 | $4,907 | $388.67 | 45% |
| Berne Township | 15 | $4,897 | $490.66 | 37% |
| Swan Township | 111 | $4,727 | $334.40 | 49% |
| South Bloomingville | 129 | $4,565 | $312.34 | 48% |
| Laurelville | 145 | $4,519 | $348.68 | 45% |