Coshocton Airbnb Market Analysis 2026: Short Term Rental Data & Vacation Rental Statistics in Ohio, United States
Is Airbnb profitable in Coshocton in 2026? Explore comprehensive Airbnb analytics for Coshocton, Ohio, United States to uncover income potential. This 2026 STR market report for Coshocton, based on AirROI data from February 2025 to January 2026, reveals key trends in the niche market of 36 active listings.
Whether you're considering an Airbnb investment in Coshocton, optimizing your existing vacation rental, or exploring rental arbitrage opportunities, understanding the Coshocton Airbnb data is crucial. Leveraging the low regulation environment is key to maximizing your short term rental income potential. Let's dive into the specifics.
Key Coshocton Airbnb Performance Metrics Overview
Monthly Airbnb Revenue Variations & Income Potential in Coshocton (2026)
Understanding the monthly revenue variations for Airbnb listings in Coshocton is key to maximizing your short term rental income potential. Seasonality significantly impacts earnings. Our analysis, based on data from the past 12 months, shows that the peak revenue month for STRs in Coshocton is typically November, while February often presents the lowest earnings, highlighting opportunities for strategic pricing adjustments during shoulder and low seasons. Explore the typical Airbnb income in Coshocton across different performance tiers:
- Best-in-class properties (Top 10%) achieve $3,330+ monthly, often utilizing dynamic pricing and superior guest experiences.
- Strong performing properties (Top 25%) earn $1,914 or more, indicating effective management and desirable locations/amenities.
- Typical properties (Median) generate around $1,143 per month, representing the average market performance.
- Entry-level properties (Bottom 25%) see earnings around $563, often with potential for optimization.
Average Monthly Airbnb Earnings Trend in Coshocton
Coshocton Airbnb Occupancy Rate Trends (2026)
Maximize your bookings by understanding the Coshocton STR occupancy trends. Seasonal demand shifts significantly influence how often properties are booked. Typically, Novembersees the highest demand (peak season occupancy), while February experiences the lowest (low season). Effective strategies, like adjusting minimum stays or offering promotions, can boost occupancy during slower periods. Here's how different property tiers perform in Coshocton:
- Best-in-class properties (Top 10%) achieve 64%+ occupancy, indicating high desirability and potentially optimized availability.
- Strong performing properties (Top 25%) maintain 46% or higher occupancy, suggesting good market fit and guest satisfaction.
- Typical properties (Median) have an occupancy rate around 28%.
- Entry-level properties (Bottom 25%) average 15% occupancy, potentially facing higher vacancy.
Average Monthly Occupancy Rate Trend in Coshocton
Average Daily Rate (ADR) Airbnb Trends in Coshocton (2026)
Effective short term rental pricing strategy in Coshocton involves understanding monthly ADR fluctuations. The Average Daily Rate (ADR) for Airbnb in Coshocton typically peaks in November and dips lowest during April. Leveraging Airbnb dynamic pricing tools or strategies based on this seasonality can significantly boost revenue. Here's a look at the typical nightly rates achieved:
- Best-in-class properties (Top 10%) command rates of $211+ per night, often due to premium features or locations.
- Strong performing properties (Top 25%) achieve nightly rates of $138 or more.
- Typical properties (Median) charge around $114 per night.
- Entry-level properties (Bottom 25%) earn around $97 per night.
Average Daily Rate (ADR) Trend by Month in Coshocton
Get Live Coshocton Market Intelligence 👇

Explore Real-time Analytics
Airbnb Seasonality Analysis & Trends in Coshocton (2026)
Peak Season (November, October, May)
- Revenue averages $1,858 per month
- Occupancy rates average 40.8%
- Daily rates average $146
Shoulder Season
- Revenue averages $1,562 per month
- Occupancy maintains around 33.1%
- Daily rates hold near $142
Low Season (February, March, April)
- Revenue drops to average $969 per month
- Occupancy decreases to average 22.8%
- Daily rates adjust to average $134
Seasonality Insights for Coshocton
- The Airbnb seasonality in Coshocton shows highly seasonal trends requiring careful strategy. While the sections above show seasonal averages, it's also insightful to look at the extremes:
- During the high season, the absolute peak month showcases Coshocton's highest earning potential, with monthly revenues capable of climbing to $1,916, occupancy reaching a high of 42.2%, and ADRs peaking at $150.
- Conversely, the slowest single month of the year, typically falling within the low season, marks the market's lowest point. In this month, revenue might dip to $707, occupancy could drop to 15.5%, and ADRs may adjust down to $133.
- Understanding both the seasonal averages and these monthly peaks and troughs in revenue, occupancy, and ADR is crucial for maximizing your Airbnb profit potential in Coshocton.
Seasonal Strategies for Maximizing Profit
- Peak Season: Maximize revenue through premium pricing and potentially longer minimum stays. Ensure high availability.
- Low Season: Offer competitive pricing, special promotions (e.g., extended stay discounts), and flexible cancellation policies. Target off-season travelers like remote workers or budget-conscious guests.
- Shoulder Seasons: Implement dynamic pricing that balances peak and low rates. Target weekend travelers or specific events. Offer slightly more flexible terms than peak season.
- Regularly analyze your own performance against these Coshocton seasonality benchmarks and adjust your pricing and availability strategy accordingly.
Best Areas for Airbnb Investment in Coshocton (2026)
Exploring the top neighborhoods for short-term rentals in Coshocton? This section highlights key areas, outlining why they are attractive for hosts and guests, along with notable local attractions. Consider these locations based on your target guest profile and investment strategy.
| Neighborhood / Area | Why Host Here? (Target Guests & Appeal) | Key Attractions & Landmarks |
|---|---|---|
| Historic Roscoe Village | Charming area with preserved historic architecture, offering a glimpse into 19th-century life. Popular for its quaint shops, eateries, and cultural events, making it ideal for visitors seeking local history. | Roscoe Village, Historic Canal, Village Square, Local artisan shops, The Ohio & Erie Canalway |
| Coshocton County Fairgrounds | A vibrant fairground that hosts numerous events throughout the year. Great for travelers attending fairs and local events, making it a lively place for short-term stays. | Coshocton County Fair, Conventions, Seasonal events, Local flea markets, Outdoor activities |
| Lake Park | A picturesque park area with recreational activities and beautiful scenery. Attracts families and individuals looking to enjoy nature and outdoor activities such as fishing or picnicking. | Lake Park, Fishing, Picnic spots, Walking trails, Playgrounds |
| Downtown Coshocton | The bustling center of Coshocton filled with local shops, restaurants, and cultural venues. Offers a convenient stay for those wanting to explore urban amenities and local dining. | Coshocton Public Library, Local eateries, Shopping boutiques, Art galleries, Community events |
| Tuscawaras Riverfront | Scenic riverfront area providing relaxing views and outdoor activities. Popular among nature lovers and those seeking tranquility, perfect for weekend getaways. | Tuscawaras River, Kayaking, Fishing spots, Walking trails, Beautiful scenery |
| Clary Gardens | Beautiful botanical gardens and natural landscapes. Perfect for visitors looking for a peaceful retreat and a connection with nature, making it an appealing accommodation option. | Clary Gardens, Nature trails, Events at the garden, Photography spots, Educational programs |
| Coshocton Historical Society | A cultural hub that showcases the heritage of the area. A must-visit for history buffs and families interested in educational experiences during their stay. | Historical exhibits, Visitor center, Local history events, Community heritage activities, Genealogy resources |
| Canoe Livery | Great for adventure seekers looking to explore the scenic rivers by canoe. This area is a draw for tourists interested in outdoor activities, especially during warmer months. | Canoeing, Nature excursions, Scenic views, Riverside picnics, Local adventure guides |
Understanding Airbnb License Requirements & STR Laws in Coshocton (2026)
While Coshocton, Ohio, United States currently shows low STR regulations, specific Airbnb license requirements might still exist or change. Always verify the latest short term rental regulations and Airbnb license requirements directly with local government authorities for Coshocton to ensure full compliance before hosting.
(Source: AirROI data, 2026, finding no licensed listings among those analyzed)
Top Performing Airbnb Properties in Coshocton (2026)
Benchmark your potential! Explore examples of top-performing Airbnb properties in Coshoctonbased on Trailing Twelve Month (TTM) revenue. Analyze their characteristics, revenue, occupancy rate, and ADR to understand what drives success in this market.
Downtown Historic Craftsman Home
Entire Place • 4 bedrooms
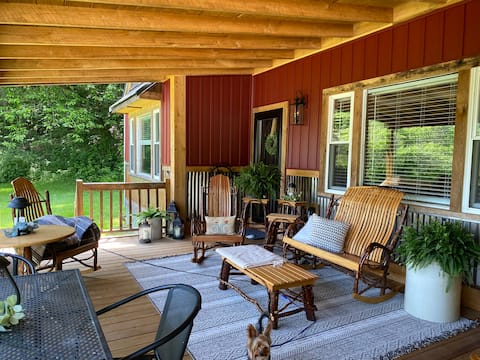
Cabin on the Hill
Entire Place • 3 bedrooms
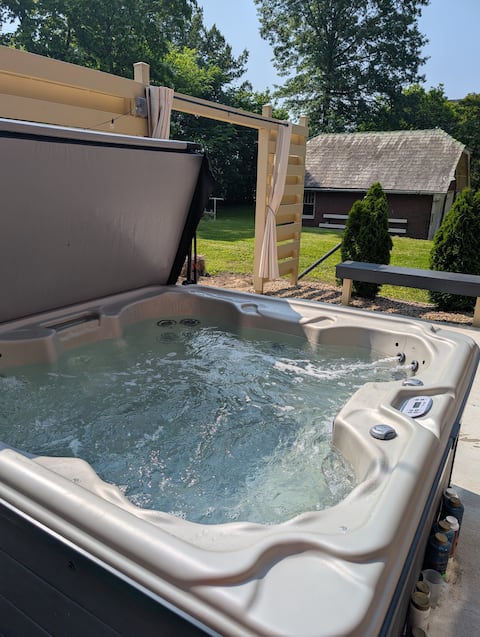
Montgomery Estate *Hot Tub*
Entire Place • 4 bedrooms

Cozy 2 bedroom home with large backyard
Entire Place • 2 bedrooms
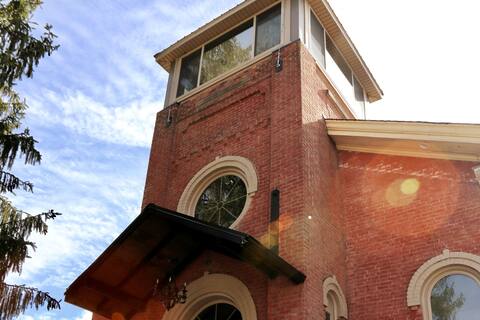
The Bell Tower
Entire Place • 1 bedroom

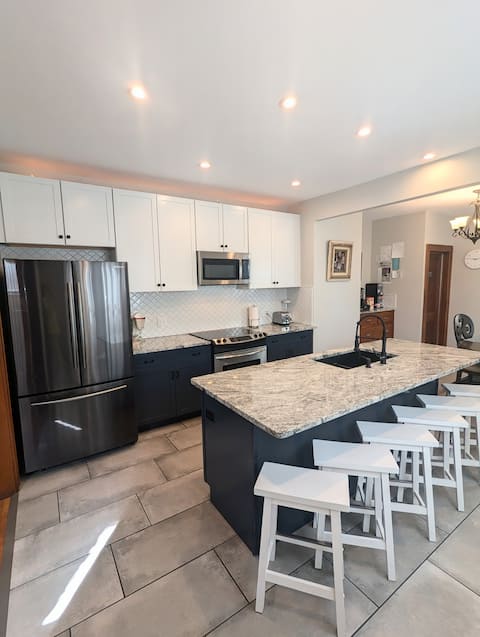
Charming & spacious 1st floor in the heart of town
Entire Place • 1 bedroom
Note: Performance varies based on location, size, amenities, seasonality, and management quality. Data reflects the past 12 months.
Top Performing Airbnb Hosts in Coshocton (2026)
Learn from the best! This table showcases top-performing Airbnb hosts in Coshocton based on the number of properties managed and estimated total revenue over the past year. Analyze their scale and performance metrics.
| Host Name | Properties | Grossing Revenue | Stay Reviews | Avg Rating |
|---|---|---|---|---|
| Amy | 15 | $129,284 | 865 | 4.93/5.0 |
| Maxx | 7 | $101,366 | 760 | 4.81/5.0 |
| Jared | 2 | $78,885 | 159 | 4.98/5.0 |
| Charlene | 2 | $53,747 | 291 | 4.93/5.0 |
| Jade | 1 | $30,133 | 25 | 4.88/5.0 |
| Janae | 1 | $28,537 | 78 | 4.95/5.0 |
| Sharon | 1 | $19,434 | 126 | 5.00/5.0 |
| Mary | 1 | $15,627 | 81 | 4.98/5.0 |
| Evolve | 1 | $13,822 | 1 | Not Rated |
| Erin | 2 | $11,502 | 51 | 4.76/5.0 |
Analyzing the strategies of top hosts, such as their property selection, pricing, and guest communication, can offer valuable lessons for optimizing your own Airbnb operations in Coshocton.
Dive Deeper: Advanced Coshocton STR Market Data (2026)
Ready to unlock more insights? AirROI provides access to advanced metrics and comprehensive Airbnb data for Coshocton. Explore detailed analytics beyond this report to refine your investment strategy, optimize pricing, and maximize your vacation rental profits.
Explore Advanced MetricsCoshocton Short-Term Rental Market Composition (2026): Property & Room Types
Room Type Distribution
Property Type Distribution
Market Composition Insights for Coshocton
- The Coshocton Airbnb market composition is heavily skewed towards Entire Home/Apt listings, which make up 83.3% of the 36 active rentals. This indicates strong guest preference for privacy and space.
- Looking at the property type distribution in Coshocton, Apartment/Condo properties are the most common (55.6%), reflecting the local real estate landscape.
- Houses represent a significant 25% portion, catering likely to families or larger groups.
- The presence of 13.9% Hotel/Boutique listings indicates integration with traditional hospitality.
- Smaller segments like unique stays, outdoor/unique (combined 5.6%) offer potential for unique stay experiences.
Coshocton Airbnb Room Capacity Analysis (2026): Bedroom Distribution
Distribution of Listings by Number of Bedrooms
Room Capacity Insights for Coshocton
- The dominant room capacity in Coshocton is 1 bedroom listings, making up 50% of the market. This suggests a strong demand for properties suitable for couples or solo travelers.
- Together, 1 bedroom and 2 bedrooms properties represent 72.2% of the active Airbnb listings in Coshocton, indicating a high concentration in these sizes.
- A significant 22.3% of listings offer 3+ bedrooms, catering to larger groups and families seeking more space in Coshocton.
Coshocton Vacation Rental Guest Capacity Trends (2026)
Distribution of Listings by Guest Capacity
Guest Capacity Insights for Coshocton
- The most common guest capacity trend in Coshocton vacation rentals is listings accommodating 2 guests (33.3%). This suggests the primary traveler segment is likely couples or solo travelers.
- Properties designed for 2 guests and 4 guests dominate the Coshocton STR market, accounting for 61.1% of listings.
- 19.4% of properties accommodate 6+ guests, serving the market segment for larger families or group travel in Coshocton.
- On average, properties in Coshocton are equipped to host 3.8 guests.
Coshocton Airbnb Booking Patterns (2026): Available vs. Booked Days
Available Days Distribution
Booked Days Distribution
Booking Pattern Insights for Coshocton
- The most common availability pattern in Coshocton falls within the 181-270 days range, representing 50% of listings. This suggests many properties have significant open periods on their calendars.
- Approximately 94.4% of listings show high availability (181+ days open annually), indicating potential for increased bookings or specific owner usage patterns.
- For booked days, the 91-180 days range is most frequent in Coshocton (52.8%), reflecting common guest stay durations or potential owner blocking patterns.
- A notable 5.6% of properties secure long booking periods (181+ days booked per year), highlighting successful long-term rental strategies or significant owner usage.
Coshocton Airbnb Minimum Stay Requirements Analysis
Distribution of Listings by Minimum Night Requirement
1 Night
28 listings
77.8% of total
2 Nights
3 listings
8.3% of total
30+ Nights
5 listings
13.9% of total
Key Insights
- The most prevalent minimum stay requirement in Coshocton is 1 Night, adopted by 77.8% of listings. This highlights the market's preference for shorter, flexible bookings.
- A strong majority (86.1%) of the Coshocton Airbnb data shows acceptance of very short stays (1-2 nights), indicating a dynamic, high-turnover market.
- A significant segment (13.9%) caters to monthly stays (30+ nights) in Coshocton, pointing to opportunities in the extended-stay market.
Recommendations
- Align with the market by considering a 1 Night minimum stay, as 77.8% of Coshocton hosts use this setting.
- Explore offering discounts for stays of 30+ nights to attract the 13.9% of the market seeking extended stays.
- Adjust minimum nights based on seasonality – potentially shorter during low season and longer during peak demand periods in Coshocton.
Coshocton Airbnb Cancellation Policy Trends Analysis (2026)
Flexible
20 listings
55.6% of total
Moderate
11 listings
30.6% of total
Firm
4 listings
11.1% of total
Strict
1 listings
2.8% of total
Cancellation Policy Insights for Coshocton
- The prevailing Airbnb cancellation policy trend in Coshocton is Flexible, used by 55.6% of listings.
- The market strongly favors guest-friendly terms, with 86.2% of listings offering Flexible or Moderate policies. This suggests guests in Coshocton may expect booking flexibility.
- Strict cancellation policies are quite rare (2.8%), potentially making listings with this policy less competitive unless justified by high demand or property type.
Recommendations for Hosts
- Consider adopting a Flexible policy to align with the 55.6% market standard in Coshocton.
- Given the high prevalence of Flexible policies (55.6%), offering this can enhance booking appeal, especially during shoulder seasons.
- Using a Strict policy might deter some guests, as only 2.8% of listings use it. Evaluate if potential revenue protection outweighs possible lower booking rates.
- Regularly review your cancellation policy against competitors and market demand shifts in Coshocton.
Coshocton STR Booking Lead Time Analysis (2026)
Average Booking Lead Time by Month
Booking Lead Time Insights for Coshocton
- The overall average booking lead time for vacation rentals in Coshocton is 43 days.
- Guests book furthest in advance for stays during August (average 91 days), likely coinciding with peak travel demand or local events.
- The shortest booking windows occur for stays in January (average 14 days), indicating more last-minute travel plans during this time.
- Seasonally, Summer (59 days avg.) sees the longest lead times, while Winter (23 days avg.) has the shortest, reflecting typical travel planning cycles.
Recommendations for Hosts
- Use the overall average lead time (43 days) as a baseline for your pricing and availability strategy in Coshocton.
- For August stays, consider implementing length-of-stay discounts or slightly higher rates for bookings made less than 91 days out to capitalize on advance planning.
- During January, focus on last-minute booking availability and promotions, as guests book with very short notice (14 days avg.).
- Target marketing efforts for the Summer season well in advance (at least 59 days) to capture early planners.
- Monitor your own booking lead times against these Coshocton averages to identify opportunities for dynamic pricing adjustments.
Popular & Essential Airbnb Amenities in Coshocton (2026)
Amenity Prevalence
Amenity Insights for Coshocton
- Essential amenities in Coshocton that guests expect include: Air conditioning, Wifi, TV, Free parking on premises. Lacking these (any) could significantly impact bookings.
- Popular amenities like Heating, Essentials, Hair dryer are common but not universal. Offering these can provide a competitive edge.
Recommendations for Hosts
- Ensure your listing includes all essential amenities for Coshocton: Air conditioning, Wifi, TV, Free parking on premises.
- Prioritize adding missing essentials: TV, Free parking on premises.
- Consider adding popular differentiators like Heating or Essentials to increase appeal.
- Highlight unique or less common amenities you offer (e.g., hot tub, dedicated workspace, EV charger) in your listing description and photos.
- Regularly check competitor amenities in Coshocton to stay competitive.
Coshocton Airbnb Guest Demographics & Profile Analysis (2026)
Guest Profile Summary for Coshocton
- The typical guest profile for Airbnb in Coshocton consists of primarily domestic travelers (100%), often arriving from nearby Columbus, typically belonging to the Post-2000s (Gen Z/Alpha) group (50%), primarily speaking English or Spanish.
- Domestic travelers account for 99.7% of guests.
- Key international markets include United States (99.7%) and Canada (0.3%).
- Top languages spoken are English (85%) followed by Spanish (7.9%).
- A significant demographic segment is the Post-2000s (Gen Z/Alpha) group, representing 50% of guests.
Recommendations for Hosts
- Target domestic marketing efforts towards travelers from Columbus and Coshocton.
- Tailor amenities and listing descriptions to appeal to the dominant Post-2000s (Gen Z/Alpha) demographic (e.g., highlight fast WiFi, smart home features, local guides).
- Highlight unique local experiences or amenities relevant to the primary guest profile.
- Consider seasonal promotions aligned with peak travel times for key origin markets.
Nearby Short-Term Rental Market Comparison
How does the Coshocton Airbnb market stack up against its neighbors? Compare key performance metrics like average monthly revenue, ADR, and occupancy rates in surrounding areas to understand the broader regional STR landscape.
| Market | Active Properties | Monthly Revenue | Daily Rate | Avg. Occupancy |
|---|---|---|---|---|
| Sugar Grove | 16 | $6,172 | $489.99 | 43% |
| Creola | 18 | $5,899 | $403.00 | 53% |
| Hocking County | 11 | $5,712 | $508.21 | 49% |
| Rockbridge | 229 | $5,257 | $400.48 | 46% |
| Huron Township | 17 | $5,053 | $484.21 | 40% |
| Berlin Township | 11 | $5,023 | $386.97 | 46% |
| Logan | 688 | $4,907 | $388.67 | 45% |
| Berne Township | 15 | $4,897 | $490.66 | 37% |
| Swan Township | 111 | $4,727 | $334.40 | 49% |
| South Bloomingville | 129 | $4,565 | $312.34 | 48% |