Colerain Township Airbnb Market Analysis 2026: Short Term Rental Data & Vacation Rental Statistics in Ohio, United States
Is Airbnb profitable in Colerain Township in 2026? Explore comprehensive Airbnb analytics for Colerain Township, Ohio, United States to uncover income potential. This 2026 STR market report for Colerain Township, based on AirROI data from February 2025 to January 2026, reveals key trends in the niche market of 27 active listings.
Whether you're considering an Airbnb investment in Colerain Township, optimizing your existing vacation rental, or exploring rental arbitrage opportunities, understanding the Colerain Township Airbnb data is crucial. Leveraging the low regulation environment is key to maximizing your short term rental income potential. Let's dive into the specifics.
Key Colerain Township Airbnb Performance Metrics Overview
Monthly Airbnb Revenue Variations & Income Potential in Colerain Township (2026)
Understanding the monthly revenue variations for Airbnb listings in Colerain Township is key to maximizing your short term rental income potential. Seasonality significantly impacts earnings. Our analysis, based on data from the past 12 months, shows that the peak revenue month for STRs in Colerain Township is typically July, while January often presents the lowest earnings, highlighting opportunities for strategic pricing adjustments during shoulder and low seasons. Explore the typical Airbnb income in Colerain Township across different performance tiers:
- Best-in-class properties (Top 10%) achieve $3,683+ monthly, often utilizing dynamic pricing and superior guest experiences.
- Strong performing properties (Top 25%) earn $2,411 or more, indicating effective management and desirable locations/amenities.
- Typical properties (Median) generate around $1,061 per month, representing the average market performance.
- Entry-level properties (Bottom 25%) see earnings around $479, often with potential for optimization.
Average Monthly Airbnb Earnings Trend in Colerain Township
Colerain Township Airbnb Occupancy Rate Trends (2026)
Maximize your bookings by understanding the Colerain Township STR occupancy trends. Seasonal demand shifts significantly influence how often properties are booked. Typically, Julysees the highest demand (peak season occupancy), while January experiences the lowest (low season). Effective strategies, like adjusting minimum stays or offering promotions, can boost occupancy during slower periods. Here's how different property tiers perform in Colerain Township:
- Best-in-class properties (Top 10%) achieve 74%+ occupancy, indicating high desirability and potentially optimized availability.
- Strong performing properties (Top 25%) maintain 60% or higher occupancy, suggesting good market fit and guest satisfaction.
- Typical properties (Median) have an occupancy rate around 42%.
- Entry-level properties (Bottom 25%) average 27% occupancy, potentially facing higher vacancy.
Average Monthly Occupancy Rate Trend in Colerain Township
Average Daily Rate (ADR) Airbnb Trends in Colerain Township (2026)
Effective short term rental pricing strategy in Colerain Township involves understanding monthly ADR fluctuations. The Average Daily Rate (ADR) for Airbnb in Colerain Township typically peaks in July and dips lowest during February. Leveraging Airbnb dynamic pricing tools or strategies based on this seasonality can significantly boost revenue. Here's a look at the typical nightly rates achieved:
- Best-in-class properties (Top 10%) command rates of $233+ per night, often due to premium features or locations.
- Strong performing properties (Top 25%) achieve nightly rates of $162 or more.
- Typical properties (Median) charge around $97 per night.
- Entry-level properties (Bottom 25%) earn around $43 per night.
Average Daily Rate (ADR) Trend by Month in Colerain Township
Get Live Colerain Township Market Intelligence 👇

Explore Real-time Analytics
Airbnb Seasonality Analysis & Trends in Colerain Township (2026)
Peak Season (July, August, October)
- Revenue averages $2,260 per month
- Occupancy rates average 52.6%
- Daily rates average $125
Shoulder Season
- Revenue averages $1,661 per month
- Occupancy maintains around 44.9%
- Daily rates hold near $117
Low Season (January, February, April)
- Revenue drops to average $991 per month
- Occupancy decreases to average 34.3%
- Daily rates adjust to average $111
Seasonality Insights for Colerain Township
- The Airbnb seasonality in Colerain Township shows highly seasonal trends requiring careful strategy. While the sections above show seasonal averages, it's also insightful to look at the extremes:
- During the high season, the absolute peak month showcases Colerain Township's highest earning potential, with monthly revenues capable of climbing to $2,322, occupancy reaching a high of 54.2%, and ADRs peaking at $128.
- Conversely, the slowest single month of the year, typically falling within the low season, marks the market's lowest point. In this month, revenue might dip to $883, occupancy could drop to 25.4%, and ADRs may adjust down to $108.
- Understanding both the seasonal averages and these monthly peaks and troughs in revenue, occupancy, and ADR is crucial for maximizing your Airbnb profit potential in Colerain Township.
Seasonal Strategies for Maximizing Profit
- Peak Season: Maximize revenue through premium pricing and potentially longer minimum stays. Ensure high availability.
- Low Season: Offer competitive pricing, special promotions (e.g., extended stay discounts), and flexible cancellation policies. Target off-season travelers like remote workers or budget-conscious guests.
- Shoulder Seasons: Implement dynamic pricing that balances peak and low rates. Target weekend travelers or specific events. Offer slightly more flexible terms than peak season.
- Regularly analyze your own performance against these Colerain Township seasonality benchmarks and adjust your pricing and availability strategy accordingly.
Best Areas for Airbnb Investment in Colerain Township (2026)
Exploring the top neighborhoods for short-term rentals in Colerain Township? This section highlights key areas, outlining why they are attractive for hosts and guests, along with notable local attractions. Consider these locations based on your target guest profile and investment strategy.
| Neighborhood / Area | Why Host Here? (Target Guests & Appeal) | Key Attractions & Landmarks |
|---|---|---|
| Colerain Park | A quiet suburban area known for its green spaces and family-friendly environment. Perfect for families and visitors looking for a peaceful stay close to nature. | Colerain Park, Winton Woods, Great Parks of Hamilton County, Winton Centre, Colerain Avenue shopping |
| Northgate | A bustling area with a popular shopping mall and a variety of dining options. Ideal for visitors who want access to retail and entertainment. | Northgate Mall, Cincinnati Premium Outlets, The Oakley Kitchen, Local breweries, Movie theaters |
| Colerain Township Business District | A commercial hub with business amenities that attract business travelers. Convenient for those looking for short stays for work-related travel. | Local restaurants, Business offices, Proximity to highway access, Shopping plazas, Civic center |
| Mt. Airy Forest | A large park offering outdoor activities like hiking and picnicking. Great for tourists who enjoy nature and want to escape the city. | Mt. Airy Forest, Hiking trails, Nature center, Picnic areas, Scenic views |
| White Oak | A residential community providing a suburban feel with park and recreational options. A good choice for families and weekend visitors. | White Oak Park, Family-friendly restaurants, Local shops, Community events, Sports fields |
| Finneytown | A small suburban area known for its community vibe and access to schools and amenities. Attractive for families visiting the area. | Finneytown School District, Local parks, Community centers, Neighborhood events, Small-town feel |
| Springdale | Nearby town with entertainment and dining options, making it attractive for those visiting nearby attractions. Good for short-term stays. | Springdale shopping, Restaurants, Cincinnati Water Park, Nearby attractions, Community events |
| Saylor Park | A quiet neighborhood that offers easy access to the main roads and surrounding attractions. Good for budget travelers looking for convenience. | Saylor Park, Proximity to highway, Local parks, Affordable dining options, Shopping areas |
Understanding Airbnb License Requirements & STR Laws in Colerain Township (2026)
While Colerain Township, Ohio, United States currently shows low STR regulations, specific Airbnb license requirements might still exist or change. Always verify the latest short term rental regulations and Airbnb license requirements directly with local government authorities for Colerain Township to ensure full compliance before hosting.
(Source: AirROI data, 2026, finding no licensed listings among those analyzed)
Top Performing Airbnb Properties in Colerain Township (2026)
Benchmark your potential! Explore examples of top-performing Airbnb properties in Colerain Townshipbased on Trailing Twelve Month (TTM) revenue. Analyze their characteristics, revenue, occupancy rate, and ADR to understand what drives success in this market.
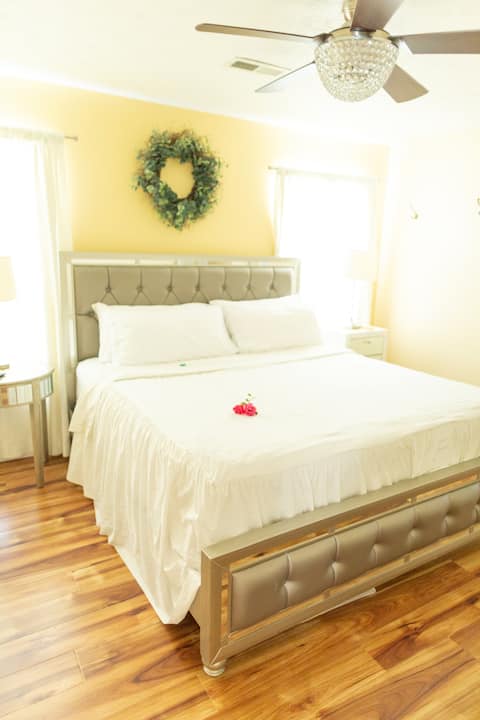
Rose Haven • Peaceful • Romantic • Family-Ready
Entire Place • 2 bedrooms

Among trees outside the city
Entire Place • 5 bedrooms

Modern 3BR • Xbox • Sleeps 8 • Near DT + Parking
Entire Place • 3 bedrooms
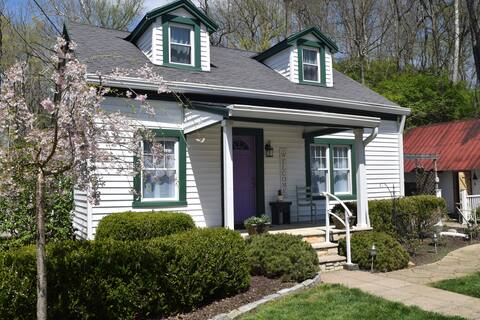
Day’s End Cottage: Peaceful, Charming, & Clean
Entire Place • 2 bedrooms

2 Kings, 4K TV, Grill, Fast Wi-Fi, No steps
Entire Place • 3 bedrooms

All you need away from home
Entire Place • 3 bedrooms
Note: Performance varies based on location, size, amenities, seasonality, and management quality. Data reflects the past 12 months.
Top Performing Airbnb Hosts in Colerain Township (2026)
Learn from the best! This table showcases top-performing Airbnb hosts in Colerain Township based on the number of properties managed and estimated total revenue over the past year. Analyze their scale and performance metrics.
| Host Name | Properties | Grossing Revenue | Stay Reviews | Avg Rating |
|---|---|---|---|---|
| Suzi | 1 | $50,186 | 219 | 4.96/5.0 |
| Jason | 1 | $43,284 | 36 | 4.83/5.0 |
| Latoya | 8 | $37,550 | 327 | 4.61/5.0 |
| Kathy | 1 | $36,851 | 81 | 4.95/5.0 |
| Tricia | 1 | $35,607 | 232 | 4.99/5.0 |
| Michelle | 1 | $33,509 | 54 | 4.85/5.0 |
| Camara | 1 | $29,285 | 68 | 4.87/5.0 |
| Heather Elizabeth | 1 | $27,476 | 42 | 4.93/5.0 |
| Tracy Ann | 1 | $25,307 | 46 | 4.83/5.0 |
| Clifford | 1 | $21,122 | 62 | 4.85/5.0 |
Analyzing the strategies of top hosts, such as their property selection, pricing, and guest communication, can offer valuable lessons for optimizing your own Airbnb operations in Colerain Township.
Dive Deeper: Advanced Colerain Township STR Market Data (2026)
Ready to unlock more insights? AirROI provides access to advanced metrics and comprehensive Airbnb data for Colerain Township. Explore detailed analytics beyond this report to refine your investment strategy, optimize pricing, and maximize your vacation rental profits.
Explore Advanced MetricsColerain Township Short-Term Rental Market Composition (2026): Property & Room Types
Room Type Distribution
Property Type Distribution
Market Composition Insights for Colerain Township
- The Colerain Township Airbnb market composition is heavily skewed towards Entire Home/Apt listings, which make up 51.9% of the 27 active rentals. This indicates strong guest preference for privacy and space.
- However, a notable 48.1% share for Private Rooms suggests opportunities for budget-conscious travelers or hosts renting out spare rooms.
- Looking at the property type distribution in Colerain Township, House properties are the most common (92.6%), reflecting the local real estate landscape.
- Houses represent a significant 92.6% portion, catering likely to families or larger groups.
Colerain Township Airbnb Room Capacity Analysis (2026): Bedroom Distribution
Distribution of Listings by Number of Bedrooms
Room Capacity Insights for Colerain Township
- The dominant room capacity in Colerain Township is 3 bedrooms listings, making up 22.2% of the market. This suggests a strong demand for properties suitable for families or small groups.
- Together, 3 bedrooms and 2 bedrooms properties represent 37.0% of the active Airbnb listings in Colerain Township, indicating a high concentration in these sizes.
- A significant 37.0% of listings offer 3+ bedrooms, catering to larger groups and families seeking more space in Colerain Township.
Colerain Township Vacation Rental Guest Capacity Trends (2026)
Distribution of Listings by Guest Capacity
Guest Capacity Insights for Colerain Township
- The most common guest capacity trend in Colerain Township vacation rentals is listings accommodating 6 guests (22.2%). This suggests the primary traveler segment is likely larger groups.
- Properties designed for 6 guests and 8+ guests dominate the Colerain Township STR market, accounting for 33.3% of listings.
- 37.0% of properties accommodate 6+ guests, serving the market segment for larger families or group travel in Colerain Township.
- On average, properties in Colerain Township are equipped to host 3.0 guests.
Colerain Township Airbnb Booking Patterns (2026): Available vs. Booked Days
Available Days Distribution
Booked Days Distribution
Booking Pattern Insights for Colerain Township
- The most common availability pattern in Colerain Township falls within the 181-270 days range, representing 40.7% of listings. This suggests many properties have significant open periods on their calendars.
- Approximately 70.3% of listings show high availability (181+ days open annually), indicating potential for increased bookings or specific owner usage patterns.
- For booked days, the 91-180 days range is most frequent in Colerain Township (37%), reflecting common guest stay durations or potential owner blocking patterns.
- A notable 33.3% of properties secure long booking periods (181+ days booked per year), highlighting successful long-term rental strategies or significant owner usage.
Colerain Township Airbnb Minimum Stay Requirements Analysis
Distribution of Listings by Minimum Night Requirement
1 Night
8 listings
29.6% of total
2 Nights
6 listings
22.2% of total
3 Nights
2 listings
7.4% of total
4-6 Nights
7 listings
25.9% of total
30+ Nights
4 listings
14.8% of total
Key Insights
- The most prevalent minimum stay requirement in Colerain Township is 1 Night, adopted by 29.6% of listings. This highlights the market's preference for shorter, flexible bookings.
- A significant segment (14.8%) caters to monthly stays (30+ nights) in Colerain Township, pointing to opportunities in the extended-stay market.
Recommendations
- Align with the market by considering a 1 Night minimum stay, as 29.6% of Colerain Township hosts use this setting.
- If feasible, allowing 1-night stays, especially midweek or during low season, could capture last-minute bookings, as only 29.6% currently do.
- Explore offering discounts for stays of 30+ nights to attract the 14.8% of the market seeking extended stays.
- Adjust minimum nights based on seasonality – potentially shorter during low season and longer during peak demand periods in Colerain Township.
Colerain Township Airbnb Cancellation Policy Trends Analysis (2026)
Flexible
10 listings
37% of total
Moderate
9 listings
33.3% of total
Firm
7 listings
25.9% of total
Strict
1 listings
3.7% of total
Cancellation Policy Insights for Colerain Township
- The prevailing Airbnb cancellation policy trend in Colerain Township is Flexible, used by 37% of listings.
- The market strongly favors guest-friendly terms, with 70.3% of listings offering Flexible or Moderate policies. This suggests guests in Colerain Township may expect booking flexibility.
- Strict cancellation policies are quite rare (3.7%), potentially making listings with this policy less competitive unless justified by high demand or property type.
Recommendations for Hosts
- Consider adopting a Flexible policy to align with the 37% market standard in Colerain Township.
- Using a Strict policy might deter some guests, as only 3.7% of listings use it. Evaluate if potential revenue protection outweighs possible lower booking rates.
- Regularly review your cancellation policy against competitors and market demand shifts in Colerain Township.
Colerain Township STR Booking Lead Time Analysis (2026)
Average Booking Lead Time by Month
Booking Lead Time Insights for Colerain Township
- The overall average booking lead time for vacation rentals in Colerain Township is 23 days.
- Guests book furthest in advance for stays during May (average 47 days), likely coinciding with peak travel demand or local events.
- The shortest booking windows occur for stays in March (average 11 days), indicating more last-minute travel plans during this time.
- Seasonally, Summer (34 days avg.) sees the longest lead times, while Winter (20 days avg.) has the shortest, reflecting typical travel planning cycles.
Recommendations for Hosts
- Use the overall average lead time (23 days) as a baseline for your pricing and availability strategy in Colerain Township.
- For May stays, consider implementing length-of-stay discounts or slightly higher rates for bookings made less than 47 days out to capitalize on advance planning.
- During March, focus on last-minute booking availability and promotions, as guests book with very short notice (11 days avg.).
- Target marketing efforts for the Summer season well in advance (at least 34 days) to capture early planners.
- Monitor your own booking lead times against these Colerain Township averages to identify opportunities for dynamic pricing adjustments.
Popular & Essential Airbnb Amenities in Colerain Township (2026)
Amenity Prevalence
Amenity Insights for Colerain Township
- Essential amenities in Colerain Township that guests expect include: TV, Smoke alarm, Free parking on premises, Hot water, Fire extinguisher, Wifi, Refrigerator, Air conditioning. Lacking these (any) could significantly impact bookings.
- Popular amenities like Essentials, Heating are common but not universal. Offering these can provide a competitive edge.
Recommendations for Hosts
- Ensure your listing includes all essential amenities for Colerain Township: TV, Smoke alarm, Free parking on premises, Hot water, Fire extinguisher, Wifi, Refrigerator, Air conditioning.
- Prioritize adding missing essentials: Hot water, Fire extinguisher, Wifi, Refrigerator, Air conditioning.
- Consider adding popular differentiators like Essentials or Heating to increase appeal.
- Highlight unique or less common amenities you offer (e.g., hot tub, dedicated workspace, EV charger) in your listing description and photos.
- Regularly check competitor amenities in Colerain Township to stay competitive.
Colerain Township Airbnb Guest Demographics & Profile Analysis (2026)
Guest Profile Summary for Colerain Township
- The typical guest profile for Airbnb in Colerain Township consists of primarily domestic travelers (93%), often arriving from nearby Indianapolis, typically belonging to the Post-2000s (Gen Z/Alpha) group (50%), primarily speaking English or Spanish.
- Domestic travelers account for 93.0% of guests.
- Key international markets include United States (93%) and Poland (2.3%).
- Top languages spoken are English (74.2%) followed by Spanish (7.3%).
- A significant demographic segment is the Post-2000s (Gen Z/Alpha) group, representing 50% of guests.
Recommendations for Hosts
- Target domestic marketing efforts towards travelers from Indianapolis and Cincinnati.
- Tailor amenities and listing descriptions to appeal to the dominant Post-2000s (Gen Z/Alpha) demographic (e.g., highlight fast WiFi, smart home features, local guides).
- Highlight unique local experiences or amenities relevant to the primary guest profile.
- Consider seasonal promotions aligned with peak travel times for key origin markets.
Nearby Short-Term Rental Market Comparison
How does the Colerain Township Airbnb market stack up against its neighbors? Compare key performance metrics like average monthly revenue, ADR, and occupancy rates in surrounding areas to understand the broader regional STR landscape.
| Market | Active Properties | Monthly Revenue | Daily Rate | Avg. Occupancy |
|---|---|---|---|---|
| Lawrenceburg | 65 | $4,477 | $360.32 | 45% |
| Crittenden | 18 | $3,944 | $261.97 | 48% |
| Walton | 22 | $3,840 | $225.35 | 58% |
| Burlington | 17 | $3,773 | $236.57 | 48% |
| Williamstown | 204 | $3,674 | $263.96 | 49% |
| Deerfield Township | 33 | $3,565 | $288.53 | 41% |
| Lebanon | 30 | $3,554 | $277.26 | 44% |
| Corinth | 17 | $3,457 | $270.49 | 48% |
| Oxford | 120 | $3,412 | $562.95 | 36% |
| Versailles | 61 | $3,375 | $350.32 | 44% |