Cleveland Airbnb Market Analysis 2026: Short Term Rental Data & Vacation Rental Statistics in Ohio, United States
Is Airbnb profitable in Cleveland in 2026? Explore comprehensive Airbnb analytics for Cleveland, Ohio, United States to uncover income potential. This 2026 STR market report for Cleveland, based on AirROI data from February 2025 to January 2026, reveals key trends in the bustling market of 1,685 active listings.
Whether you're considering an Airbnb investment in Cleveland, optimizing your existing vacation rental, or exploring rental arbitrage opportunities, understanding the Cleveland Airbnb data is crucial. Leveraging the low regulation environment is key to maximizing your short term rental income potential. Let's dive into the specifics.
Key Cleveland Airbnb Performance Metrics Overview
Monthly Airbnb Revenue Variations & Income Potential in Cleveland (2026)
Understanding the monthly revenue variations for Airbnb listings in Cleveland is key to maximizing your short term rental income potential. Seasonality significantly impacts earnings. Our analysis, based on data from the past 12 months, shows that the peak revenue month for STRs in Cleveland is typically July, while January often presents the lowest earnings, highlighting opportunities for strategic pricing adjustments during shoulder and low seasons. Explore the typical Airbnb income in Cleveland across different performance tiers:
- Best-in-class properties (Top 10%) achieve $5,082+ monthly, often utilizing dynamic pricing and superior guest experiences.
- Strong performing properties (Top 25%) earn $3,453 or more, indicating effective management and desirable locations/amenities.
- Typical properties (Median) generate around $1,998 per month, representing the average market performance.
- Entry-level properties (Bottom 25%) see earnings around $944, often with potential for optimization.
Average Monthly Airbnb Earnings Trend in Cleveland
Cleveland Airbnb Occupancy Rate Trends (2026)
Maximize your bookings by understanding the Cleveland STR occupancy trends. Seasonal demand shifts significantly influence how often properties are booked. Typically, Julysees the highest demand (peak season occupancy), while January experiences the lowest (low season). Effective strategies, like adjusting minimum stays or offering promotions, can boost occupancy during slower periods. Here's how different property tiers perform in Cleveland:
- Best-in-class properties (Top 10%) achieve 83%+ occupancy, indicating high desirability and potentially optimized availability.
- Strong performing properties (Top 25%) maintain 67% or higher occupancy, suggesting good market fit and guest satisfaction.
- Typical properties (Median) have an occupancy rate around 46%.
- Entry-level properties (Bottom 25%) average 23% occupancy, potentially facing higher vacancy.
Average Monthly Occupancy Rate Trend in Cleveland
Average Daily Rate (ADR) Airbnb Trends in Cleveland (2026)
Effective short term rental pricing strategy in Cleveland involves understanding monthly ADR fluctuations. The Average Daily Rate (ADR) for Airbnb in Cleveland typically peaks in December and dips lowest during February. Leveraging Airbnb dynamic pricing tools or strategies based on this seasonality can significantly boost revenue. Here's a look at the typical nightly rates achieved:
- Best-in-class properties (Top 10%) command rates of $283+ per night, often due to premium features or locations.
- Strong performing properties (Top 25%) achieve nightly rates of $197 or more.
- Typical properties (Median) charge around $137 per night.
- Entry-level properties (Bottom 25%) earn around $90 per night.
Average Daily Rate (ADR) Trend by Month in Cleveland
Get Live Cleveland Market Intelligence 👇

Explore Real-time Analytics
Airbnb Seasonality Analysis & Trends in Cleveland (2026)
Peak Season (July, August, June)
- Revenue averages $3,166 per month
- Occupancy rates average 51.2%
- Daily rates average $173
Shoulder Season
- Revenue averages $2,576 per month
- Occupancy maintains around 45.2%
- Daily rates hold near $168
Low Season (January, February, April)
- Revenue drops to average $1,918 per month
- Occupancy decreases to average 43.4%
- Daily rates adjust to average $144
Seasonality Insights for Cleveland
- The Airbnb seasonality in Cleveland shows moderate seasonality with distinct peak and low periods. While the sections above show seasonal averages, it's also insightful to look at the extremes:
- During the high season, the absolute peak month showcases Cleveland's highest earning potential, with monthly revenues capable of climbing to $3,344, occupancy reaching a high of 52.8%, and ADRs peaking at $181.
- Conversely, the slowest single month of the year, typically falling within the low season, marks the market's lowest point. In this month, revenue might dip to $1,807, occupancy could drop to 35.6%, and ADRs may adjust down to $135.
- Understanding both the seasonal averages and these monthly peaks and troughs in revenue, occupancy, and ADR is crucial for maximizing your Airbnb profit potential in Cleveland.
Seasonal Strategies for Maximizing Profit
- Peak Season: Maximize revenue through premium pricing and potentially longer minimum stays. Ensure high availability.
- Low Season: Offer competitive pricing, special promotions (e.g., extended stay discounts), and flexible cancellation policies. Target off-season travelers like remote workers or budget-conscious guests.
- Shoulder Seasons: Implement dynamic pricing that balances peak and low rates. Target weekend travelers or specific events. Offer slightly more flexible terms than peak season.
- Regularly analyze your own performance against these Cleveland seasonality benchmarks and adjust your pricing and availability strategy accordingly.
Best Areas for Airbnb Investment in Cleveland (2026)
Exploring the top neighborhoods for short-term rentals in Cleveland? This section highlights key areas, outlining why they are attractive for hosts and guests, along with notable local attractions. Consider these locations based on your target guest profile and investment strategy.
| Neighborhood / Area | Why Host Here? (Target Guests & Appeal) | Key Attractions & Landmarks |
|---|---|---|
| Ohio City | Historic neighborhood known for its vibrant food scene and craft breweries. Popular with young professionals and those looking for a unique cultural experience close to downtown Cleveland. | West Side Market, Great Lakes Brewing Company, Market Garden Brewery, Ohio City Bicycle Co-op, Cleveland EcoVillage |
| Tremont | Trendy area known for its artsy vibe, historic architecture, and dining options. Attracts visitors looking for a mix of culture and urban living away from the hustle of downtown. | Tremont ArtWalk, Sokolowski's University Inn, The Treehouse, St. Theodosius Russian Orthodox Cathedral, Cleveland Public Theatre |
| Lakewood | Quaint suburb with a strong community feel and proximity to Lake Erie. Appeals to families and visitors looking for a quieter stay close to the city. | Lakewood Park, Cleveland Metroparks, Lake Erie, Beck Center for the Arts, The Root Cafe |
| Downtown Cleveland | Central business district with a mix of entertainment, dining, and cultural attractions. Ideal for tourists looking for convenience and access to major attractions. | Cleveland Brown Stadium, Rock and Roll Hall of Fame, Playhouse Square, Edgewater Park, Heinen's Grocery Store |
| University Circle | Cultural hub boasting world-class museums and institutions. Popular with both tourists and academics seeking to experience Cleveland's rich cultural offerings. | Cleveland Museum of Art, Cleveland Botanical Garden, Case Western Reserve University, Severance Hall, Ursuline College |
| Cleveland Heights | Diverse neighborhood known for its charming homes and community atmosphere. Attractive to families and visitors wanting to experience local life. | Cedar Lee Theatre, Dunn Pond, Heights Libraries, Local restaurants and shops, Cleveland Heights Dog Park |
| Shaker Heights | Suburban area famous for its historic homes and tree-lined streets. Appeals to guests looking for a peaceful residential area close to the city. | Shaker Lakes Regional Nature Center, Van Aken District, Shaker Square, RTA Light Rail Station, Local parks |
| Collinwood | Emerging neighborhood with a rich arts scene and local charm. Offers a unique option for guests seeking a less commercialized experience in Cleveland. | Colinwood Arts District, Euclid Beach Park, Wildwood Park, Local eateries and shops, Cleveland Cultural Gardens |
Understanding Airbnb License Requirements & STR Laws in Cleveland (2026)
While Cleveland, Ohio, United States currently shows low STR regulations, specific Airbnb license requirements might still exist or change. Always verify the latest short term rental regulations and Airbnb license requirements directly with local government authorities for Cleveland to ensure full compliance before hosting.
(Source: AirROI data, 2026, based on 1% licensed listings)
Top Performing Airbnb Properties in Cleveland (2026)
Benchmark your potential! Explore examples of top-performing Airbnb properties in Clevelandbased on Trailing Twelve Month (TTM) revenue. Analyze their characteristics, revenue, occupancy rate, and ADR to understand what drives success in this market.
The Double Duck - Sleeps 30! Steps from Downtown
Entire Place • 7 bedrooms

Westside Warehouse-Over 4500 sqft of Luxury living
Entire Place • 5 bedrooms

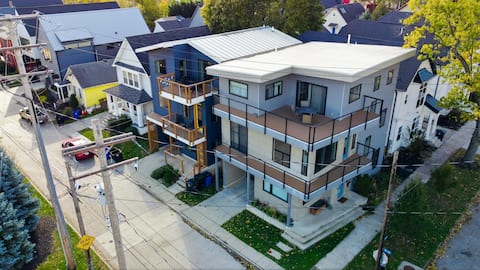
Tremont Townhouse with Skyline Views
Entire Place • 3 bedrooms

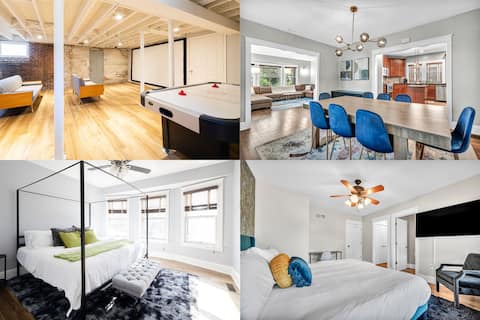
Tremont Eleven | 3 King Caspers | Gameroom
Entire Place • 4 bedrooms
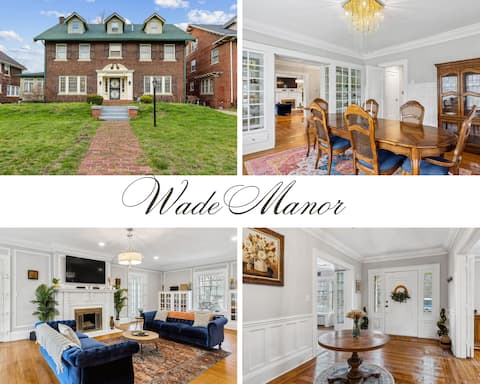
Wade Manor-GameRoom, Gym, Office & Fenced Backyard
Entire Place • 7 bedrooms
Luxurious 9 BR Movie Theater Duplex Near CWRU!
Entire Place • 9 bedrooms
Note: Performance varies based on location, size, amenities, seasonality, and management quality. Data reflects the past 12 months.
Top Performing Airbnb Hosts in Cleveland (2026)
Learn from the best! This table showcases top-performing Airbnb hosts in Cleveland based on the number of properties managed and estimated total revenue over the past year. Analyze their scale and performance metrics.
| Host Name | Properties | Grossing Revenue | Stay Reviews | Avg Rating |
|---|---|---|---|---|
| Dani | 82 | $2,170,725 | 5790 | 4.72/5.0 |
| Justin | 17 | $1,975,330 | 2607 | 4.79/5.0 |
| Andrea | 35 | $1,754,602 | 3082 | 4.87/5.0 |
| Mark | 23 | $1,378,323 | 2324 | 4.83/5.0 |
| Brian | 12 | $1,069,745 | 1104 | 4.93/5.0 |
| Don | 65 | $1,019,465 | 1207 | 4.57/5.0 |
| Paramount | 30 | $764,927 | 1712 | 4.67/5.0 |
| TraveLuxe LLC | 12 | $724,482 | 474 | 4.97/5.0 |
| Live Suites | 17 | $634,532 | 380 | 4.70/5.0 |
| Gloria | 16 | $629,780 | 2308 | 4.73/5.0 |
Analyzing the strategies of top hosts, such as their property selection, pricing, and guest communication, can offer valuable lessons for optimizing your own Airbnb operations in Cleveland.
Dive Deeper: Advanced Cleveland STR Market Data (2026)
Ready to unlock more insights? AirROI provides access to advanced metrics and comprehensive Airbnb data for Cleveland. Explore detailed analytics beyond this report to refine your investment strategy, optimize pricing, and maximize your vacation rental profits.
Explore Advanced MetricsCleveland Short-Term Rental Market Composition (2026): Property & Room Types
Room Type Distribution
Property Type Distribution
Market Composition Insights for Cleveland
- The Cleveland Airbnb market composition is heavily skewed towards Entire Home/Apt listings, which make up 85.5% of the 1,685 active rentals. This indicates strong guest preference for privacy and space.
- Looking at the property type distribution in Cleveland, Apartment/Condo properties are the most common (53.8%), reflecting the local real estate landscape.
- Houses represent a significant 42.8% portion, catering likely to families or larger groups.
- Smaller segments like others, hotel/boutique, outdoor/unique, unique stays (combined 3.3%) offer potential for unique stay experiences.
Cleveland Airbnb Room Capacity Analysis (2026): Bedroom Distribution
Distribution of Listings by Number of Bedrooms
Room Capacity Insights for Cleveland
- The dominant room capacity in Cleveland is 2 bedrooms listings, making up 33.2% of the market. This suggests a strong demand for properties suitable for couples or solo travelers.
- Together, 2 bedrooms and 1 bedroom properties represent 62.8% of the active Airbnb listings in Cleveland, indicating a high concentration in these sizes.
- A significant 22.3% of listings offer 3+ bedrooms, catering to larger groups and families seeking more space in Cleveland.
Cleveland Vacation Rental Guest Capacity Trends (2026)
Distribution of Listings by Guest Capacity
Guest Capacity Insights for Cleveland
- The most common guest capacity trend in Cleveland vacation rentals is listings accommodating 4 guests (25.4%). This suggests the primary traveler segment is likely small families or groups.
- Properties designed for 4 guests and 8+ guests dominate the Cleveland STR market, accounting for 41.2% of listings.
- 33.5% of properties accommodate 6+ guests, serving the market segment for larger families or group travel in Cleveland.
- On average, properties in Cleveland are equipped to host 4.1 guests.
Cleveland Airbnb Booking Patterns (2026): Available vs. Booked Days
Available Days Distribution
Booked Days Distribution
Booking Pattern Insights for Cleveland
- The most common availability pattern in Cleveland falls within the 271-366 days range, representing 42% of listings. This suggests many properties have significant open periods on their calendars.
- Approximately 76.1% of listings show high availability (181+ days open annually), indicating potential for increased bookings or specific owner usage patterns.
- For booked days, the 91-180 days range is most frequent in Cleveland (34.9%), reflecting common guest stay durations or potential owner blocking patterns.
- A notable 24.9% of properties secure long booking periods (181+ days booked per year), highlighting successful long-term rental strategies or significant owner usage.
Cleveland Airbnb Minimum Stay Requirements Analysis
Distribution of Listings by Minimum Night Requirement
1 Night
419 listings
24.9% of total
2 Nights
325 listings
19.3% of total
3 Nights
106 listings
6.3% of total
4-6 Nights
93 listings
5.5% of total
7-29 Nights
152 listings
9% of total
30+ Nights
590 listings
35% of total
Key Insights
- The most prevalent minimum stay requirement in Cleveland is 30+ Nights, adopted by 35% of listings. This highlights the market's preference for longer commitments.
- A significant segment (35%) caters to monthly stays (30+ nights) in Cleveland, pointing to opportunities in the extended-stay market.
Recommendations
- Align with the market by considering a 30+ Nights minimum stay, as 35% of Cleveland hosts use this setting.
- If feasible, allowing 1-night stays, especially midweek or during low season, could capture last-minute bookings, as only 24.9% currently do.
- Explore offering discounts for stays of 30+ nights to attract the 35% of the market seeking extended stays.
- Adjust minimum nights based on seasonality – potentially shorter during low season and longer during peak demand periods in Cleveland.
Cleveland Airbnb Cancellation Policy Trends Analysis (2026)
Limited
12 listings
0.7% of total
Super Strict 60 Days
49 listings
2.9% of total
Super Strict 30 Days
6 listings
0.4% of total
Flexible
336 listings
20% of total
Moderate
384 listings
22.8% of total
Firm
538 listings
32% of total
Strict
357 listings
21.2% of total
Cancellation Policy Insights for Cleveland
- The prevailing Airbnb cancellation policy trend in Cleveland is Firm, used by 32% of listings.
- A majority (53.2%) of hosts in Cleveland utilize Firm or Strict policies, indicating a market where hosts prioritize booking security.
Recommendations for Hosts
- Consider adopting a Firm policy to align with the 32% market standard in Cleveland.
- Regularly review your cancellation policy against competitors and market demand shifts in Cleveland.
Cleveland STR Booking Lead Time Analysis (2026)
Average Booking Lead Time by Month
Booking Lead Time Insights for Cleveland
- The overall average booking lead time for vacation rentals in Cleveland is 31 days.
- Guests book furthest in advance for stays during August (average 55 days), likely coinciding with peak travel demand or local events.
- The shortest booking windows occur for stays in February (average 17 days), indicating more last-minute travel plans during this time.
- Seasonally, Summer (41 days avg.) sees the longest lead times, while Winter (23 days avg.) has the shortest, reflecting typical travel planning cycles.
Recommendations for Hosts
- Use the overall average lead time (31 days) as a baseline for your pricing and availability strategy in Cleveland.
- For August stays, consider implementing length-of-stay discounts or slightly higher rates for bookings made less than 55 days out to capitalize on advance planning.
- Target marketing efforts for the Summer season well in advance (at least 41 days) to capture early planners.
- Monitor your own booking lead times against these Cleveland averages to identify opportunities for dynamic pricing adjustments.
Popular & Essential Airbnb Amenities in Cleveland (2026)
Amenity Prevalence
Amenity Insights for Cleveland
- Essential amenities in Cleveland that guests expect include: Wifi, Smoke alarm, Kitchen, Air conditioning, Heating. Lacking these (any) could significantly impact bookings.
- Popular amenities like TV, Carbon monoxide alarm, Hot water are common but not universal. Offering these can provide a competitive edge.
Recommendations for Hosts
- Ensure your listing includes all essential amenities for Cleveland: Wifi, Smoke alarm, Kitchen, Air conditioning, Heating.
- Prioritize adding missing essentials: Wifi, Smoke alarm, Kitchen, Air conditioning, Heating.
- Consider adding popular differentiators like TV or Carbon monoxide alarm to increase appeal.
- Highlight unique or less common amenities you offer (e.g., hot tub, dedicated workspace, EV charger) in your listing description and photos.
- Regularly check competitor amenities in Cleveland to stay competitive.
Cleveland Airbnb Guest Demographics & Profile Analysis (2026)
Guest Profile Summary for Cleveland
- The typical guest profile for Airbnb in Cleveland consists of primarily domestic travelers (94%), often arriving from nearby Cleveland, typically belonging to the Post-2000s (Gen Z/Alpha) group (50%), primarily speaking English or Spanish.
- Domestic travelers account for 93.8% of guests.
- Key international markets include United States (93.8%) and Canada (2.1%).
- Top languages spoken are English (72.9%) followed by Spanish (11%).
- A significant demographic segment is the Post-2000s (Gen Z/Alpha) group, representing 50% of guests.
Recommendations for Hosts
- Target domestic marketing efforts towards travelers from Cleveland and Columbus.
- Tailor amenities and listing descriptions to appeal to the dominant Post-2000s (Gen Z/Alpha) demographic (e.g., highlight fast WiFi, smart home features, local guides).
- Highlight unique local experiences or amenities relevant to the primary guest profile.
- Consider seasonal promotions aligned with peak travel times for key origin markets.
Nearby Short-Term Rental Market Comparison
How does the Cleveland Airbnb market stack up against its neighbors? Compare key performance metrics like average monthly revenue, ADR, and occupancy rates in surrounding areas to understand the broader regional STR landscape.
| Market | Active Properties | Monthly Revenue | Daily Rate | Avg. Occupancy |
|---|---|---|---|---|
| Huron Township | 17 | $5,053 | $484.21 | 40% |
| Berlin Township | 11 | $5,023 | $386.97 | 46% |
| Marblehead | 12 | $4,522 | $595.67 | 39% |
| Chagrin Falls | 21 | $4,142 | $273.89 | 49% |
| Peninsula | 15 | $4,081 | $321.10 | 51% |
| Huron | 127 | $3,854 | $378.44 | 41% |
| Genoa Township | 12 | $3,790 | $344.44 | 43% |
| Sewickley | 14 | $3,774 | $230.59 | 59% |
| Harrison Township | 28 | $3,639 | $303.29 | 45% |
| Worthington Township | 29 | $3,601 | $318.62 | 37% |