Cambridge Airbnb Market Analysis 2026: Short Term Rental Data & Vacation Rental Statistics in Ohio, United States
Is Airbnb profitable in Cambridge in 2026? Explore comprehensive Airbnb analytics for Cambridge, Ohio, United States to uncover income potential. This 2026 STR market report for Cambridge, based on AirROI data from February 2025 to January 2026, reveals key trends in the niche market of 26 active listings.
Whether you're considering an Airbnb investment in Cambridge, optimizing your existing vacation rental, or exploring rental arbitrage opportunities, understanding the Cambridge Airbnb data is crucial. Leveraging the low regulation environment is key to maximizing your short term rental income potential. Let's dive into the specifics.
Key Cambridge Airbnb Performance Metrics Overview
Monthly Airbnb Revenue Variations & Income Potential in Cambridge (2026)
Understanding the monthly revenue variations for Airbnb listings in Cambridge is key to maximizing your short term rental income potential. Seasonality significantly impacts earnings. Our analysis, based on data from the past 12 months, shows that the peak revenue month for STRs in Cambridge is typically December, while February often presents the lowest earnings, highlighting opportunities for strategic pricing adjustments during shoulder and low seasons. Explore the typical Airbnb income in Cambridge across different performance tiers:
- Best-in-class properties (Top 10%) achieve $4,404+ monthly, often utilizing dynamic pricing and superior guest experiences.
- Strong performing properties (Top 25%) earn $2,592 or more, indicating effective management and desirable locations/amenities.
- Typical properties (Median) generate around $745 per month, representing the average market performance.
- Entry-level properties (Bottom 25%) see earnings around $339, often with potential for optimization.
Average Monthly Airbnb Earnings Trend in Cambridge
Cambridge Airbnb Occupancy Rate Trends (2026)
Maximize your bookings by understanding the Cambridge STR occupancy trends. Seasonal demand shifts significantly influence how often properties are booked. Typically, Novembersees the highest demand (peak season occupancy), while February experiences the lowest (low season). Effective strategies, like adjusting minimum stays or offering promotions, can boost occupancy during slower periods. Here's how different property tiers perform in Cambridge:
- Best-in-class properties (Top 10%) achieve 58%+ occupancy, indicating high desirability and potentially optimized availability.
- Strong performing properties (Top 25%) maintain 43% or higher occupancy, suggesting good market fit and guest satisfaction.
- Typical properties (Median) have an occupancy rate around 14%.
- Entry-level properties (Bottom 25%) average 7% occupancy, potentially facing higher vacancy.
Average Monthly Occupancy Rate Trend in Cambridge
Average Daily Rate (ADR) Airbnb Trends in Cambridge (2026)
Effective short term rental pricing strategy in Cambridge involves understanding monthly ADR fluctuations. The Average Daily Rate (ADR) for Airbnb in Cambridge typically peaks in August and dips lowest during January. Leveraging Airbnb dynamic pricing tools or strategies based on this seasonality can significantly boost revenue. Here's a look at the typical nightly rates achieved:
- Best-in-class properties (Top 10%) command rates of $267+ per night, often due to premium features or locations.
- Strong performing properties (Top 25%) achieve nightly rates of $160 or more.
- Typical properties (Median) charge around $135 per night.
- Entry-level properties (Bottom 25%) earn around $107 per night.
Average Daily Rate (ADR) Trend by Month in Cambridge
Get Live Cambridge Market Intelligence 👇

Explore Real-time Analytics
Airbnb Seasonality Analysis & Trends in Cambridge (2026)
Peak Season (December, November, October)
- Revenue averages $2,501 per month
- Occupancy rates average 35.6%
- Daily rates average $150
Shoulder Season
- Revenue averages $1,530 per month
- Occupancy maintains around 25.7%
- Daily rates hold near $157
Low Season (February, April, August)
- Revenue drops to average $1,117 per month
- Occupancy decreases to average 19.2%
- Daily rates adjust to average $161
Seasonality Insights for Cambridge
- The Airbnb seasonality in Cambridge shows highly seasonal trends requiring careful strategy. While the sections above show seasonal averages, it's also insightful to look at the extremes:
- During the high season, the absolute peak month showcases Cambridge's highest earning potential, with monthly revenues capable of climbing to $2,695, occupancy reaching a high of 38.7%, and ADRs peaking at $169.
- Conversely, the slowest single month of the year, typically falling within the low season, marks the market's lowest point. In this month, revenue might dip to $811, occupancy could drop to 13.4%, and ADRs may adjust down to $147.
- Understanding both the seasonal averages and these monthly peaks and troughs in revenue, occupancy, and ADR is crucial for maximizing your Airbnb profit potential in Cambridge.
Seasonal Strategies for Maximizing Profit
- Peak Season: Maximize revenue through premium pricing and potentially longer minimum stays. Ensure high availability.
- Low Season: Offer competitive pricing, special promotions (e.g., extended stay discounts), and flexible cancellation policies. Target off-season travelers like remote workers or budget-conscious guests.
- Shoulder Seasons: Implement dynamic pricing that balances peak and low rates. Target weekend travelers or specific events. Offer slightly more flexible terms than peak season.
- Regularly analyze your own performance against these Cambridge seasonality benchmarks and adjust your pricing and availability strategy accordingly.
Best Areas for Airbnb Investment in Cambridge (2026)
Exploring the top neighborhoods for short-term rentals in Cambridge? This section highlights key areas, outlining why they are attractive for hosts and guests, along with notable local attractions. Consider these locations based on your target guest profile and investment strategy.
| Neighborhood / Area | Why Host Here? (Target Guests & Appeal) | Key Attractions & Landmarks |
|---|---|---|
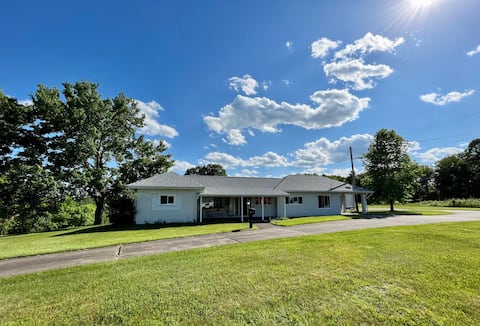
| Downtown Cambridge | The heart of Cambridge, offering easy access to shops, restaurants, and local attractions. Great for guests wanting to explore the city's cultural and historical sites. | Cambridge Main Street, Guernsey County Courthouse, The Pritchard Laughlin Civic Center, Cambridge Performing Arts Centre, Local shops and eateries |
| Salt Fork State Park | A nature lover's paradise with ample recreational opportunities. Perfect for outdoor enthusiasts looking for a peaceful getaway and access to hiking, fishing, and camping. | Salt Fork Lake, Salt Fork Lodge, Hiking trails, Wildlife viewing, Fishing spots |
| Historic Cambridge | Known for its rich history and preserved architecture, this area attracts visitors interested in history and culture, including antique shops and local museums. | The National Museum of Cambridge Glass, John and Annie Glenn Historic Site, Lilly Chapel, Historic homes, Antique shops |
| East Cambridge | A quieter residential area with charm and accessibility to parks and local dining. Family-friendly and suited for longer stays. | Cambridge City Park, Harmar Park, Local diners and shops, Community events, Playgrounds |
| Cambridge Golf Club Area | Ideal for those interested in golfing and relaxing in a serene environment. Popular among guests seeking leisure activities and green spaces. | Cambridge Country Club, Golf courses, Nature trails, Scenic landscapes, Local wildlife |
| Northwood Park | A family-oriented neighborhood with spacious parks and local activities. Suitable for families and groups looking for a suburban feel while visiting the city. | Northwood Park, Playgrounds, Family-friendly restaurants, Walking trails, Community events |
| Senecaville Lake | A beautiful destination for water activities and camping. Attracts visitors interested in fishing, boating, and enjoying nature. | Senecaville Lake Marina, Boating access, Fishing spots, Swimming areas, Camping facilities |
| Salt Fork Lodge and Conference Center | A prime spot for accommodating guests attending events or seeking a resort experience. Offers comfort and amenities in a tranquil setting. | Salt Fork Lodge, Conference facilities, Outdoor activities, Dining options, Local entertainment |
Understanding Airbnb License Requirements & STR Laws in Cambridge (2026)
While Cambridge, Ohio, United States currently shows low STR regulations, specific Airbnb license requirements might still exist or change. Always verify the latest short term rental regulations and Airbnb license requirements directly with local government authorities for Cambridge to ensure full compliance before hosting.
(Source: AirROI data, 2026, finding no licensed listings among those analyzed)
Top Performing Airbnb Properties in Cambridge (2026)
Benchmark your potential! Explore examples of top-performing Airbnb properties in Cambridgebased on Trailing Twelve Month (TTM) revenue. Analyze their characteristics, revenue, occupancy rate, and ADR to understand what drives success in this market.

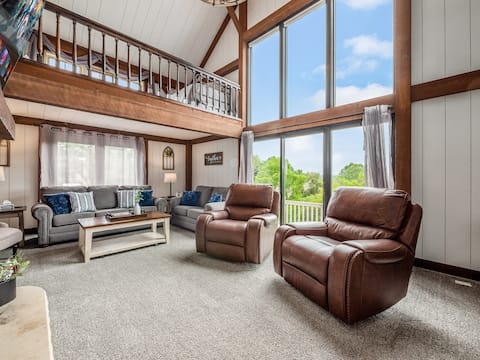
Comfy family cabin, gathering/quiet space, hot tub
Entire Place • 4 bedrooms

Peaceful Pines Lodge, Hot Tub, Wi-Fi, Pets, Stalls
Entire Place • 2 bedrooms
3BR Country Escape (sleeps 6), tree-lined 3 acres
Entire Place • 3 bedrooms

Quiet Comfy 3bdr house
Entire Place • 3 bedrooms
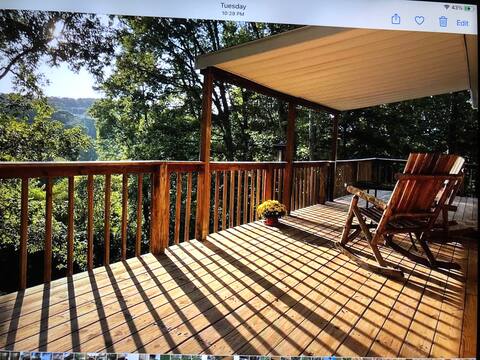
Peaceful 3 bedroom cabin with breathtaking views.
Entire Place • 3 bedrooms
Spacious Home*Hot Tub*Minutes to AEP & Wilds
Entire Place • 4 bedrooms
Note: Performance varies based on location, size, amenities, seasonality, and management quality. Data reflects the past 12 months.
Top Performing Airbnb Hosts in Cambridge (2026)
Learn from the best! This table showcases top-performing Airbnb hosts in Cambridge based on the number of properties managed and estimated total revenue over the past year. Analyze their scale and performance metrics.
| Host Name | Properties | Grossing Revenue | Stay Reviews | Avg Rating |
|---|---|---|---|---|
| Gregory | 1 | $47,509 | 52 | 5.00/5.0 |
| Kelly | 1 | $46,153 | 19 | 4.79/5.0 |
| Cindy | 1 | $44,038 | 79 | 4.78/5.0 |
| Allyson | 17 | $25,091 | 274 | 4.66/5.0 |
| Gilbert | 1 | $19,936 | 105 | 4.90/5.0 |
| Kelly | 1 | $18,359 | 216 | 4.71/5.0 |
| Brian | 1 | $13,975 | 71 | 4.97/5.0 |
| Dan Titko | 1 | $6,046 | 6 | 5.00/5.0 |
| Carol | 2 | $4,889 | 71 | 4.83/5.0 |
Analyzing the strategies of top hosts, such as their property selection, pricing, and guest communication, can offer valuable lessons for optimizing your own Airbnb operations in Cambridge.
Dive Deeper: Advanced Cambridge STR Market Data (2026)
Ready to unlock more insights? AirROI provides access to advanced metrics and comprehensive Airbnb data for Cambridge. Explore detailed analytics beyond this report to refine your investment strategy, optimize pricing, and maximize your vacation rental profits.
Explore Advanced MetricsCambridge Short-Term Rental Market Composition (2026): Property & Room Types
Room Type Distribution
Property Type Distribution
Market Composition Insights for Cambridge
- The Cambridge Airbnb market composition is heavily skewed towards Entire Home/Apt listings, which make up 100% of the 26 active rentals. This indicates strong guest preference for privacy and space.
- Looking at the property type distribution in Cambridge, Outdoor/Unique properties are the most common (73.1%), reflecting the local real estate landscape.
- Houses represent a significant 15.4% portion, catering likely to families or larger groups.
Cambridge Airbnb Room Capacity Analysis (2026): Bedroom Distribution
Distribution of Listings by Number of Bedrooms
Room Capacity Insights for Cambridge
- The dominant room capacity in Cambridge is 1 bedroom listings, making up 69.2% of the market. This suggests a strong demand for properties suitable for couples or solo travelers.
- Together, 1 bedroom and 2 bedrooms properties represent 80.7% of the active Airbnb listings in Cambridge, indicating a high concentration in these sizes.
- With over half the market (69.2%) consisting of studios or 1-bedroom units, Cambridge is particularly well-suited for individuals or couples.
Cambridge Vacation Rental Guest Capacity Trends (2026)
Distribution of Listings by Guest Capacity
Guest Capacity Insights for Cambridge
- The most common guest capacity trend in Cambridge vacation rentals is listings accommodating 2 guests (65.4%). This suggests the primary traveler segment is likely couples or solo travelers.
- Properties designed for 2 guests and 7 guests dominate the Cambridge STR market, accounting for 73.1% of listings.
- A significant 65.4% of listings cater specifically to 1-2 guests, highlighting strong demand from couples and solo travelers in Cambridge.
- 23.1% of properties accommodate 6+ guests, serving the market segment for larger families or group travel in Cambridge.
- On average, properties in Cambridge are equipped to host 3.4 guests.
Cambridge Airbnb Booking Patterns (2026): Available vs. Booked Days
Available Days Distribution
Booked Days Distribution
Booking Pattern Insights for Cambridge
- The most common availability pattern in Cambridge falls within the 271-366 days range, representing 80.8% of listings. This suggests many properties have significant open periods on their calendars.
- Approximately 88.5% of listings show high availability (181+ days open annually), indicating potential for increased bookings or specific owner usage patterns.
- For booked days, the 1-30 days range is most frequent in Cambridge (76.9%), reflecting common guest stay durations or potential owner blocking patterns.
- A notable 11.5% of properties secure long booking periods (181+ days booked per year), highlighting successful long-term rental strategies or significant owner usage.
Cambridge Airbnb Minimum Stay Requirements Analysis
Distribution of Listings by Minimum Night Requirement
1 Night
21 listings
80.8% of total
2 Nights
3 listings
11.5% of total
30+ Nights
2 listings
7.7% of total
Key Insights
- The most prevalent minimum stay requirement in Cambridge is 1 Night, adopted by 80.8% of listings. This highlights the market's preference for shorter, flexible bookings.
- A strong majority (92.3%) of the Cambridge Airbnb data shows acceptance of very short stays (1-2 nights), indicating a dynamic, high-turnover market.
Recommendations
- Align with the market by considering a 1 Night minimum stay, as 80.8% of Cambridge hosts use this setting.
- Explore offering discounts for stays of 30+ nights to attract the 7.7% of the market seeking extended stays.
- Adjust minimum nights based on seasonality – potentially shorter during low season and longer during peak demand periods in Cambridge.
Cambridge Airbnb Cancellation Policy Trends Analysis (2026)
Flexible
3 listings
11.5% of total
Moderate
3 listings
11.5% of total
Firm
3 listings
11.5% of total
Strict
17 listings
65.4% of total
Cancellation Policy Insights for Cambridge
- The prevailing Airbnb cancellation policy trend in Cambridge is Strict, used by 65.4% of listings.
- A majority (76.9%) of hosts in Cambridge utilize Firm or Strict policies, indicating a market where hosts prioritize booking security.
Recommendations for Hosts
- Consider adopting a Strict policy to align with the 65.4% market standard in Cambridge.
- With 65.4% using Strict terms, this is a viable option in Cambridge, particularly for high-value properties or during peak demand periods.
- Regularly review your cancellation policy against competitors and market demand shifts in Cambridge.
Cambridge STR Booking Lead Time Analysis (2026)
Average Booking Lead Time by Month
Booking Lead Time Insights for Cambridge
- The overall average booking lead time for vacation rentals in Cambridge is 24 days.
- Guests book furthest in advance for stays during June (average 73 days), likely coinciding with peak travel demand or local events.
- The shortest booking windows occur for stays in January (average 17 days), indicating more last-minute travel plans during this time.
- Seasonally, Summer (44 days avg.) sees the longest lead times, while Spring (22 days avg.) has the shortest, reflecting typical travel planning cycles.
Recommendations for Hosts
- Use the overall average lead time (24 days) as a baseline for your pricing and availability strategy in Cambridge.
- For June stays, consider implementing length-of-stay discounts or slightly higher rates for bookings made less than 73 days out to capitalize on advance planning.
- Target marketing efforts for the Summer season well in advance (at least 44 days) to capture early planners.
- Monitor your own booking lead times against these Cambridge averages to identify opportunities for dynamic pricing adjustments.
Popular & Essential Airbnb Amenities in Cambridge (2026)
Amenity Prevalence
Amenity Insights for Cambridge
- Essential amenities in Cambridge that guests expect include: Air conditioning, Free parking on premises, Heating, Smoke alarm. Lacking these (any) could significantly impact bookings.
- Popular amenities like Fire extinguisher, Fire pit, First aid kit are common but not universal. Offering these can provide a competitive edge.
- Warning: Wifi is not universally provided but is considered essential globally. Ensure reliable Wifi is offered.
Recommendations for Hosts
- Ensure your listing includes all essential amenities for Cambridge: Air conditioning, Free parking on premises, Heating, Smoke alarm.
- Prioritize adding missing essentials: Smoke alarm.
- Consider adding popular differentiators like Fire extinguisher or Fire pit to increase appeal.
- Highlight unique or less common amenities you offer (e.g., hot tub, dedicated workspace, EV charger) in your listing description and photos.
- Regularly check competitor amenities in Cambridge to stay competitive.
Cambridge Airbnb Guest Demographics & Profile Analysis (2026)
Guest Profile Summary for Cambridge
- The typical guest profile for Airbnb in Cambridge consists of primarily domestic travelers (99%), often arriving from nearby Cleveland, typically belonging to the Post-2000s (Gen Z/Alpha) group (50%), primarily speaking English or Spanish.
- Domestic travelers account for 98.7% of guests.
- Key international markets include United States (98.7%) and Mexico (1.3%).
- Top languages spoken are English (86.1%) followed by Spanish (8.3%).
- A significant demographic segment is the Post-2000s (Gen Z/Alpha) group, representing 50% of guests.
Recommendations for Hosts
- Target domestic marketing efforts towards travelers from Cleveland and Columbus.
- Tailor amenities and listing descriptions to appeal to the dominant Post-2000s (Gen Z/Alpha) demographic (e.g., highlight fast WiFi, smart home features, local guides).
- Highlight unique local experiences or amenities relevant to the primary guest profile.
- Consider seasonal promotions aligned with peak travel times for key origin markets.
Nearby Short-Term Rental Market Comparison
How does the Cambridge Airbnb market stack up against its neighbors? Compare key performance metrics like average monthly revenue, ADR, and occupancy rates in surrounding areas to understand the broader regional STR landscape.
| Market | Active Properties | Monthly Revenue | Daily Rate | Avg. Occupancy |
|---|---|---|---|---|
| Sugar Grove | 16 | $6,172 | $489.99 | 43% |
| Creola | 18 | $5,899 | $403.00 | 53% |
| Hocking County | 11 | $5,712 | $508.21 | 49% |
| Rockbridge | 229 | $5,257 | $400.48 | 46% |
| Huron Township | 17 | $5,053 | $484.21 | 40% |
| Berlin Township | 11 | $5,023 | $386.97 | 46% |
| Logan | 688 | $4,907 | $388.67 | 45% |
| Berne Township | 15 | $4,897 | $490.66 | 37% |
| Swan Township | 111 | $4,727 | $334.40 | 49% |
| South Bloomingville | 129 | $4,565 | $312.34 | 48% |