Berea Airbnb Market Analysis 2026: Short Term Rental Data & Vacation Rental Statistics in Ohio, United States
Is Airbnb profitable in Berea in 2026? Explore comprehensive Airbnb analytics for Berea, Ohio, United States to uncover income potential. This 2026 STR market report for Berea, based on AirROI data from February 2025 to January 2026, reveals key trends in the niche market of 39 active listings.
Whether you're considering an Airbnb investment in Berea, optimizing your existing vacation rental, or exploring rental arbitrage opportunities, understanding the Berea Airbnb data is crucial. Leveraging the low regulation environment is key to maximizing your short term rental income potential. Let's dive into the specifics.
Key Berea Airbnb Performance Metrics Overview
Monthly Airbnb Revenue Variations & Income Potential in Berea (2026)
Understanding the monthly revenue variations for Airbnb listings in Berea is key to maximizing your short term rental income potential. Seasonality significantly impacts earnings. Our analysis, based on data from the past 12 months, shows that the peak revenue month for STRs in Berea is typically July, while January often presents the lowest earnings, highlighting opportunities for strategic pricing adjustments during shoulder and low seasons. Explore the typical Airbnb income in Berea across different performance tiers:
- Best-in-class properties (Top 10%) achieve $5,947+ monthly, often utilizing dynamic pricing and superior guest experiences.
- Strong performing properties (Top 25%) earn $3,909 or more, indicating effective management and desirable locations/amenities.
- Typical properties (Median) generate around $2,284 per month, representing the average market performance.
- Entry-level properties (Bottom 25%) see earnings around $1,274, often with potential for optimization.
Average Monthly Airbnb Earnings Trend in Berea
Berea Airbnb Occupancy Rate Trends (2026)
Maximize your bookings by understanding the Berea STR occupancy trends. Seasonal demand shifts significantly influence how often properties are booked. Typically, Junesees the highest demand (peak season occupancy), while January experiences the lowest (low season). Effective strategies, like adjusting minimum stays or offering promotions, can boost occupancy during slower periods. Here's how different property tiers perform in Berea:
- Best-in-class properties (Top 10%) achieve 81%+ occupancy, indicating high desirability and potentially optimized availability.
- Strong performing properties (Top 25%) maintain 63% or higher occupancy, suggesting good market fit and guest satisfaction.
- Typical properties (Median) have an occupancy rate around 47%.
- Entry-level properties (Bottom 25%) average 27% occupancy, potentially facing higher vacancy.
Average Monthly Occupancy Rate Trend in Berea
Average Daily Rate (ADR) Airbnb Trends in Berea (2026)
Effective short term rental pricing strategy in Berea involves understanding monthly ADR fluctuations. The Average Daily Rate (ADR) for Airbnb in Berea typically peaks in September and dips lowest during February. Leveraging Airbnb dynamic pricing tools or strategies based on this seasonality can significantly boost revenue. Here's a look at the typical nightly rates achieved:
- Best-in-class properties (Top 10%) command rates of $319+ per night, often due to premium features or locations.
- Strong performing properties (Top 25%) achieve nightly rates of $232 or more.
- Typical properties (Median) charge around $162 per night.
- Entry-level properties (Bottom 25%) earn around $99 per night.
Average Daily Rate (ADR) Trend by Month in Berea
Get Live Berea Market Intelligence 👇

Explore Real-time Analytics
Airbnb Seasonality Analysis & Trends in Berea (2026)
Peak Season (July, June, August)
- Revenue averages $3,558 per month
- Occupancy rates average 56.0%
- Daily rates average $191
Shoulder Season
- Revenue averages $2,998 per month
- Occupancy maintains around 48.3%
- Daily rates hold near $179
Low Season (January, February, April)
- Revenue drops to average $1,792 per month
- Occupancy decreases to average 35.5%
- Daily rates adjust to average $161
Seasonality Insights for Berea
- The Airbnb seasonality in Berea shows highly seasonal trends requiring careful strategy. While the sections above show seasonal averages, it's also insightful to look at the extremes:
- During the high season, the absolute peak month showcases Berea's highest earning potential, with monthly revenues capable of climbing to $3,668, occupancy reaching a high of 57.7%, and ADRs peaking at $195.
- Conversely, the slowest single month of the year, typically falling within the low season, marks the market's lowest point. In this month, revenue might dip to $1,440, occupancy could drop to 30.0%, and ADRs may adjust down to $158.
- Understanding both the seasonal averages and these monthly peaks and troughs in revenue, occupancy, and ADR is crucial for maximizing your Airbnb profit potential in Berea.
Seasonal Strategies for Maximizing Profit
- Peak Season: Maximize revenue through premium pricing and potentially longer minimum stays. Ensure high availability.
- Low Season: Offer competitive pricing, special promotions (e.g., extended stay discounts), and flexible cancellation policies. Target off-season travelers like remote workers or budget-conscious guests.
- Shoulder Seasons: Implement dynamic pricing that balances peak and low rates. Target weekend travelers or specific events. Offer slightly more flexible terms than peak season.
- Regularly analyze your own performance against these Berea seasonality benchmarks and adjust your pricing and availability strategy accordingly.
Best Areas for Airbnb Investment in Berea (2026)
Exploring the top neighborhoods for short-term rentals in Berea? This section highlights key areas, outlining why they are attractive for hosts and guests, along with notable local attractions. Consider these locations based on your target guest profile and investment strategy.
| Neighborhood / Area | Why Host Here? (Target Guests & Appeal) | Key Attractions & Landmarks |
|---|---|---|
| Berea Downtown | The heart of Berea, featuring local shops, restaurants, and cultural venues. It's a charming area that attracts visitors seeking a small-town feel with easy access to amenities and events like the Berea Arts Fest. | Berea Branch Library, Berea's Historical Society and Depot, Cleveland Metroparks, Berea Arts Fest, Berea Market Days |
| Berea Triangle | This area offers a mix of residential and business spaces and is close to the beautiful Berea Commons and parks. It attracts families and travelers looking for a peaceful and community-oriented neighborhood. | Berea Commons, Cozy coffee shops, Local eateries, Berea Music Festival, Berea Fair |
| Berea Parkside | Set near the scenic parks, this neighborhood is ideal for outdoor enthusiasts and families looking for Airbnb options with family-friendly activities and outdoor experiences. | Berea Recreation Center, Berea Golf Course, Lake Isaac, Trails in the Cleveland Metroparks, Berea Skate Park |
| Berea Arts District | A vibrant area known for its artistic community, galleries, and studios. This attracts tourists interested in arts and culture, especially during events like art walks and local exhibitions. | Berea Fine Arts Club, Art galleries, The Berea Arts Festival, Local artisan shops, The Craft and Artisan Marketplace |
| South Rocky River Drive | This neighborhood is a hidden gem known for its charming homes and proximity to nature. Ideal for visitors seeking peace and quiet while being a short drive from city attractions. | Rocky River Reservation, Nature trails, Biking paths, Horse riding trails, Fishing areas |
| Midpark Road Area | Located near major thoroughfares and shopping centers, this area is perfect for business travelers and families looking for convenient accommodations close to services and entertainment. | Southpark Mall, Grocery stores and shopping centers, Easy access to I-71, Movie theaters, Local restaurants |
| Berea College | The campus of Berea College attracts visitors for its historic buildings and cultural events, making it a prime location for hosting guests attending lectures, workshops, and performances. | Berea College Campus, Berea College Farm, Pioneer Craft Center, Local theater productions, Cultural workshops |
| Westwood Park | A lovely residential area with a strong community vibe. It appeals to families and long-term renters seeking a quiet neighborhood with access to parks and schools. | Westwood Park, Elementary schools nearby, Family-friendly neighborhoods, Community events, Local parks |
Understanding Airbnb License Requirements & STR Laws in Berea (2026)
While Berea, Ohio, United States currently shows low STR regulations, specific Airbnb license requirements might still exist or change. Always verify the latest short term rental regulations and Airbnb license requirements directly with local government authorities for Berea to ensure full compliance before hosting.
(Source: AirROI data, 2026, finding no licensed listings among those analyzed)
Top Performing Airbnb Properties in Berea (2026)
Benchmark your potential! Explore examples of top-performing Airbnb properties in Bereabased on Trailing Twelve Month (TTM) revenue. Analyze their characteristics, revenue, occupancy rate, and ADR to understand what drives success in this market.
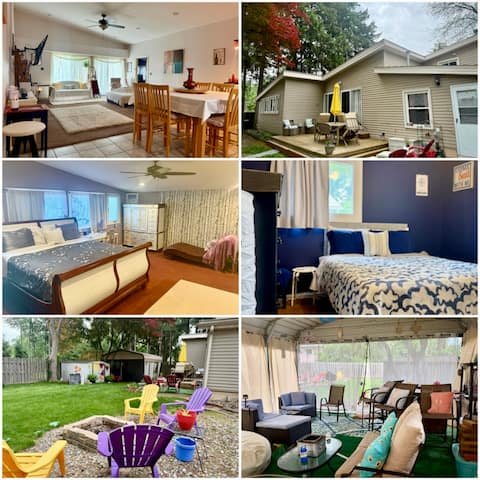
Spacious, Fenced Yard, Private, Peaceful,& Pets OK
Entire Place • 6 bedrooms
5BR Retreat! Game Room * Patio * Grill - Spacious!
Entire Place • 5 bedrooms
Large 4 BR|Close to Airport & IX Center|Sleeps10
Entire Place • 4 bedrooms
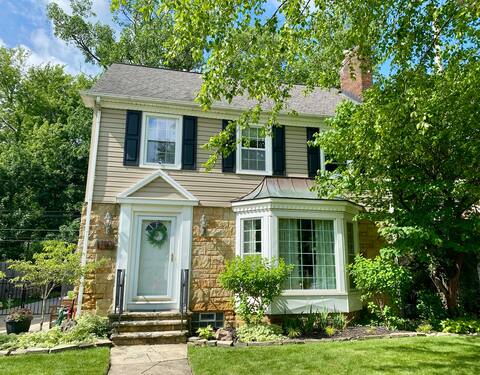
Berea Beauty close to Baldwin-Wallace University
Entire Place • 4 bedrooms

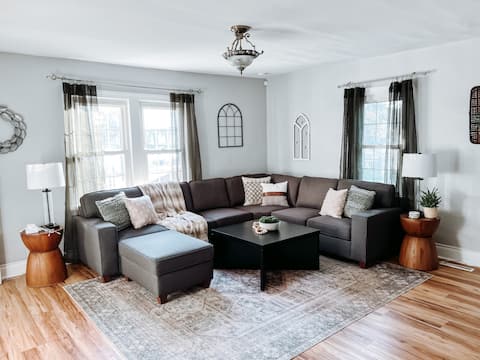
The Gameroom: 17,000 Video Games + Board Games
Entire Place • 3 bedrooms
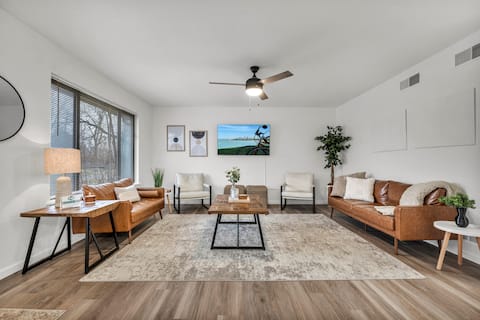
Beautiful Family Home, One level, Open Floor Plan
Entire Place • 3 bedrooms
Note: Performance varies based on location, size, amenities, seasonality, and management quality. Data reflects the past 12 months.
Top Performing Airbnb Hosts in Berea (2026)
Learn from the best! This table showcases top-performing Airbnb hosts in Berea based on the number of properties managed and estimated total revenue over the past year. Analyze their scale and performance metrics.
| Host Name | Properties | Grossing Revenue | Stay Reviews | Avg Rating |
|---|---|---|---|---|
| Jana | 6 | $233,182 | 387 | 4.92/5.0 |
| Mike And Mel | 1 | $102,219 | 73 | 4.92/5.0 |
| Michelle | 3 | $77,167 | 866 | 4.83/5.0 |
| HomeHop | 1 | $67,263 | 104 | 4.88/5.0 |
| Kristen | 2 | $59,753 | 98 | 4.43/5.0 |
| Rebecca | 1 | $54,544 | 113 | 4.98/5.0 |
| David | 1 | $50,145 | 221 | 4.81/5.0 |
| Mary | 1 | $42,341 | 110 | 4.98/5.0 |
| Bettina | 1 | $38,037 | 320 | 4.98/5.0 |
| Sara | 1 | $35,210 | 239 | 4.96/5.0 |
Analyzing the strategies of top hosts, such as their property selection, pricing, and guest communication, can offer valuable lessons for optimizing your own Airbnb operations in Berea.
Dive Deeper: Advanced Berea STR Market Data (2026)
Ready to unlock more insights? AirROI provides access to advanced metrics and comprehensive Airbnb data for Berea. Explore detailed analytics beyond this report to refine your investment strategy, optimize pricing, and maximize your vacation rental profits.
Explore Advanced MetricsBerea Short-Term Rental Market Composition (2026): Property & Room Types
Room Type Distribution
Property Type Distribution
Market Composition Insights for Berea
- The Berea Airbnb market composition is heavily skewed towards Entire Home/Apt listings, which make up 82.1% of the 39 active rentals. This indicates strong guest preference for privacy and space.
- Looking at the property type distribution in Berea, House properties are the most common (79.5%), reflecting the local real estate landscape.
- Houses represent a significant 79.5% portion, catering likely to families or larger groups.
- Smaller segments like outdoor/unique (combined 2.6%) offer potential for unique stay experiences.
Berea Airbnb Room Capacity Analysis (2026): Bedroom Distribution
Distribution of Listings by Number of Bedrooms
Room Capacity Insights for Berea
- The dominant room capacity in Berea is 2 bedrooms listings, making up 25.6% of the market. This suggests a strong demand for properties suitable for couples or solo travelers.
- Together, 2 bedrooms and 3 bedrooms properties represent 48.7% of the active Airbnb listings in Berea, indicating a high concentration in these sizes.
- A significant 51.3% of listings offer 3+ bedrooms, catering to larger groups and families seeking more space in Berea.
Berea Vacation Rental Guest Capacity Trends (2026)
Distribution of Listings by Guest Capacity
Guest Capacity Insights for Berea
- The most common guest capacity trend in Berea vacation rentals is listings accommodating 8+ guests (41%). This suggests the primary traveler segment is likely larger groups.
- Properties designed for 8+ guests and 4 guests dominate the Berea STR market, accounting for 61.5% of listings.
- 53.8% of properties accommodate 6+ guests, serving the market segment for larger families or group travel in Berea.
- On average, properties in Berea are equipped to host 5.2 guests.
Berea Airbnb Booking Patterns (2026): Available vs. Booked Days
Available Days Distribution
Booked Days Distribution
Booking Pattern Insights for Berea
- The most common availability pattern in Berea falls within the 181-270 days range, representing 48.7% of listings. This suggests many properties have significant open periods on their calendars.
- Approximately 71.8% of listings show high availability (181+ days open annually), indicating potential for increased bookings or specific owner usage patterns.
- For booked days, the 91-180 days range is most frequent in Berea (46.2%), reflecting common guest stay durations or potential owner blocking patterns.
- A notable 30.8% of properties secure long booking periods (181+ days booked per year), highlighting successful long-term rental strategies or significant owner usage.
Berea Airbnb Minimum Stay Requirements Analysis
Distribution of Listings by Minimum Night Requirement
1 Night
14 listings
35.9% of total
2 Nights
9 listings
23.1% of total
3 Nights
2 listings
5.1% of total
4-6 Nights
2 listings
5.1% of total
7-29 Nights
1 listings
2.6% of total
30+ Nights
11 listings
28.2% of total
Key Insights
- The most prevalent minimum stay requirement in Berea is 1 Night, adopted by 35.9% of listings. This highlights the market's preference for shorter, flexible bookings.
- A significant segment (28.2%) caters to monthly stays (30+ nights) in Berea, pointing to opportunities in the extended-stay market.
Recommendations
- Align with the market by considering a 1 Night minimum stay, as 35.9% of Berea hosts use this setting.
- Explore offering discounts for stays of 30+ nights to attract the 28.2% of the market seeking extended stays.
- Adjust minimum nights based on seasonality – potentially shorter during low season and longer during peak demand periods in Berea.
Berea Airbnb Cancellation Policy Trends Analysis (2026)
Super Strict 60 Days
1 listings
2.6% of total
Flexible
6 listings
15.4% of total
Moderate
14 listings
35.9% of total
Firm
12 listings
30.8% of total
Strict
6 listings
15.4% of total
Cancellation Policy Insights for Berea
- The prevailing Airbnb cancellation policy trend in Berea is Moderate, used by 35.9% of listings.
- There's a relatively balanced mix between guest-friendly (51.3%) and stricter (46.2%) policies, offering choices for different guest needs.
Recommendations for Hosts
- Consider adopting a Moderate policy to align with the 35.9% market standard in Berea.
- Regularly review your cancellation policy against competitors and market demand shifts in Berea.
Berea STR Booking Lead Time Analysis (2026)
Average Booking Lead Time by Month
Booking Lead Time Insights for Berea
- The overall average booking lead time for vacation rentals in Berea is 33 days.
- Guests book furthest in advance for stays during June (average 42 days), likely coinciding with peak travel demand or local events.
- The shortest booking windows occur for stays in February (average 13 days), indicating more last-minute travel plans during this time.
- Seasonally, Summer (42 days avg.) sees the longest lead times, while Winter (26 days avg.) has the shortest, reflecting typical travel planning cycles.
Recommendations for Hosts
- Use the overall average lead time (33 days) as a baseline for your pricing and availability strategy in Berea.
- During February, focus on last-minute booking availability and promotions, as guests book with very short notice (13 days avg.).
- Target marketing efforts for the Summer season well in advance (at least 42 days) to capture early planners.
- Monitor your own booking lead times against these Berea averages to identify opportunities for dynamic pricing adjustments.
Popular & Essential Airbnb Amenities in Berea (2026)
Amenity Prevalence
Amenity Insights for Berea
- Essential amenities in Berea that guests expect include: Smoke alarm, Wifi, Dishes and silverware, Hot water, Heating, Coffee maker. Lacking these (any) could significantly impact bookings.
- Popular amenities like Hair dryer, Carbon monoxide alarm, TV are common but not universal. Offering these can provide a competitive edge.
Recommendations for Hosts
- Ensure your listing includes all essential amenities for Berea: Smoke alarm, Wifi, Dishes and silverware, Hot water, Heating, Coffee maker.
- Prioritize adding missing essentials: Dishes and silverware, Hot water, Heating, Coffee maker.
- Consider adding popular differentiators like Hair dryer or Carbon monoxide alarm to increase appeal.
- Highlight unique or less common amenities you offer (e.g., hot tub, dedicated workspace, EV charger) in your listing description and photos.
- Regularly check competitor amenities in Berea to stay competitive.
Berea Airbnb Guest Demographics & Profile Analysis (2026)
Guest Profile Summary for Berea
- The typical guest profile for Airbnb in Berea consists of primarily domestic travelers (92%), often arriving from nearby Chicago, typically belonging to the Post-2000s (Gen Z/Alpha) group (50%), primarily speaking English or Spanish.
- Domestic travelers account for 92.4% of guests.
- Key international markets include United States (92.4%) and Canada (2%).
- Top languages spoken are English (73.1%) followed by Spanish (10.7%).
- A significant demographic segment is the Post-2000s (Gen Z/Alpha) group, representing 50% of guests.
Recommendations for Hosts
- Target domestic marketing efforts towards travelers from Chicago and Cleveland.
- Tailor amenities and listing descriptions to appeal to the dominant Post-2000s (Gen Z/Alpha) demographic (e.g., highlight fast WiFi, smart home features, local guides).
- Highlight unique local experiences or amenities relevant to the primary guest profile.
- Consider seasonal promotions aligned with peak travel times for key origin markets.
Nearby Short-Term Rental Market Comparison
How does the Berea Airbnb market stack up against its neighbors? Compare key performance metrics like average monthly revenue, ADR, and occupancy rates in surrounding areas to understand the broader regional STR landscape.
| Market | Active Properties | Monthly Revenue | Daily Rate | Avg. Occupancy |
|---|---|---|---|---|
| Huron Township | 17 | $5,053 | $484.21 | 40% |
| Berlin Township | 11 | $5,023 | $386.97 | 46% |
| Marblehead | 12 | $4,522 | $595.67 | 39% |
| Chagrin Falls | 21 | $4,142 | $273.89 | 49% |
| Peninsula | 15 | $4,081 | $321.10 | 51% |
| Huron | 127 | $3,854 | $378.44 | 41% |
| Genoa Township | 12 | $3,790 | $344.44 | 43% |
| Sewickley | 14 | $3,774 | $230.59 | 59% |
| Harrison Township | 28 | $3,639 | $303.29 | 45% |
| Worthington Township | 29 | $3,601 | $318.62 | 37% |