Anderson Township Airbnb Market Analysis 2025: Short Term Rental Data & Vacation Rental Statistics in Ohio, United States
Is Airbnb profitable in Anderson Township in 2025? Explore comprehensive Airbnb analytics for Anderson Township, Ohio, United States to uncover income potential. This 2025 STR market report for Anderson Township, based on AirROI data from December 2024 to November 2025, reveals key trends in the niche market of 19 active listings.
Whether you're considering an Airbnb investment in Anderson Township, optimizing your existing vacation rental, or exploring rental arbitrage opportunities, understanding the Anderson Township Airbnb data is crucial. Leveraging the low regulation environment is key to maximizing your short term rental income potential. Let's dive into the specifics.
Key Anderson Township Airbnb Performance Metrics Overview
Monthly Airbnb Revenue Variations & Income Potential in Anderson Township (2025)
Understanding the monthly revenue variations for Airbnb listings in Anderson Township is key to maximizing your short term rental income potential. Seasonality significantly impacts earnings. Our analysis, based on data from the past 12 months, shows that the peak revenue month for STRs in Anderson Township is typically July, while November often presents the lowest earnings, highlighting opportunities for strategic pricing adjustments during shoulder and low seasons. Explore the typical Airbnb income in Anderson Township across different performance tiers:
- Best-in-class properties (Top 10%) achieve $6,349+ monthly, often utilizing dynamic pricing and superior guest experiences.
- Strong performing properties (Top 25%) earn $5,048 or more, indicating effective management and desirable locations/amenities.
- Typical properties (Median) generate around $3,017 per month, representing the average market performance.
- Entry-level properties (Bottom 25%) see earnings around $1,737, often with potential for optimization.
Average Monthly Airbnb Earnings Trend in Anderson Township
Anderson Township Airbnb Occupancy Rate Trends (2025)
Maximize your bookings by understanding the Anderson Township STR occupancy trends. Seasonal demand shifts significantly influence how often properties are booked. Typically, Julysees the highest demand (peak season occupancy), while November experiences the lowest (low season). Effective strategies, like adjusting minimum stays or offering promotions, can boost occupancy during slower periods. Here's how different property tiers perform in Anderson Township:
- Best-in-class properties (Top 10%) achieve 79%+ occupancy, indicating high desirability and potentially optimized availability.
- Strong performing properties (Top 25%) maintain 64% or higher occupancy, suggesting good market fit and guest satisfaction.
- Typical properties (Median) have an occupancy rate around 48%.
- Entry-level properties (Bottom 25%) average 29% occupancy, potentially facing higher vacancy.
Average Monthly Occupancy Rate Trend in Anderson Township
Average Daily Rate (ADR) Airbnb Trends in Anderson Township (2025)
Effective short term rental pricing strategy in Anderson Township involves understanding monthly ADR fluctuations. The Average Daily Rate (ADR) for Airbnb in Anderson Township typically peaks in July and dips lowest during February. Leveraging Airbnb dynamic pricing tools or strategies based on this seasonality can significantly boost revenue. Here's a look at the typical nightly rates achieved:
- Best-in-class properties (Top 10%) command rates of $544+ per night, often due to premium features or locations.
- Strong performing properties (Top 25%) achieve nightly rates of $280 or more.
- Typical properties (Median) charge around $189 per night.
- Entry-level properties (Bottom 25%) earn around $137 per night.
Average Daily Rate (ADR) Trend by Month in Anderson Township
Get Live Anderson Township Market Intelligence 👇

Explore Real-time Analytics
Airbnb Seasonality Analysis & Trends in Anderson Township (2025)
Peak Season (July, June, August)
- Revenue averages $4,850 per month
- Occupancy rates average 58.3%
- Daily rates average $250
Shoulder Season
- Revenue averages $3,407 per month
- Occupancy maintains around 47.7%
- Daily rates hold near $224
Low Season (April, September, November)
- Revenue drops to average $2,764 per month
- Occupancy decreases to average 41.4%
- Daily rates adjust to average $234
Seasonality Insights for Anderson Township
- The Airbnb seasonality in Anderson Township shows highly seasonal trends requiring careful strategy. While the sections above show seasonal averages, it's also insightful to look at the extremes:
- During the high season, the absolute peak month showcases Anderson Township's highest earning potential, with monthly revenues capable of climbing to $5,728, occupancy reaching a high of 65.4%, and ADRs peaking at $259.
- Conversely, the slowest single month of the year, typically falling within the low season, marks the market's lowest point. In this month, revenue might dip to $2,649, occupancy could drop to 34.7%, and ADRs may adjust down to $208.
- Understanding both the seasonal averages and these monthly peaks and troughs in revenue, occupancy, and ADR is crucial for maximizing your Airbnb profit potential in Anderson Township.
Seasonal Strategies for Maximizing Profit
- Peak Season: Maximize revenue through premium pricing and potentially longer minimum stays. Ensure high availability.
- Low Season: Offer competitive pricing, special promotions (e.g., extended stay discounts), and flexible cancellation policies. Target off-season travelers like remote workers or budget-conscious guests.
- Shoulder Seasons: Implement dynamic pricing that balances peak and low rates. Target weekend travelers or specific events. Offer slightly more flexible terms than peak season.
- Regularly analyze your own performance against these Anderson Township seasonality benchmarks and adjust your pricing and availability strategy accordingly.
Best Areas for Airbnb Investment in Anderson Township (2025)
Exploring the top neighborhoods for short-term rentals in Anderson Township? This section highlights key areas, outlining why they are attractive for hosts and guests, along with notable local attractions. Consider these locations based on your target guest profile and investment strategy.
| Neighborhood / Area | Why Host Here? (Target Guests & Appeal) | Key Attractions & Landmarks |
|---|---|---|
| Anderson Towne Center | A vibrant shopping area with dining options and entertainment, ideal for families and groups visiting for leisure activities. | Anderson Towne Center, Cincinnati Nature Center, Cincinnati Zoo, Mercy Health - Anderson Hospital, Cincinnati HealthPlex, Eastgate Mall |
| East Fork State Park | A beautiful natural area offering outdoor activities like hiking, fishing, and camping, appealing to nature lovers and adventure seekers. | East Fork Lake, hiking trails, fishing spots, campground, picnic areas |
| Cincinnati Botanical Garden | A stunning landscape that attracts visitors who appreciate nature and beauty, suitable for relaxing getaways. | Cincinnati Botanical Garden, Nature trails, Gardens and plant displays, Seasonal events |
| Mt. Washington | A suburban neighborhood with a close-knit community vibe, it's great for families visiting the area for longer stays. | Local parks, Cafes and restaurants, Community events, Mt. Washington Park |
| Newtown | A charming small town atmosphere with beautiful parks, ideal for travelers looking for a peaceful retreat. | Newtown Green, Little Miami River, Community events, Local dining options |
| Oakley | A vibrant neighborhood with shops, parks, and an active nightlife, attracting young urban professionals and families alike. | Oakley Square, Cafes and Restaurants, Local parks, Community festivals |
| Hyde Park | Known for its upscale shopping and dining, Hyde Park is perfect for visitors looking for a luxurious experience in a suburban setting. | Hyde Park Plaza, Cincinnati Art Museum, Hyde Park Square, Cincinnati Observatory |
| Cincinnati Riverfront | A bustling area along the Ohio River with parks and event spaces, perfect for attracting tourists to Cincinnati's cultural offerings. | Smale Riverfront Park, Fountain Square, Cincinnati Reds and Bengals stadiums, Ohio River |
Understanding Airbnb License Requirements & STR Laws in Anderson Township (2025)
While Anderson Township, Ohio, United States currently shows low STR regulations, specific Airbnb license requirements might still exist or change. Always verify the latest short term rental regulations and Airbnb license requirements directly with local government authorities for Anderson Township to ensure full compliance before hosting.
(Source: AirROI data, 2025, based on 5% licensed listings)
Top Performing Airbnb Properties in Anderson Township (2025)
Benchmark your potential! Explore examples of top-performing Airbnb properties in Anderson Townshipbased on Trailing Twelve Month (TTM) revenue. Analyze their characteristics, revenue, occupancy rate, and ADR to understand what drives success in this market.
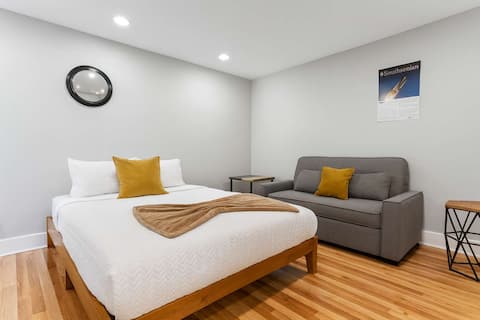
Hunley Haven Retreat
Entire Place • 6 bedrooms

NEWLY REMODELED, Quiet, Furnished 5 Bedroom House
Entire Place • 5 bedrooms
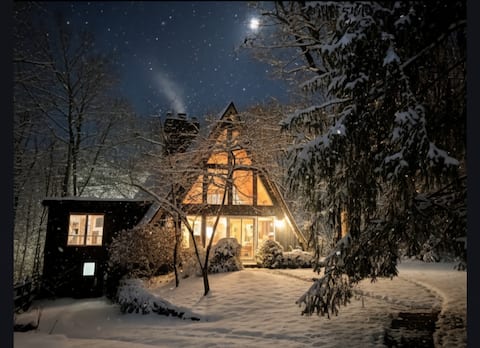
A-frame minutes to Downtown, 3 acres, dog friendly
Entire Place • 4 bedrooms
Hot Tub - Cozy 3‑Bed Cottage nr City/Parks/Events
Entire Place • 3 bedrooms

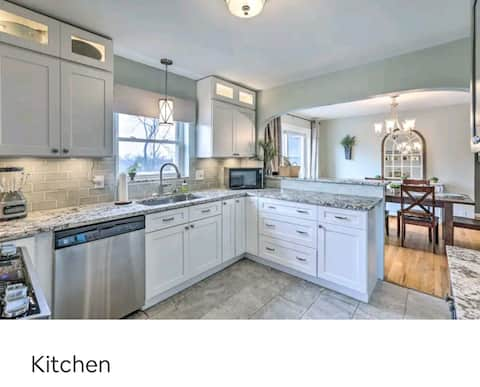
Modern Home Cincy - 3bd/2ba
Entire Place • 3 bedrooms

Modern House~Backyard~Near Downtown~Parking~Wi-Fi
Entire Place • 3 bedrooms
Note: Performance varies based on location, size, amenities, seasonality, and management quality. Data reflects the past 12 months.
Top Performing Airbnb Hosts in Anderson Township (2025)
Learn from the best! This table showcases top-performing Airbnb hosts in Anderson Township based on the number of properties managed and estimated total revenue over the past year. Analyze their scale and performance metrics.
| Host Name | Properties | Grossing Revenue | Stay Reviews | Avg Rating |
|---|---|---|---|---|
| Grand Welcome Ohio Kentucky | 1 | $81,868 | 36 | 4.89/5.0 |
| Cindy | 1 | $68,387 | 32 | 4.97/5.0 |
| Brittany | 1 | $64,641 | 100 | 4.87/5.0 |
| Rich | 1 | $62,880 | 105 | 5.00/5.0 |
| Roger | 1 | $52,844 | 75 | 4.89/5.0 |
| Stylianos | 1 | $44,645 | 145 | 4.84/5.0 |
| Ben Aicholtz | 1 | $40,074 | 27 | 4.89/5.0 |
| Carissa | 1 | $31,346 | 39 | 4.82/5.0 |
| Andrew | 1 | $30,640 | 40 | 4.90/5.0 |
| Elizabeth | 1 | $25,194 | 34 | 4.91/5.0 |
Analyzing the strategies of top hosts, such as their property selection, pricing, and guest communication, can offer valuable lessons for optimizing your own Airbnb operations in Anderson Township.
Dive Deeper: Advanced Anderson Township STR Market Data (2025)
Ready to unlock more insights? AirROI provides access to advanced metrics and comprehensive Airbnb data for Anderson Township. Explore detailed analytics beyond this report to refine your investment strategy, optimize pricing, and maximize your vacation rental profits.
Explore Advanced MetricsAnderson Township Short-Term Rental Market Composition (2025): Property & Room Types
Room Type Distribution
Property Type Distribution
Market Composition Insights for Anderson Township
- The Anderson Township Airbnb market composition is heavily skewed towards Entire Home/Apt listings, which make up 78.9% of the 19 active rentals. This indicates strong guest preference for privacy and space.
- Looking at the property type distribution in Anderson Township, House properties are the most common (89.5%), reflecting the local real estate landscape.
- Houses represent a significant 89.5% portion, catering likely to families or larger groups.
Anderson Township Airbnb Room Capacity Analysis (2025): Bedroom Distribution
Distribution of Listings by Number of Bedrooms
Room Capacity Insights for Anderson Township
- The dominant room capacity in Anderson Township is 3 bedrooms listings, making up 36.8% of the market. This suggests a strong demand for properties suitable for families or small groups.
- Together, 3 bedrooms and 1 bedroom properties represent 52.6% of the active Airbnb listings in Anderson Township, indicating a high concentration in these sizes.
- A significant 63.1% of listings offer 3+ bedrooms, catering to larger groups and families seeking more space in Anderson Township.
Anderson Township Vacation Rental Guest Capacity Trends (2025)
Distribution of Listings by Guest Capacity
Guest Capacity Insights for Anderson Township
- The most common guest capacity trend in Anderson Township vacation rentals is listings accommodating 8+ guests (36.8%). This suggests the primary traveler segment is likely larger groups.
- Properties designed for 8+ guests and 6 guests dominate the Anderson Township STR market, accounting for 57.9% of listings.
- 63.2% of properties accommodate 6+ guests, serving the market segment for larger families or group travel in Anderson Township.
- On average, properties in Anderson Township are equipped to host 5.4 guests.
Anderson Township Airbnb Booking Patterns (2025): Available vs. Booked Days
Available Days Distribution
Booked Days Distribution
Booking Pattern Insights for Anderson Township
- The most common availability pattern in Anderson Township falls within the 181-270 days range, representing 42.1% of listings. This suggests many properties have significant open periods on their calendars.
- Approximately 68.4% of listings show high availability (181+ days open annually), indicating potential for increased bookings or specific owner usage patterns.
- For booked days, the 91-180 days range is most frequent in Anderson Township (42.1%), reflecting common guest stay durations or potential owner blocking patterns.
- A notable 31.6% of properties secure long booking periods (181+ days booked per year), highlighting successful long-term rental strategies or significant owner usage.
Anderson Township Airbnb Minimum Stay Requirements Analysis
Distribution of Listings by Minimum Night Requirement
1 Night
2 listings
10.5% of total
2 Nights
7 listings
36.8% of total
3 Nights
1 listings
5.3% of total
4-6 Nights
2 listings
10.5% of total
7-29 Nights
4 listings
21.1% of total
30+ Nights
3 listings
15.8% of total
Key Insights
- The most prevalent minimum stay requirement in Anderson Township is 2 Nights, adopted by 36.8% of listings. This highlights the market's preference for shorter, flexible bookings.
- A significant segment (15.8%) caters to monthly stays (30+ nights) in Anderson Township, pointing to opportunities in the extended-stay market.
Recommendations
- Align with the market by considering a 2 Nights minimum stay, as 36.8% of Anderson Township hosts use this setting.
- If feasible, allowing 1-night stays, especially midweek or during low season, could capture last-minute bookings, as only 10.5% currently do.
- A 2-night minimum appears standard (36.8%). Consider this for weekends or peak periods.
- Explore offering discounts for stays of 30+ nights to attract the 15.8% of the market seeking extended stays.
- Adjust minimum nights based on seasonality – potentially shorter during low season and longer during peak demand periods in Anderson Township.
Anderson Township Airbnb Cancellation Policy Trends Analysis (2025)
Limited
1 listings
5.3% of total
Flexible
2 listings
10.5% of total
Moderate
5 listings
26.3% of total
Firm
8 listings
42.1% of total
Strict
3 listings
15.8% of total
Cancellation Policy Insights for Anderson Township
- The prevailing Airbnb cancellation policy trend in Anderson Township is Firm, used by 42.1% of listings.
- A majority (57.9%) of hosts in Anderson Township utilize Firm or Strict policies, indicating a market where hosts prioritize booking security.
Recommendations for Hosts
- Consider adopting a Firm policy to align with the 42.1% market standard in Anderson Township.
- Regularly review your cancellation policy against competitors and market demand shifts in Anderson Township.
Anderson Township STR Booking Lead Time Analysis (2025)
Average Booking Lead Time by Month
Booking Lead Time Insights for Anderson Township
- The overall average booking lead time for vacation rentals in Anderson Township is 63 days.
- Guests book furthest in advance for stays during November (average 88 days), likely coinciding with peak travel demand or local events.
- The shortest booking windows occur for stays in March (average 17 days), indicating more last-minute travel plans during this time.
- Seasonally, Summer (61 days avg.) sees the longest lead times, while Winter (31 days avg.) has the shortest, reflecting typical travel planning cycles.
Recommendations for Hosts
- Use the overall average lead time (63 days) as a baseline for your pricing and availability strategy in Anderson Township.
- For November stays, consider implementing length-of-stay discounts or slightly higher rates for bookings made less than 88 days out to capitalize on advance planning.
- Target marketing efforts for the Summer season well in advance (at least 61 days) to capture early planners.
- Monitor your own booking lead times against these Anderson Township averages to identify opportunities for dynamic pricing adjustments.
Popular & Essential Airbnb Amenities in Anderson Township (2025)
Amenity Prevalence
No amenities with partial availability (less than 100%) were found to display in the chart. All essential amenities might be present in all listings. Check insights below.
Amenity Insights for Anderson Township
- Essential amenities in Anderson Township that guests expect include: Dishes and silverware, Smoke alarm, TV, Heating, Hangers, Coffee maker, Microwave, Iron, Wifi, Air conditioning. Lacking these (any) could significantly impact bookings.
Recommendations for Hosts
- Ensure your listing includes all essential amenities for Anderson Township: Dishes and silverware, Smoke alarm, TV, Heating, Hangers, Coffee maker, Microwave, Iron, Wifi, Air conditioning.
- Highlight unique or less common amenities you offer (e.g., hot tub, dedicated workspace, EV charger) in your listing description and photos.
- Regularly check competitor amenities in Anderson Township to stay competitive.
Anderson Township Airbnb Guest Demographics & Profile Analysis (2025)
Guest Profile Summary for Anderson Township
- The typical guest profile for Airbnb in Anderson Township consists of primarily domestic travelers (99%), often arriving from nearby Cincinnati, typically belonging to the Post-2000s (Gen Z/Alpha) group (50%), primarily speaking English or Spanish.
- Domestic travelers account for 98.6% of guests.
- Key international markets include United States (98.6%) and United Kingdom (1.4%).
- Top languages spoken are English (85%) followed by Spanish (6.7%).
- A significant demographic segment is the Post-2000s (Gen Z/Alpha) group, representing 50% of guests.
Recommendations for Hosts
- Target domestic marketing efforts towards travelers from Cincinnati and Columbus.
- Tailor amenities and listing descriptions to appeal to the dominant Post-2000s (Gen Z/Alpha) demographic (e.g., highlight fast WiFi, smart home features, local guides).
- Highlight unique local experiences or amenities relevant to the primary guest profile.
- Consider seasonal promotions aligned with peak travel times for key origin markets.
Nearby Short-Term Rental Market Comparison
How does the Anderson Township Airbnb market stack up against its neighbors? Compare key performance metrics like average monthly revenue, ADR, and occupancy rates in surrounding areas to understand the broader regional STR landscape.
| Market | Active Properties | Monthly Revenue | Daily Rate | Avg. Occupancy |
|---|---|---|---|---|
| Crittenden | 17 | $4,491 | $280.44 | 51% |
| Lawrenceburg | 66 | $4,345 | $370.01 | 44% |
| Walton | 22 | $4,096 | $222.94 | 59% |
| Lebanon | 30 | $3,902 | $280.99 | 45% |
| Williamstown | 200 | $3,821 | $266.23 | 49% |
| Deerfield Township | 34 | $3,703 | $290.77 | 41% |
| Burlington | 18 | $3,609 | $235.11 | 47% |
| Delaware | 29 | $3,608 | $267.73 | 50% |
| Simpsonville | 20 | $3,530 | $332.61 | 43% |
| Shelbyville | 76 | $3,480 | $364.56 | 38% |