Roxbury Airbnb Market Analysis 2025: Short Term Rental Data & Vacation Rental Statistics in Northwest Hills Planning Region, United States
Is Airbnb profitable in Roxbury in 2025? Explore comprehensive Airbnb analytics for Roxbury, Northwest Hills Planning Region, United States to uncover income potential. This 2025 STR market report for Roxbury, based on AirROI data from November 2024 to October 2025, reveals key trends in the niche market of 19 active listings.
Whether you're considering an Airbnb investment in Roxbury, optimizing your existing vacation rental, or exploring rental arbitrage opportunities, understanding the Roxbury Airbnb data is crucial. Leveraging the low regulation environment is key to maximizing your short term rental income potential. Let's dive into the specifics.
Key Roxbury Airbnb Performance Metrics Overview
Monthly Airbnb Revenue Variations & Income Potential in Roxbury (2025)
Understanding the monthly revenue variations for Airbnb listings in Roxbury is key to maximizing your short term rental income potential. Seasonality significantly impacts earnings. Our analysis, based on data from the past 12 months, shows that the peak revenue month for STRs in Roxbury is typically August, while April often presents the lowest earnings, highlighting opportunities for strategic pricing adjustments during shoulder and low seasons. Explore the typical Airbnb income in Roxbury across different performance tiers:
- Best-in-class properties (Top 10%) achieve $11,123+ monthly, often utilizing dynamic pricing and superior guest experiences.
- Strong performing properties (Top 25%) earn $6,977 or more, indicating effective management and desirable locations/amenities.
- Typical properties (Median) generate around $4,138 per month, representing the average market performance.
- Entry-level properties (Bottom 25%) see earnings around $1,821, often with potential for optimization.
Average Monthly Airbnb Earnings Trend in Roxbury
Roxbury Airbnb Occupancy Rate Trends (2025)
Maximize your bookings by understanding the Roxbury STR occupancy trends. Seasonal demand shifts significantly influence how often properties are booked. Typically, Decembersees the highest demand (peak season occupancy), while June experiences the lowest (low season). Effective strategies, like adjusting minimum stays or offering promotions, can boost occupancy during slower periods. Here's how different property tiers perform in Roxbury:
- Best-in-class properties (Top 10%) achieve 83%+ occupancy, indicating high desirability and potentially optimized availability.
- Strong performing properties (Top 25%) maintain 57% or higher occupancy, suggesting good market fit and guest satisfaction.
- Typical properties (Median) have an occupancy rate around 33%.
- Entry-level properties (Bottom 25%) average 15% occupancy, potentially facing higher vacancy.
Average Monthly Occupancy Rate Trend in Roxbury
Average Daily Rate (ADR) Airbnb Trends in Roxbury (2025)
Effective short term rental pricing strategy in Roxbury involves understanding monthly ADR fluctuations. The Average Daily Rate (ADR) for Airbnb in Roxbury typically peaks in October and dips lowest during February. Leveraging Airbnb dynamic pricing tools or strategies based on this seasonality can significantly boost revenue. Here's a look at the typical nightly rates achieved:
- Best-in-class properties (Top 10%) command rates of $1,360+ per night, often due to premium features or locations.
- Strong performing properties (Top 25%) achieve nightly rates of $1,170 or more.
- Typical properties (Median) charge around $579 per night.
- Entry-level properties (Bottom 25%) earn around $299 per night.
Average Daily Rate (ADR) Trend by Month in Roxbury
Get Live Roxbury Market Intelligence 👇

Explore Real-time Analytics
Airbnb Seasonality Analysis & Trends in Roxbury (2025)
Peak Season (August, December, September)
- Revenue averages $7,797 per month
- Occupancy rates average 46.7%
- Daily rates average $768
Shoulder Season
- Revenue averages $4,898 per month
- Occupancy maintains around 38.5%
- Daily rates hold near $726
Low Season (February, April, May)
- Revenue drops to average $3,122 per month
- Occupancy decreases to average 34.5%
- Daily rates adjust to average $660
Seasonality Insights for Roxbury
- The Airbnb seasonality in Roxbury shows highly seasonal trends requiring careful strategy. While the sections above show seasonal averages, it's also insightful to look at the extremes:
- During the high season, the absolute peak month showcases Roxbury's highest earning potential, with monthly revenues capable of climbing to $9,036, occupancy reaching a high of 52.3%, and ADRs peaking at $815.
- Conversely, the slowest single month of the year, typically falling within the low season, marks the market's lowest point. In this month, revenue might dip to $2,691, occupancy could drop to 29.0%, and ADRs may adjust down to $650.
- Understanding both the seasonal averages and these monthly peaks and troughs in revenue, occupancy, and ADR is crucial for maximizing your Airbnb profit potential in Roxbury.
Seasonal Strategies for Maximizing Profit
- Peak Season: Maximize revenue through premium pricing and potentially longer minimum stays. Ensure high availability.
- Low Season: Offer competitive pricing, special promotions (e.g., extended stay discounts), and flexible cancellation policies. Target off-season travelers like remote workers or budget-conscious guests.
- Shoulder Seasons: Implement dynamic pricing that balances peak and low rates. Target weekend travelers or specific events. Offer slightly more flexible terms than peak season.
- Regularly analyze your own performance against these Roxbury seasonality benchmarks and adjust your pricing and availability strategy accordingly.
Best Areas for Airbnb Investment in Roxbury (2025)
Exploring the top neighborhoods for short-term rentals in Roxbury? This section highlights key areas, outlining why they are attractive for hosts and guests, along with notable local attractions. Consider these locations based on your target guest profile and investment strategy.
| Neighborhood / Area | Why Host Here? (Target Guests & Appeal) | Key Attractions & Landmarks |
|---|---|---|
| Dudley Square | Cultural hub of Roxbury with historical significance and a vibrant community atmosphere. It's a prime location for travelers interested in history and local culture. | The Museum of the National Center of Afro-American Artists, Roxbury Heritage State Park, Dudley Station, local shops and eateries |
| Fort Hill | Known for its scenic views and historic homes, this neighborhood appeals to those looking for a quiet retreat while still being close to the city. | Fort Hill Historic District, The Fort Hill Church, Parks and hiking trails, Close to Boston's amenities |
| Egleston Square | A diverse, bustling area with a mix of local businesses and eateries, it attracts visitors looking for authentic local experiences in Roxbury. | Egleston Square Park, local markets, various restaurants, art galleries |
| Roxbury Crossing | A key transportation hub with easy access to public transit, making it convenient for guests to explore Boston and beyond. | Roxbury Crossing subway station, local cafes, Dudley Town Common, community events |
| Jackson Square | Up-and-coming neighborhood that is undergoing rejuvenation, appealing to young visitors and investors looking for growth potential. | Jackson Square T Station, community gardens, local art installations, green spaces |
| Highland Park | Family-friendly neighborhood known for its parks and community events, ideal for family travelers or group stays. | Highland Park, local playgrounds, community events, nice residential atmosphere |
| Hyde Park Avenue | A vibrant area with a variety of dining options, shopping, and easy access to public transportation, attracting a mix of visitors. | variety of restaurants, shopping areas, close to public transit, family-friendly activities |
| Roxbury Village | A quaint neighborhood providing a local feel with easy access to urban amenities, ideal for travelers seeking a comfortable stay. | local cafes, shops, quiet streets, close to attractions and transports |
Understanding Airbnb License Requirements & STR Laws in Roxbury (2025)
While Roxbury, Northwest Hills Planning Region, United States currently shows low STR regulations, specific Airbnb license requirements might still exist or change. Always verify the latest short term rental regulations and Airbnb license requirements directly with local government authorities for Roxbury to ensure full compliance before hosting.
(Source: AirROI data, 2025, finding no licensed listings among those analyzed)
Top Performing Airbnb Properties in Roxbury (2025)
Benchmark your potential! Explore examples of top-performing Airbnb properties in Roxburybased on Trailing Twelve Month (TTM) revenue. Analyze their characteristics, revenue, occupancy rate, and ADR to understand what drives success in this market.

Bright Mid-Century Modern Retreat-90 min from NYC
Entire Place • 3 bedrooms
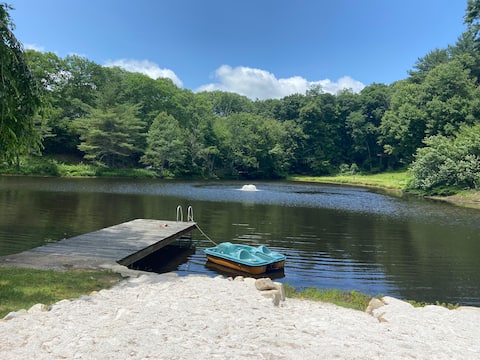
Stunning Home on 3-acre Private Pond
Entire Place • 5 bedrooms
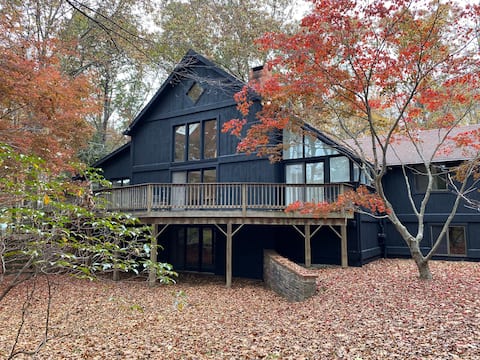
Serenity in the Roxbury Woods!
Entire Place • 3 bedrooms
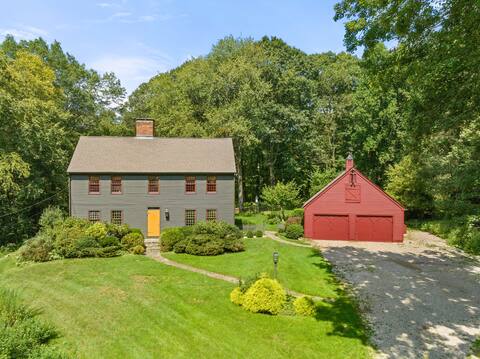
Charming Saltbox with Modern Amenities
Entire Place • 3 bedrooms

Fully Renovated Rural Barn
Entire Place • 1 bedroom

Artist's Retreat In The Woods | Five-Acre Backyard
Entire Place • 3 bedrooms
Note: Performance varies based on location, size, amenities, seasonality, and management quality. Data reflects the past 12 months.
Top Performing Airbnb Hosts in Roxbury (2025)
Learn from the best! This table showcases top-performing Airbnb hosts in Roxbury based on the number of properties managed and estimated total revenue over the past year. Analyze their scale and performance metrics.
| Host Name | Properties | Grossing Revenue | Stay Reviews | Avg Rating |
|---|---|---|---|---|
| Luiz Augusto | 1 | $100,185 | 24 | 5.00/5.0 |
| Stephen | 4 | $93,706 | 89 | 4.94/5.0 |
| Sarah | 1 | $76,876 | 3 | 5.00/5.0 |
| Daniel | 1 | $63,739 | 24 | 4.92/5.0 |
| Kevin | 1 | $46,535 | 12 | 5.00/5.0 |
| KevinMina | 1 | $46,333 | 65 | 5.00/5.0 |
| Konstantinos | 2 | $43,352 | 56 | 4.95/5.0 |
| Vicki | 1 | $39,464 | 47 | 4.91/5.0 |
| Brian | 1 | $36,251 | 61 | 4.74/5.0 |
| David | 1 | $26,170 | 14 | 4.93/5.0 |
Analyzing the strategies of top hosts, such as their property selection, pricing, and guest communication, can offer valuable lessons for optimizing your own Airbnb operations in Roxbury.
Dive Deeper: Advanced Roxbury STR Market Data (2025)
Ready to unlock more insights? AirROI provides access to advanced metrics and comprehensive Airbnb data for Roxbury. Explore detailed analytics beyond this report to refine your investment strategy, optimize pricing, and maximize your vacation rental profits.
Explore Advanced MetricsRoxbury Short-Term Rental Market Composition (2025): Property & Room Types
Room Type Distribution
Property Type Distribution
Market Composition Insights for Roxbury
- The Roxbury Airbnb market composition is heavily skewed towards Entire Home/Apt listings, which make up 94.7% of the 19 active rentals. This indicates strong guest preference for privacy and space.
- Looking at the property type distribution in Roxbury, House properties are the most common (68.4%), reflecting the local real estate landscape.
- Houses represent a significant 68.4% portion, catering likely to families or larger groups.
- The presence of 10.5% Hotel/Boutique listings indicates integration with traditional hospitality.
Roxbury Airbnb Room Capacity Analysis (2025): Bedroom Distribution
Distribution of Listings by Number of Bedrooms
Room Capacity Insights for Roxbury
- The dominant room capacity in Roxbury is 3 bedrooms listings, making up 26.3% of the market. This suggests a strong demand for properties suitable for families or small groups.
- Together, 3 bedrooms and 1 bedroom properties represent 52.6% of the active Airbnb listings in Roxbury, indicating a high concentration in these sizes.
- A significant 63.2% of listings offer 3+ bedrooms, catering to larger groups and families seeking more space in Roxbury.
Roxbury Vacation Rental Guest Capacity Trends (2025)
Distribution of Listings by Guest Capacity
Guest Capacity Insights for Roxbury
- The most common guest capacity trend in Roxbury vacation rentals is listings accommodating 8+ guests (47.4%). This suggests the primary traveler segment is likely larger groups.
- Properties designed for 8+ guests and 4 guests dominate the Roxbury STR market, accounting for 68.5% of listings.
- 52.7% of properties accommodate 6+ guests, serving the market segment for larger families or group travel in Roxbury.
- On average, properties in Roxbury are equipped to host 5.5 guests.
Roxbury Airbnb Booking Patterns (2025): Available vs. Booked Days
Available Days Distribution
Booked Days Distribution
Booking Pattern Insights for Roxbury
- The most common availability pattern in Roxbury falls within the 271-366 days range, representing 57.9% of listings. This suggests many properties have significant open periods on their calendars.
- Approximately 84.2% of listings show high availability (181+ days open annually), indicating potential for increased bookings or specific owner usage patterns.
- For booked days, the 1-30 days range is most frequent in Roxbury (42.1%), reflecting common guest stay durations or potential owner blocking patterns.
- A notable 15.8% of properties secure long booking periods (181+ days booked per year), highlighting successful long-term rental strategies or significant owner usage.
Roxbury Airbnb Minimum Stay Requirements Analysis
Distribution of Listings by Minimum Night Requirement
1 Night
1 listings
5.3% of total
2 Nights
3 listings
15.8% of total
3 Nights
1 listings
5.3% of total
4-6 Nights
4 listings
21.1% of total
7-29 Nights
4 listings
21.1% of total
30+ Nights
6 listings
31.6% of total
Key Insights
- The most prevalent minimum stay requirement in Roxbury is 30+ Nights, adopted by 31.6% of listings. This highlights the market's preference for longer commitments.
- A significant segment (31.6%) caters to monthly stays (30+ nights) in Roxbury, pointing to opportunities in the extended-stay market.
Recommendations
- Align with the market by considering a 30+ Nights minimum stay, as 31.6% of Roxbury hosts use this setting.
- If feasible, allowing 1-night stays, especially midweek or during low season, could capture last-minute bookings, as only 5.3% currently do.
- Explore offering discounts for stays of 30+ nights to attract the 31.6% of the market seeking extended stays.
- Adjust minimum nights based on seasonality – potentially shorter during low season and longer during peak demand periods in Roxbury.
Roxbury Airbnb Cancellation Policy Trends Analysis (2025)
Flexible
2 listings
11.1% of total
Moderate
3 listings
16.7% of total
Firm
8 listings
44.4% of total
Strict
5 listings
27.8% of total
Cancellation Policy Insights for Roxbury
- The prevailing Airbnb cancellation policy trend in Roxbury is Firm, used by 44.4% of listings.
- A majority (72.2%) of hosts in Roxbury utilize Firm or Strict policies, indicating a market where hosts prioritize booking security.
Recommendations for Hosts
- Consider adopting a Firm policy to align with the 44.4% market standard in Roxbury.
- Regularly review your cancellation policy against competitors and market demand shifts in Roxbury.
Roxbury STR Booking Lead Time Analysis (2025)
Average Booking Lead Time by Month
Booking Lead Time Insights for Roxbury
- The overall average booking lead time for vacation rentals in Roxbury is 31 days.
- Guests book furthest in advance for stays during August (average 59 days), likely coinciding with peak travel demand or local events.
- The shortest booking windows occur for stays in March (average 6 days), indicating more last-minute travel plans during this time.
- Seasonally, Summer (48 days avg.) sees the longest lead times, while Winter (15 days avg.) has the shortest, reflecting typical travel planning cycles.
Recommendations for Hosts
- Use the overall average lead time (31 days) as a baseline for your pricing and availability strategy in Roxbury.
- For August stays, consider implementing length-of-stay discounts or slightly higher rates for bookings made less than 59 days out to capitalize on advance planning.
- During March, focus on last-minute booking availability and promotions, as guests book with very short notice (6 days avg.).
- Target marketing efforts for the Summer season well in advance (at least 48 days) to capture early planners.
- Monitor your own booking lead times against these Roxbury averages to identify opportunities for dynamic pricing adjustments.
Popular & Essential Airbnb Amenities in Roxbury (2025)
Amenity Prevalence
Amenity Insights for Roxbury
- Essential amenities in Roxbury that guests expect include: Wifi, Heating, Carbon monoxide alarm, Smoke alarm, Free parking on premises. Lacking these (any) could significantly impact bookings.
- Popular amenities like Kitchen, Air conditioning, Hot water are common but not universal. Offering these can provide a competitive edge.
Recommendations for Hosts
- Ensure your listing includes all essential amenities for Roxbury: Wifi, Heating, Carbon monoxide alarm, Smoke alarm, Free parking on premises.
- Consider adding popular differentiators like Kitchen or Air conditioning to increase appeal.
- Highlight unique or less common amenities you offer (e.g., hot tub, dedicated workspace, EV charger) in your listing description and photos.
- Regularly check competitor amenities in Roxbury to stay competitive.
Roxbury Airbnb Guest Demographics & Profile Analysis (2025)
Guest Profile Summary for Roxbury
- The typical guest profile for Airbnb in Roxbury consists of primarily domestic travelers (87%), often arriving from nearby New York, typically belonging to the Post-2000s (Gen Z/Alpha) group (50%), primarily speaking English or Chinese.
- Domestic travelers account for 86.7% of guests.
- Key international markets include United States (86.7%) and China (4.8%).
- Top languages spoken are English (56.8%) followed by Chinese (11.4%).
- A significant demographic segment is the Post-2000s (Gen Z/Alpha) group, representing 50% of guests.
Recommendations for Hosts
- Target domestic marketing efforts towards travelers from New York and Beijing.
- Tailor amenities and listing descriptions to appeal to the dominant Post-2000s (Gen Z/Alpha) demographic (e.g., highlight fast WiFi, smart home features, local guides).
- Highlight unique local experiences or amenities relevant to the primary guest profile.
- Consider seasonal promotions aligned with peak travel times for key origin markets.
Nearby Short-Term Rental Market Comparison
How does the Roxbury Airbnb market stack up against its neighbors? Compare key performance metrics like average monthly revenue, ADR, and occupancy rates in surrounding areas to understand the broader regional STR landscape.
| Market | Active Properties | Monthly Revenue | Daily Rate | Avg. Occupancy |
|---|---|---|---|---|
| Town of Ancram | 22 | $5,888 | $536.80 | 37% |
| Town of East Hampton | 1,356 | $5,671 | $1004.73 | 33% |
| Spring Lake Heights | 17 | $5,658 | $715.85 | 39% |
| Town of Kingston | 12 | $5,654 | $468.91 | 46% |
| Frankford Township | 13 | $5,633 | $569.39 | 41% |
| Winchendon | 12 | $5,537 | $388.94 | 45% |
| Town of Southampton | 1,231 | $5,480 | $1006.76 | 32% |
| Town of Stillwater | 54 | $5,366 | $588.19 | 41% |
| Town of Monroe | 25 | $5,109 | $688.36 | 36% |
| Hunter | 30 | $5,107 | $609.69 | 33% |