Winston-Salem Airbnb Market Analysis 2026: Short Term Rental Data & Vacation Rental Statistics in North Carolina, United States
Is Airbnb profitable in Winston-Salem in 2026? Explore comprehensive Airbnb analytics for Winston-Salem, North Carolina, United States to uncover income potential. This 2026 STR market report for Winston-Salem, based on AirROI data from February 2025 to January 2026, reveals key trends in the market of 685 active listings.
Whether you're considering an Airbnb investment in Winston-Salem, optimizing your existing vacation rental, or exploring rental arbitrage opportunities, understanding the Winston-Salem Airbnb data is crucial. Leveraging the low regulation environment is key to maximizing your short term rental income potential. Let's dive into the specifics.
Key Winston-Salem Airbnb Performance Metrics Overview
Monthly Airbnb Revenue Variations & Income Potential in Winston-Salem (2026)
Understanding the monthly revenue variations for Airbnb listings in Winston-Salem is key to maximizing your short term rental income potential. Seasonality significantly impacts earnings. Our analysis, based on data from the past 12 months, shows that the peak revenue month for STRs in Winston-Salem is typically October, while January often presents the lowest earnings, highlighting opportunities for strategic pricing adjustments during shoulder and low seasons. Explore the typical Airbnb income in Winston-Salem across different performance tiers:
- Best-in-class properties (Top 10%) achieve $4,279+ monthly, often utilizing dynamic pricing and superior guest experiences.
- Strong performing properties (Top 25%) earn $2,905 or more, indicating effective management and desirable locations/amenities.
- Typical properties (Median) generate around $1,774 per month, representing the average market performance.
- Entry-level properties (Bottom 25%) see earnings around $896, often with potential for optimization.
Average Monthly Airbnb Earnings Trend in Winston-Salem
Winston-Salem Airbnb Occupancy Rate Trends (2026)
Maximize your bookings by understanding the Winston-Salem STR occupancy trends. Seasonal demand shifts significantly influence how often properties are booked. Typically, Aprilsees the highest demand (peak season occupancy), while January experiences the lowest (low season). Effective strategies, like adjusting minimum stays or offering promotions, can boost occupancy during slower periods. Here's how different property tiers perform in Winston-Salem:
- Best-in-class properties (Top 10%) achieve 80%+ occupancy, indicating high desirability and potentially optimized availability.
- Strong performing properties (Top 25%) maintain 62% or higher occupancy, suggesting good market fit and guest satisfaction.
- Typical properties (Median) have an occupancy rate around 41%.
- Entry-level properties (Bottom 25%) average 22% occupancy, potentially facing higher vacancy.
Average Monthly Occupancy Rate Trend in Winston-Salem
Average Daily Rate (ADR) Airbnb Trends in Winston-Salem (2026)
Effective short term rental pricing strategy in Winston-Salem involves understanding monthly ADR fluctuations. The Average Daily Rate (ADR) for Airbnb in Winston-Salem typically peaks in October and dips lowest during February. Leveraging Airbnb dynamic pricing tools or strategies based on this seasonality can significantly boost revenue. Here's a look at the typical nightly rates achieved:
- Best-in-class properties (Top 10%) command rates of $276+ per night, often due to premium features or locations.
- Strong performing properties (Top 25%) achieve nightly rates of $187 or more.
- Typical properties (Median) charge around $131 per night.
- Entry-level properties (Bottom 25%) earn around $90 per night.
Average Daily Rate (ADR) Trend by Month in Winston-Salem
Get Live Winston-Salem Market Intelligence 👇

Explore Real-time Analytics
Airbnb Seasonality Analysis & Trends in Winston-Salem (2026)
Peak Season (October, July, May)
- Revenue averages $2,565 per month
- Occupancy rates average 45.9%
- Daily rates average $168
Shoulder Season
- Revenue averages $2,271 per month
- Occupancy maintains around 43.7%
- Daily rates hold near $166
Low Season (January, February, March)
- Revenue drops to average $1,752 per month
- Occupancy decreases to average 40.3%
- Daily rates adjust to average $151
Seasonality Insights for Winston-Salem
- The Airbnb seasonality in Winston-Salem shows moderate seasonality with distinct peak and low periods. While the sections above show seasonal averages, it's also insightful to look at the extremes:
- During the high season, the absolute peak month showcases Winston-Salem's highest earning potential, with monthly revenues capable of climbing to $2,854, occupancy reaching a high of 48.3%, and ADRs peaking at $189.
- Conversely, the slowest single month of the year, typically falling within the low season, marks the market's lowest point. In this month, revenue might dip to $1,660, occupancy could drop to 32.7%, and ADRs may adjust down to $141.
- Understanding both the seasonal averages and these monthly peaks and troughs in revenue, occupancy, and ADR is crucial for maximizing your Airbnb profit potential in Winston-Salem.
Seasonal Strategies for Maximizing Profit
- Peak Season: Maximize revenue through premium pricing and potentially longer minimum stays. Ensure high availability.
- Low Season: Offer competitive pricing, special promotions (e.g., extended stay discounts), and flexible cancellation policies. Target off-season travelers like remote workers or budget-conscious guests.
- Shoulder Seasons: Implement dynamic pricing that balances peak and low rates. Target weekend travelers or specific events. Offer slightly more flexible terms than peak season.
- Regularly analyze your own performance against these Winston-Salem seasonality benchmarks and adjust your pricing and availability strategy accordingly.
Best Areas for Airbnb Investment in Winston-Salem (2026)
Exploring the top neighborhoods for short-term rentals in Winston-Salem? This section highlights key areas, outlining why they are attractive for hosts and guests, along with notable local attractions. Consider these locations based on your target guest profile and investment strategy.
| Neighborhood / Area | Why Host Here? (Target Guests & Appeal) | Key Attractions & Landmarks |
|---|---|---|
| Downtown Winston-Salem | The heart of the city featuring a mix of historic sites and modern attractions. This area is great for tourists looking to explore local culture, dining, and entertainment. | Old Salem Museums & Gardens, Winston-Salem Dash, The Stevens Center, Nissen Park, The Milton Rhodes Center for the Arts |
| West End | A charming neighborhood with historic homes and a vibrant arts scene. It's popular among those seeking a quaint atmosphere with easy access to downtown amenities. | Historic West End, Kaleideum North, Reynolda Gardens, Forsyth County Public Library, West End Arts District |
| Reynolda Village | An upscale area with shops and restaurants, renowned for its historic buildings and gardens. Attracts visitors interested in rural charm and local culture. | Reynolda House Museum, Reynolda Gardens, Village Park, Local eateries and shops, Art galleries |
| Bailey Park | A developing area with a focus on community events, parks, and outdoor activities. Ideal for guests looking for a modern, active lifestyle. | Bailey Park, The Innovation Quarter, local breweries, food trucks, outdoor events |
| Southwest Winston-Salem | Known for its parks and family-friendly atmosphere. A good choice for families visiting the city. | Tanglewood Park, Polo Field, Hanes Mall, Wake Forest University, Salem Lake |
| North Winston-Salem | Quiet suburban feel, appealing for those wanting to escape the bustle of the city. It's ideal for longer stays and family accommodation. | Virtual Reality parks, Transitional neighborhoods, Parks and recreation facilities, Local shopping centers, Nature trails |
| Pilot Mountain | Just outside Winston-Salem, this area offers beautiful natural scenery and outdoor activities. Perfect for those looking to explore nature while staying close to the city. | Pilot Mountain State Park, Hiking trails, Picnic areas, Climbing locations, Scenic overlooks |
| Clemmons | A suburban area with access to various amenities, making it suitable for families and those looking for quieter accommodation with good access to Winston-Salem. | Hanes Mall nearby, Local dining options, Parks, Clemmons Park, Family-friendly activities |
Understanding Airbnb License Requirements & STR Laws in Winston-Salem (2026)
While Winston-Salem, North Carolina, United States currently shows low STR regulations, specific Airbnb license requirements might still exist or change. Always verify the latest short term rental regulations and Airbnb license requirements directly with local government authorities for Winston-Salem to ensure full compliance before hosting.
(Source: AirROI data, 2026, based on 0% licensed listings)
Top Performing Airbnb Properties in Winston-Salem (2026)
Benchmark your potential! Explore examples of top-performing Airbnb properties in Winston-Salembased on Trailing Twelve Month (TTM) revenue. Analyze their characteristics, revenue, occupancy rate, and ADR to understand what drives success in this market.
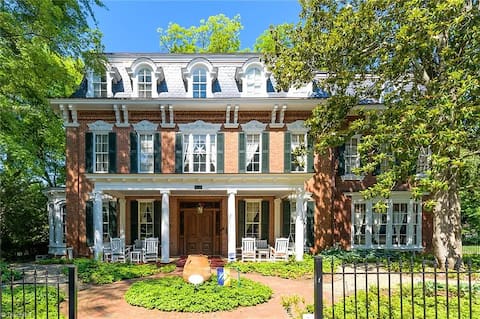
Stunning Mansion on Main St in Historic Old Salem
Entire Place • 4 bedrooms
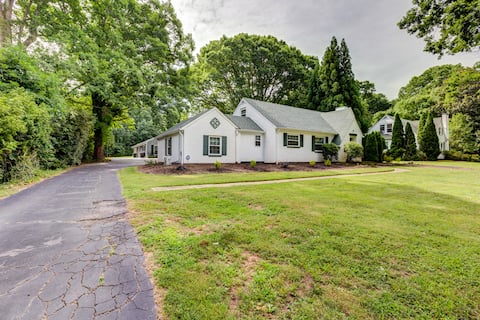
2 Houses | Sleeps 16 | 6 BRs/5 Baths w/ Level 2 EV
Entire Place • 6 bedrooms
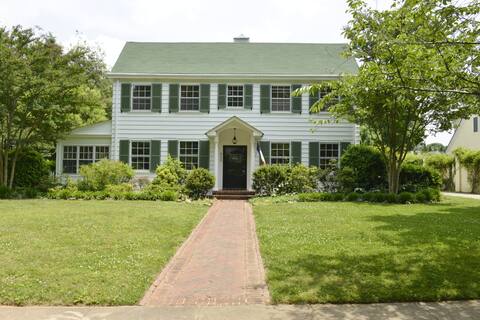
Wake Forest Graduation
Entire Place • 6 bedrooms

Premium Retreat close to WFU w/ Lvl 2 EV Charger
Entire Place • 3 bedrooms
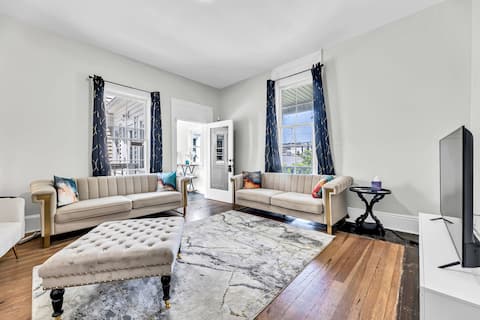
Downtown Homerun!
Entire Place • 9 bedrooms

Boutique Hotel-like Home on 20 acre, 10 Guestrooms
Entire Place • 10 bedrooms
Note: Performance varies based on location, size, amenities, seasonality, and management quality. Data reflects the past 12 months.
Top Performing Airbnb Hosts in Winston-Salem (2026)
Learn from the best! This table showcases top-performing Airbnb hosts in Winston-Salem based on the number of properties managed and estimated total revenue over the past year. Analyze their scale and performance metrics.
| Host Name | Properties | Grossing Revenue | Stay Reviews | Avg Rating |
|---|---|---|---|---|
| Daniel | 11 | $584,036 | 515 | 4.94/5.0 |
| Eric | 16 | $424,692 | 1551 | 4.88/5.0 |
| Martin | 15 | $345,655 | 433 | 4.65/5.0 |
| Emiliya | 13 | $321,879 | 1135 | 4.90/5.0 |
| Bradley Scott | 11 | $311,865 | 262 | 4.62/5.0 |
| Morenito | 31 | $259,934 | 1437 | 4.73/5.0 |
| Jeff | 8 | $225,916 | 635 | 4.90/5.0 |
| Evolve | 7 | $159,250 | 107 | 4.83/5.0 |
| Kay | 3 | $154,685 | 263 | 4.97/5.0 |
| Lindsey | 8 | $153,206 | 296 | 4.90/5.0 |
Analyzing the strategies of top hosts, such as their property selection, pricing, and guest communication, can offer valuable lessons for optimizing your own Airbnb operations in Winston-Salem.
Dive Deeper: Advanced Winston-Salem STR Market Data (2026)
Ready to unlock more insights? AirROI provides access to advanced metrics and comprehensive Airbnb data for Winston-Salem. Explore detailed analytics beyond this report to refine your investment strategy, optimize pricing, and maximize your vacation rental profits.
Explore Advanced MetricsWinston-Salem Short-Term Rental Market Composition (2026): Property & Room Types
Room Type Distribution
Property Type Distribution
Market Composition Insights for Winston-Salem
- The Winston-Salem Airbnb market composition is heavily skewed towards Entire Home/Apt listings, which make up 85% of the 685 active rentals. This indicates strong guest preference for privacy and space.
- Looking at the property type distribution in Winston-Salem, House properties are the most common (69.3%), reflecting the local real estate landscape.
- Houses represent a significant 69.3% portion, catering likely to families or larger groups.
- Smaller segments like others, hotel/boutique, outdoor/unique (combined 8.8%) offer potential for unique stay experiences.
Winston-Salem Airbnb Room Capacity Analysis (2026): Bedroom Distribution
Distribution of Listings by Number of Bedrooms
Room Capacity Insights for Winston-Salem
- The dominant room capacity in Winston-Salem is 1 bedroom listings, making up 27.3% of the market. This suggests a strong demand for properties suitable for couples or solo travelers.
- Together, 1 bedroom and 2 bedrooms properties represent 53.0% of the active Airbnb listings in Winston-Salem, indicating a high concentration in these sizes.
- A significant 34.8% of listings offer 3+ bedrooms, catering to larger groups and families seeking more space in Winston-Salem.
Winston-Salem Vacation Rental Guest Capacity Trends (2026)
Distribution of Listings by Guest Capacity
Guest Capacity Insights for Winston-Salem
- The most common guest capacity trend in Winston-Salem vacation rentals is listings accommodating 4 guests (20.9%). This suggests the primary traveler segment is likely small families or groups.
- Properties designed for 4 guests and 6 guests dominate the Winston-Salem STR market, accounting for 40.0% of listings.
- 36.8% of properties accommodate 6+ guests, serving the market segment for larger families or group travel in Winston-Salem.
- On average, properties in Winston-Salem are equipped to host 4.2 guests.
Winston-Salem Airbnb Booking Patterns (2026): Available vs. Booked Days
Available Days Distribution
Booked Days Distribution
Booking Pattern Insights for Winston-Salem
- The most common availability pattern in Winston-Salem falls within the 271-366 days range, representing 41.6% of listings. This suggests many properties have significant open periods on their calendars.
- Approximately 79.7% of listings show high availability (181+ days open annually), indicating potential for increased bookings or specific owner usage patterns.
- For booked days, the 91-180 days range is most frequent in Winston-Salem (38.7%), reflecting common guest stay durations or potential owner blocking patterns.
- A notable 22.0% of properties secure long booking periods (181+ days booked per year), highlighting successful long-term rental strategies or significant owner usage.
Winston-Salem Airbnb Minimum Stay Requirements Analysis
Distribution of Listings by Minimum Night Requirement
1 Night
154 listings
22.5% of total
2 Nights
211 listings
30.8% of total
3 Nights
39 listings
5.7% of total
4-6 Nights
28 listings
4.1% of total
7-29 Nights
59 listings
8.6% of total
30+ Nights
194 listings
28.3% of total
Key Insights
- The most prevalent minimum stay requirement in Winston-Salem is 2 Nights, adopted by 30.8% of listings. This highlights the market's preference for shorter, flexible bookings.
- A significant segment (28.3%) caters to monthly stays (30+ nights) in Winston-Salem, pointing to opportunities in the extended-stay market.
Recommendations
- Align with the market by considering a 2 Nights minimum stay, as 30.8% of Winston-Salem hosts use this setting.
- If feasible, allowing 1-night stays, especially midweek or during low season, could capture last-minute bookings, as only 22.5% currently do.
- Explore offering discounts for stays of 30+ nights to attract the 28.3% of the market seeking extended stays.
- Adjust minimum nights based on seasonality – potentially shorter during low season and longer during peak demand periods in Winston-Salem.
Winston-Salem Airbnb Cancellation Policy Trends Analysis (2026)
Super Strict 30 Days
22 listings
3.2% of total
Super Strict 60 Days
12 listings
1.8% of total
Limited
21 listings
3.1% of total
Flexible
149 listings
21.8% of total
Moderate
194 listings
28.3% of total
Firm
208 listings
30.4% of total
Strict
79 listings
11.5% of total
Cancellation Policy Insights for Winston-Salem
- The prevailing Airbnb cancellation policy trend in Winston-Salem is Firm, used by 30.4% of listings.
- There's a relatively balanced mix between guest-friendly (50.1%) and stricter (41.9%) policies, offering choices for different guest needs.
Recommendations for Hosts
- Consider adopting a Firm policy to align with the 30.4% market standard in Winston-Salem.
- Using a Strict policy might deter some guests, as only 11.5% of listings use it. Evaluate if potential revenue protection outweighs possible lower booking rates.
- Regularly review your cancellation policy against competitors and market demand shifts in Winston-Salem.
Winston-Salem STR Booking Lead Time Analysis (2026)
Average Booking Lead Time by Month
Booking Lead Time Insights for Winston-Salem
- The overall average booking lead time for vacation rentals in Winston-Salem is 40 days.
- Guests book furthest in advance for stays during May (average 68 days), likely coinciding with peak travel demand or local events.
- The shortest booking windows occur for stays in February (average 22 days), indicating more last-minute travel plans during this time.
- Seasonally, Fall (56 days avg.) sees the longest lead times, while Winter (24 days avg.) has the shortest, reflecting typical travel planning cycles.
Recommendations for Hosts
- Use the overall average lead time (40 days) as a baseline for your pricing and availability strategy in Winston-Salem.
- For May stays, consider implementing length-of-stay discounts or slightly higher rates for bookings made less than 68 days out to capitalize on advance planning.
- Target marketing efforts for the Fall season well in advance (at least 56 days) to capture early planners.
- Monitor your own booking lead times against these Winston-Salem averages to identify opportunities for dynamic pricing adjustments.
Popular & Essential Airbnb Amenities in Winston-Salem (2026)
Amenity Prevalence
Amenity Insights for Winston-Salem
- Essential amenities in Winston-Salem that guests expect include: Air conditioning, Wifi, Smoke alarm, TV, Heating. Lacking these (any) could significantly impact bookings.
- Popular amenities like Free parking on premises, Hot water, Kitchen are common but not universal. Offering these can provide a competitive edge.
Recommendations for Hosts
- Ensure your listing includes all essential amenities for Winston-Salem: Air conditioning, Wifi, Smoke alarm, TV, Heating.
- Prioritize adding missing essentials: Air conditioning, Wifi, Smoke alarm, TV, Heating.
- Consider adding popular differentiators like Free parking on premises or Hot water to increase appeal.
- Highlight unique or less common amenities you offer (e.g., hot tub, dedicated workspace, EV charger) in your listing description and photos.
- Regularly check competitor amenities in Winston-Salem to stay competitive.
Winston-Salem Airbnb Guest Demographics & Profile Analysis (2026)
Guest Profile Summary for Winston-Salem
- The typical guest profile for Airbnb in Winston-Salem consists of primarily domestic travelers (97%), often arriving from nearby Winston-Salem, typically belonging to the Post-2000s (Gen Z/Alpha) group (50%), primarily speaking English or Spanish.
- Domestic travelers account for 96.6% of guests.
- Key international markets include United States (96.6%) and DC (0.8%).
- Top languages spoken are English (74.8%) followed by Spanish (12.2%).
- A significant demographic segment is the Post-2000s (Gen Z/Alpha) group, representing 50% of guests.
Recommendations for Hosts
- Target domestic marketing efforts towards travelers from Winston-Salem and Raleigh.
- Tailor amenities and listing descriptions to appeal to the dominant Post-2000s (Gen Z/Alpha) demographic (e.g., highlight fast WiFi, smart home features, local guides).
- Highlight unique local experiences or amenities relevant to the primary guest profile.
- Consider seasonal promotions aligned with peak travel times for key origin markets.
Nearby Short-Term Rental Market Comparison
How does the Winston-Salem Airbnb market stack up against its neighbors? Compare key performance metrics like average monthly revenue, ADR, and occupancy rates in surrounding areas to understand the broader regional STR landscape.
| Market | Active Properties | Monthly Revenue | Daily Rate | Avg. Occupancy |
|---|---|---|---|---|
| Denver | 109 | $6,309 | $590.96 | 45% |
| Catawba | 16 | $6,093 | $582.49 | 38% |
| Mooresville | 369 | $5,702 | $559.93 | 42% |
| Penhook | 18 | $5,675 | $678.75 | 37% |
| Sherrills Ford | 107 | $5,615 | $547.26 | 41% |
| Troutman | 49 | $5,587 | $467.90 | 42% |
| Lake Norman of Catawba | 51 | $4,972 | $513.30 | 43% |
| Rockbridge Baths | 12 | $4,144 | $298.35 | 45% |
| Blacksburg | 297 | $4,116 | $509.14 | 40% |
| Goodview | 31 | $3,953 | $401.90 | 44% |