Westfield Airbnb Market Analysis 2026: Short Term Rental Data & Vacation Rental Statistics in North Carolina, United States
Is Airbnb profitable in Westfield in 2026? Explore comprehensive Airbnb analytics for Westfield, North Carolina, United States to uncover income potential. This 2026 STR market report for Westfield, based on AirROI data from February 2025 to January 2026, reveals key trends in the niche market of 21 active listings.
Whether you're considering an Airbnb investment in Westfield, optimizing your existing vacation rental, or exploring rental arbitrage opportunities, understanding the Westfield Airbnb data is crucial. Leveraging the low regulation environment is key to maximizing your short term rental income potential. Let's dive into the specifics.
Key Westfield Airbnb Performance Metrics Overview
Monthly Airbnb Revenue Variations & Income Potential in Westfield (2026)
Understanding the monthly revenue variations for Airbnb listings in Westfield is key to maximizing your short term rental income potential. Seasonality significantly impacts earnings. Our analysis, based on data from the past 12 months, shows that the peak revenue month for STRs in Westfield is typically October, while January often presents the lowest earnings, highlighting opportunities for strategic pricing adjustments during shoulder and low seasons. Explore the typical Airbnb income in Westfield across different performance tiers:
- Best-in-class properties (Top 10%) achieve $4,599+ monthly, often utilizing dynamic pricing and superior guest experiences.
- Strong performing properties (Top 25%) earn $2,486 or more, indicating effective management and desirable locations/amenities.
- Typical properties (Median) generate around $1,517 per month, representing the average market performance.
- Entry-level properties (Bottom 25%) see earnings around $1,000, often with potential for optimization.
Average Monthly Airbnb Earnings Trend in Westfield
Westfield Airbnb Occupancy Rate Trends (2026)
Maximize your bookings by understanding the Westfield STR occupancy trends. Seasonal demand shifts significantly influence how often properties are booked. Typically, Octobersees the highest demand (peak season occupancy), while January experiences the lowest (low season). Effective strategies, like adjusting minimum stays or offering promotions, can boost occupancy during slower periods. Here's how different property tiers perform in Westfield:
- Best-in-class properties (Top 10%) achieve 61%+ occupancy, indicating high desirability and potentially optimized availability.
- Strong performing properties (Top 25%) maintain 42% or higher occupancy, suggesting good market fit and guest satisfaction.
- Typical properties (Median) have an occupancy rate around 30%.
- Entry-level properties (Bottom 25%) average 22% occupancy, potentially facing higher vacancy.
Average Monthly Occupancy Rate Trend in Westfield
Average Daily Rate (ADR) Airbnb Trends in Westfield (2026)
Effective short term rental pricing strategy in Westfield involves understanding monthly ADR fluctuations. The Average Daily Rate (ADR) for Airbnb in Westfield typically peaks in June and dips lowest during January. Leveraging Airbnb dynamic pricing tools or strategies based on this seasonality can significantly boost revenue. Here's a look at the typical nightly rates achieved:
- Best-in-class properties (Top 10%) command rates of $330+ per night, often due to premium features or locations.
- Strong performing properties (Top 25%) achieve nightly rates of $202 or more.
- Typical properties (Median) charge around $160 per night.
- Entry-level properties (Bottom 25%) earn around $131 per night.
Average Daily Rate (ADR) Trend by Month in Westfield
Get Live Westfield Market Intelligence 👇

Explore Real-time Analytics
Airbnb Seasonality Analysis & Trends in Westfield (2026)
Peak Season (October, June, May)
- Revenue averages $2,937 per month
- Occupancy rates average 44.7%
- Daily rates average $196
Shoulder Season
- Revenue averages $2,232 per month
- Occupancy maintains around 35.8%
- Daily rates hold near $193
Low Season (January, February, December)
- Revenue drops to average $1,416 per month
- Occupancy decreases to average 23.3%
- Daily rates adjust to average $187
Seasonality Insights for Westfield
- The Airbnb seasonality in Westfield shows highly seasonal trends requiring careful strategy. While the sections above show seasonal averages, it's also insightful to look at the extremes:
- During the high season, the absolute peak month showcases Westfield's highest earning potential, with monthly revenues capable of climbing to $3,189, occupancy reaching a high of 48.2%, and ADRs peaking at $201.
- Conversely, the slowest single month of the year, typically falling within the low season, marks the market's lowest point. In this month, revenue might dip to $1,031, occupancy could drop to 17.4%, and ADRs may adjust down to $184.
- Understanding both the seasonal averages and these monthly peaks and troughs in revenue, occupancy, and ADR is crucial for maximizing your Airbnb profit potential in Westfield.
Seasonal Strategies for Maximizing Profit
- Peak Season: Maximize revenue through premium pricing and potentially longer minimum stays. Ensure high availability.
- Low Season: Offer competitive pricing, special promotions (e.g., extended stay discounts), and flexible cancellation policies. Target off-season travelers like remote workers or budget-conscious guests.
- Shoulder Seasons: Implement dynamic pricing that balances peak and low rates. Target weekend travelers or specific events. Offer slightly more flexible terms than peak season.
- Regularly analyze your own performance against these Westfield seasonality benchmarks and adjust your pricing and availability strategy accordingly.
Best Areas for Airbnb Investment in Westfield (2026)
Exploring the top neighborhoods for short-term rentals in Westfield? This section highlights key areas, outlining why they are attractive for hosts and guests, along with notable local attractions. Consider these locations based on your target guest profile and investment strategy.
| Neighborhood / Area | Why Host Here? (Target Guests & Appeal) | Key Attractions & Landmarks |
|---|---|---|
| Downtown Westfield | The heart of Westfield with a vibrant community atmosphere, shopping, and dining options. Ideal for travelers seeking convenience to local attractions and amenities. | Westfield Memorial Park, Local shops and boutiques, Restaurants and cafes, Westfield Town Hall, Nearby parks |
| Westfield Lake | A serene area known for its beautiful lake and outdoor activities. Perfect for families and nature lovers looking to relax and enjoy the outdoors. | Westfield Lake Park, Fishing and boating opportunities, Walking trails, Picnic areas, Scenic views |
| Historic Westfield District | Rich in history and charm, this district offers a quaint ambiance with unique architecture and local history. Attracts visitors interested in cultural experiences. | Historic buildings, Local museums, Art galleries, Cultural festivals, Community events |
| Westfield Shopping Center | Home to a variety of retail shops and eateries, this area attracts shoppers and families looking for a fun day out. Perfect for short-term stays for shopping enthusiasts. | Major retail stores, Dining options, Entertainment facilities, Convenient parking, Event spaces |
| Northwest Westfield | A growing residential area with new developments and family-friendly parks. Great for those looking for a suburban feel with proximity to the city. | Parks and playgrounds, Community centers, Local schools, Residential neighborhoods, Family activities |
| Westfield Sports Complex | Ideal for sports enthusiasts, this area offers various sports facilities and events. Attracts visitors for tournaments and family sports outings. | Sports fields, Tennis courts, Basketball facilities, Community sporting events, Green spaces |
| Westfield Arts and Cultural Area | A center for the creative community in Westfield, attracting art lovers and practitioners. A great spot for culturally-focused Airbnb listings. | Art studios, Theater venues, Live music events, Art festivals, Community art projects |
| South Westfield | A suburban area offering a tranquil environment with easy access to local amenities, ideal for longer stays. | Quiet neighborhoods, Local parks, Shopping conveniences, Grocery stores, Friendly community atmosphere |
Understanding Airbnb License Requirements & STR Laws in Westfield (2026)
While Westfield, North Carolina, United States currently shows low STR regulations, specific Airbnb license requirements might still exist or change. Always verify the latest short term rental regulations and Airbnb license requirements directly with local government authorities for Westfield to ensure full compliance before hosting.
(Source: AirROI data, 2026, finding no licensed listings among those analyzed)
Top Performing Airbnb Properties in Westfield (2026)
Benchmark your potential! Explore examples of top-performing Airbnb properties in Westfieldbased on Trailing Twelve Month (TTM) revenue. Analyze their characteristics, revenue, occupancy rate, and ADR to understand what drives success in this market.
Heavenly Way Retreat
Entire Place • 11 bedrooms
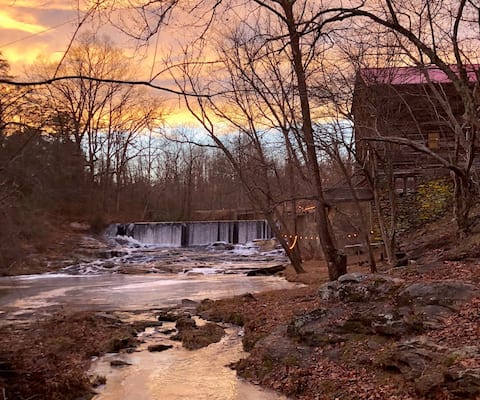
Historic Waterfall Mill with Hot Tub
Entire Place • 2 bedrooms

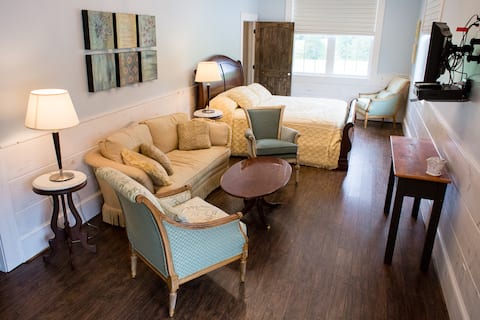
The Rock Retreat
Entire Place • 2 bedrooms

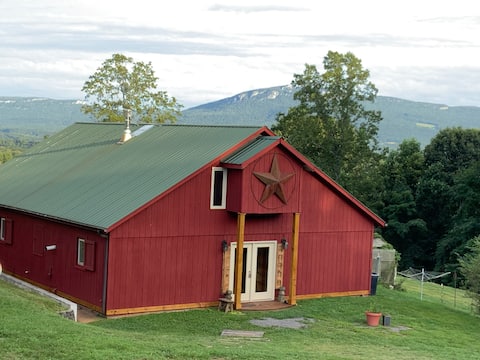
Relax & Unwind in Charming Mountain View Farmhouse
Entire Place • 3 bedrooms

Tobacco barn cabin with trails, fishing and hiking
Entire Place • 1 bedroom
The Red Cabin at Luna's Trail
Entire Place • 3 bedrooms
Note: Performance varies based on location, size, amenities, seasonality, and management quality. Data reflects the past 12 months.
Top Performing Airbnb Hosts in Westfield (2026)
Learn from the best! This table showcases top-performing Airbnb hosts in Westfield based on the number of properties managed and estimated total revenue over the past year. Analyze their scale and performance metrics.
| Host Name | Properties | Grossing Revenue | Stay Reviews | Avg Rating |
|---|---|---|---|---|
| Ann Rollins Plonk | 11 | $178,176 | 884 | 4.95/5.0 |
| Annukka | 1 | $86,750 | 68 | 5.00/5.0 |
| Taylor & Dylan | 1 | $80,191 | 466 | 4.91/5.0 |
| Jennifer | 1 | $34,772 | 185 | 4.95/5.0 |
| Bryan | 1 | $34,277 | 65 | 4.98/5.0 |
| Julie | 1 | $32,841 | 36 | 5.00/5.0 |
| Bettye | 1 | $20,021 | 84 | 4.94/5.0 |
| Linda | 1 | $16,160 | 16 | 5.00/5.0 |
| Lynn | 1 | $15,191 | 51 | 4.94/5.0 |
| Krista | 1 | $12,586 | 26 | 4.96/5.0 |
Analyzing the strategies of top hosts, such as their property selection, pricing, and guest communication, can offer valuable lessons for optimizing your own Airbnb operations in Westfield.
Dive Deeper: Advanced Westfield STR Market Data (2026)
Ready to unlock more insights? AirROI provides access to advanced metrics and comprehensive Airbnb data for Westfield. Explore detailed analytics beyond this report to refine your investment strategy, optimize pricing, and maximize your vacation rental profits.
Explore Advanced MetricsWestfield Short-Term Rental Market Composition (2026): Property & Room Types
Room Type Distribution
Property Type Distribution
Market Composition Insights for Westfield
- The Westfield Airbnb market composition is heavily skewed towards Entire Home/Apt listings, which make up 57.1% of the 21 active rentals. This indicates strong guest preference for privacy and space.
- However, a notable 42.9% share for Private Rooms suggests opportunities for budget-conscious travelers or hosts renting out spare rooms.
- Looking at the property type distribution in Westfield, Hotel/Boutique properties are the most common (42.9%), reflecting the local real estate landscape.
- Houses represent a significant 38.1% portion, catering likely to families or larger groups.
- The presence of 42.9% Hotel/Boutique listings indicates integration with traditional hospitality.
- Smaller segments like unique stays (combined 4.8%) offer potential for unique stay experiences.
Westfield Airbnb Room Capacity Analysis (2026): Bedroom Distribution
Distribution of Listings by Number of Bedrooms
Room Capacity Insights for Westfield
- The dominant room capacity in Westfield is 1 bedroom listings, making up 52.4% of the market. This suggests a strong demand for properties suitable for couples or solo travelers.
- Together, 1 bedroom and 3 bedrooms properties represent 76.2% of the active Airbnb listings in Westfield, indicating a high concentration in these sizes.
- With over half the market (52.4%) consisting of studios or 1-bedroom units, Westfield is particularly well-suited for individuals or couples.
- A significant 33.3% of listings offer 3+ bedrooms, catering to larger groups and families seeking more space in Westfield.
Westfield Vacation Rental Guest Capacity Trends (2026)
Distribution of Listings by Guest Capacity
Guest Capacity Insights for Westfield
- The most common guest capacity trend in Westfield vacation rentals is listings accommodating 4 guests (28.6%). This suggests the primary traveler segment is likely small families or groups.
- Properties designed for 4 guests and 2 guests dominate the Westfield STR market, accounting for 57.2% of listings.
- 42.9% of properties accommodate 6+ guests, serving the market segment for larger families or group travel in Westfield.
- On average, properties in Westfield are equipped to host 4.8 guests.
Westfield Airbnb Booking Patterns (2026): Available vs. Booked Days
Available Days Distribution
Booked Days Distribution
Booking Pattern Insights for Westfield
- The most common availability pattern in Westfield falls within the 181-270 days range, representing 61.9% of listings. This suggests many properties have significant open periods on their calendars.
- Approximately 90.5% of listings show high availability (181+ days open annually), indicating potential for increased bookings or specific owner usage patterns.
- For booked days, the 91-180 days range is most frequent in Westfield (57.1%), reflecting common guest stay durations or potential owner blocking patterns.
- A notable 14.3% of properties secure long booking periods (181+ days booked per year), highlighting successful long-term rental strategies or significant owner usage.
Westfield Airbnb Minimum Stay Requirements Analysis
Distribution of Listings by Minimum Night Requirement
1 Night
11 listings
52.4% of total
2 Nights
8 listings
38.1% of total
30+ Nights
2 listings
9.5% of total
Key Insights
- The most prevalent minimum stay requirement in Westfield is 1 Night, adopted by 52.4% of listings. This highlights the market's preference for shorter, flexible bookings.
- A strong majority (90.5%) of the Westfield Airbnb data shows acceptance of very short stays (1-2 nights), indicating a dynamic, high-turnover market.
Recommendations
- Align with the market by considering a 1 Night minimum stay, as 52.4% of Westfield hosts use this setting.
- Explore offering discounts for stays of 30+ nights to attract the 9.5% of the market seeking extended stays.
- Adjust minimum nights based on seasonality – potentially shorter during low season and longer during peak demand periods in Westfield.
Westfield Airbnb Cancellation Policy Trends Analysis (2026)
Flexible
12 listings
57.1% of total
Moderate
3 listings
14.3% of total
Firm
6 listings
28.6% of total
Cancellation Policy Insights for Westfield
- The prevailing Airbnb cancellation policy trend in Westfield is Flexible, used by 57.1% of listings.
- The market strongly favors guest-friendly terms, with 71.4% of listings offering Flexible or Moderate policies. This suggests guests in Westfield may expect booking flexibility.
Recommendations for Hosts
- Consider adopting a Flexible policy to align with the 57.1% market standard in Westfield.
- Given the high prevalence of Flexible policies (57.1%), offering this can enhance booking appeal, especially during shoulder seasons.
- Regularly review your cancellation policy against competitors and market demand shifts in Westfield.
Westfield STR Booking Lead Time Analysis (2026)
Average Booking Lead Time by Month
Booking Lead Time Insights for Westfield
- The overall average booking lead time for vacation rentals in Westfield is 56 days.
- Guests book furthest in advance for stays during October (average 102 days), likely coinciding with peak travel demand or local events.
- The shortest booking windows occur for stays in August (average 39 days), indicating more last-minute travel plans during this time.
- Seasonally, Fall (81 days avg.) sees the longest lead times, while Summer (44 days avg.) has the shortest, reflecting typical travel planning cycles.
Recommendations for Hosts
- Use the overall average lead time (56 days) as a baseline for your pricing and availability strategy in Westfield.
- For October stays, consider implementing length-of-stay discounts or slightly higher rates for bookings made less than 102 days out to capitalize on advance planning.
- Target marketing efforts for the Fall season well in advance (at least 81 days) to capture early planners.
- Monitor your own booking lead times against these Westfield averages to identify opportunities for dynamic pricing adjustments.
Popular & Essential Airbnb Amenities in Westfield (2026)
Amenity Prevalence
No amenities with partial availability (less than 100%) were found to display in the chart. All essential amenities might be present in all listings. Check insights below.
Amenity Insights for Westfield
- Essential amenities in Westfield that guests expect include: Heating, Air conditioning, Refrigerator, Free parking on premises, Wifi, Smoke alarm, TV, Bed linens, Hot water, Essentials. Lacking these (any) could significantly impact bookings.
Recommendations for Hosts
- Ensure your listing includes all essential amenities for Westfield: Heating, Air conditioning, Refrigerator, Free parking on premises, Wifi, Smoke alarm, TV, Bed linens, Hot water, Essentials.
- Highlight unique or less common amenities you offer (e.g., hot tub, dedicated workspace, EV charger) in your listing description and photos.
- Regularly check competitor amenities in Westfield to stay competitive.
Westfield Airbnb Guest Demographics & Profile Analysis (2026)
Guest Profile Summary for Westfield
- The typical guest profile for Airbnb in Westfield consists of primarily domestic travelers (98%), often arriving from nearby Raleigh, typically belonging to the Post-2000s (Gen Z/Alpha) group (50%), primarily speaking English or Spanish.
- Domestic travelers account for 97.9% of guests.
- Key international markets include United States (97.9%) and DC (1.6%).
- Top languages spoken are English (81.6%) followed by Spanish (7.9%).
- A significant demographic segment is the Post-2000s (Gen Z/Alpha) group, representing 50% of guests.
Recommendations for Hosts
- Target domestic marketing efforts towards travelers from Raleigh and Greensboro.
- Tailor amenities and listing descriptions to appeal to the dominant Post-2000s (Gen Z/Alpha) demographic (e.g., highlight fast WiFi, smart home features, local guides).
- Highlight unique local experiences or amenities relevant to the primary guest profile.
- Consider seasonal promotions aligned with peak travel times for key origin markets.
Nearby Short-Term Rental Market Comparison
How does the Westfield Airbnb market stack up against its neighbors? Compare key performance metrics like average monthly revenue, ADR, and occupancy rates in surrounding areas to understand the broader regional STR landscape.
| Market | Active Properties | Monthly Revenue | Daily Rate | Avg. Occupancy |
|---|---|---|---|---|
| Denver | 109 | $6,309 | $590.96 | 45% |
| Catawba | 16 | $6,093 | $582.49 | 38% |
| Mooresville | 369 | $5,702 | $559.93 | 42% |
| Penhook | 18 | $5,675 | $678.75 | 37% |
| Sherrills Ford | 107 | $5,615 | $547.26 | 41% |
| Troutman | 49 | $5,587 | $467.90 | 42% |
| Lake Norman of Catawba | 51 | $4,972 | $513.30 | 43% |
| Rockbridge Baths | 12 | $4,144 | $298.35 | 45% |
| Blacksburg | 297 | $4,116 | $509.14 | 40% |
| Goodview | 31 | $3,953 | $401.90 | 44% |