Warrensville Airbnb Market Analysis 2026: Short Term Rental Data & Vacation Rental Statistics in North Carolina, United States
Is Airbnb profitable in Warrensville in 2026? Explore comprehensive Airbnb analytics for Warrensville, North Carolina, United States to uncover income potential. This 2026 STR market report for Warrensville, based on AirROI data from February 2025 to January 2026, reveals key trends in the niche market of 22 active listings.
Whether you're considering an Airbnb investment in Warrensville, optimizing your existing vacation rental, or exploring rental arbitrage opportunities, understanding the Warrensville Airbnb data is crucial. Leveraging the low regulation environment is key to maximizing your short term rental income potential. Let's dive into the specifics.
Key Warrensville Airbnb Performance Metrics Overview
Monthly Airbnb Revenue Variations & Income Potential in Warrensville (2026)
Understanding the monthly revenue variations for Airbnb listings in Warrensville is key to maximizing your short term rental income potential. Seasonality significantly impacts earnings. Our analysis, based on data from the past 12 months, shows that the peak revenue month for STRs in Warrensville is typically October, while February often presents the lowest earnings, highlighting opportunities for strategic pricing adjustments during shoulder and low seasons. Explore the typical Airbnb income in Warrensville across different performance tiers:
- Best-in-class properties (Top 10%) achieve $4,523+ monthly, often utilizing dynamic pricing and superior guest experiences.
- Strong performing properties (Top 25%) earn $3,006 or more, indicating effective management and desirable locations/amenities.
- Typical properties (Median) generate around $1,770 per month, representing the average market performance.
- Entry-level properties (Bottom 25%) see earnings around $683, often with potential for optimization.
Average Monthly Airbnb Earnings Trend in Warrensville
Warrensville Airbnb Occupancy Rate Trends (2026)
Maximize your bookings by understanding the Warrensville STR occupancy trends. Seasonal demand shifts significantly influence how often properties are booked. Typically, Octobersees the highest demand (peak season occupancy), while February experiences the lowest (low season). Effective strategies, like adjusting minimum stays or offering promotions, can boost occupancy during slower periods. Here's how different property tiers perform in Warrensville:
- Best-in-class properties (Top 10%) achieve 71%+ occupancy, indicating high desirability and potentially optimized availability.
- Strong performing properties (Top 25%) maintain 53% or higher occupancy, suggesting good market fit and guest satisfaction.
- Typical properties (Median) have an occupancy rate around 37%.
- Entry-level properties (Bottom 25%) average 21% occupancy, potentially facing higher vacancy.
Average Monthly Occupancy Rate Trend in Warrensville
Average Daily Rate (ADR) Airbnb Trends in Warrensville (2026)
Effective short term rental pricing strategy in Warrensville involves understanding monthly ADR fluctuations. The Average Daily Rate (ADR) for Airbnb in Warrensville typically peaks in September and dips lowest during March. Leveraging Airbnb dynamic pricing tools or strategies based on this seasonality can significantly boost revenue. Here's a look at the typical nightly rates achieved:
- Best-in-class properties (Top 10%) command rates of $323+ per night, often due to premium features or locations.
- Strong performing properties (Top 25%) achieve nightly rates of $239 or more.
- Typical properties (Median) charge around $146 per night.
- Entry-level properties (Bottom 25%) earn around $88 per night.
Average Daily Rate (ADR) Trend by Month in Warrensville
Get Live Warrensville Market Intelligence 👇

Explore Real-time Analytics
Airbnb Seasonality Analysis & Trends in Warrensville (2026)
Peak Season (October, July, November)
- Revenue averages $2,746 per month
- Occupancy rates average 50.2%
- Daily rates average $181
Shoulder Season
- Revenue averages $2,198 per month
- Occupancy maintains around 38.7%
- Daily rates hold near $180
Low Season (February, March, April)
- Revenue drops to average $1,380 per month
- Occupancy decreases to average 29.3%
- Daily rates adjust to average $156
Seasonality Insights for Warrensville
- The Airbnb seasonality in Warrensville shows highly seasonal trends requiring careful strategy. While the sections above show seasonal averages, it's also insightful to look at the extremes:
- During the high season, the absolute peak month showcases Warrensville's highest earning potential, with monthly revenues capable of climbing to $3,045, occupancy reaching a high of 54.7%, and ADRs peaking at $192.
- Conversely, the slowest single month of the year, typically falling within the low season, marks the market's lowest point. In this month, revenue might dip to $951, occupancy could drop to 25.0%, and ADRs may adjust down to $155.
- Understanding both the seasonal averages and these monthly peaks and troughs in revenue, occupancy, and ADR is crucial for maximizing your Airbnb profit potential in Warrensville.
Seasonal Strategies for Maximizing Profit
- Peak Season: Maximize revenue through premium pricing and potentially longer minimum stays. Ensure high availability.
- Low Season: Offer competitive pricing, special promotions (e.g., extended stay discounts), and flexible cancellation policies. Target off-season travelers like remote workers or budget-conscious guests.
- Shoulder Seasons: Implement dynamic pricing that balances peak and low rates. Target weekend travelers or specific events. Offer slightly more flexible terms than peak season.
- Regularly analyze your own performance against these Warrensville seasonality benchmarks and adjust your pricing and availability strategy accordingly.
Best Areas for Airbnb Investment in Warrensville (2026)
Exploring the top neighborhoods for short-term rentals in Warrensville? This section highlights key areas, outlining why they are attractive for hosts and guests, along with notable local attractions. Consider these locations based on your target guest profile and investment strategy.
| Neighborhood / Area | Why Host Here? (Target Guests & Appeal) | Key Attractions & Landmarks |
|---|---|---|
| Warrensville Center Road | A central hub for visitors looking to explore the Blue Ridge Parkway. Offers access to outdoor activities and local dining. | Blue Ridge Parkway, Jefferson National Forest, hiking trails, local restaurants |
| Warrensville Lake Park | Popular with families seeking outdoor recreation options such as picnics and fishing. It’s a serene location ideal for relaxation and nature walks. | Warrensville Lake, fishing spots, picnic areas, nature trails |
| Downtown Warrensville | The cultural heart of the region with easy access to shops, cafes, and local events. It's vibrant and attracts visitors year-round. | local shops, cultural festivals, community events, art galleries |
| Nearby Blue Ridge Mountains | Known for its stunning natural beauty, great for tourists and nature lovers. Ideal for hiking, camping, and exploring. | hiking trails, camping sites, scenic views, wildlife watching |
| Warrensville Vineyards | A charming area for wine enthusiasts. Visitors enjoy vineyard tours and tastings throughout the year. | wine tastings, vineyard tours, local wineries, events |
| Historic Sites of Warrensville | Rich in history, this area attracts those interested in local heritage, perfect for educational trips. | historic buildings, local museums, heritage trails |
| Local Farmers Markets | Great for foodies and those seeking fresh produce and local goods. Attracts visitors looking for authentic local experiences. | fresh produce, local crafts, food stalls, community vibe |
| Nearby National Parks | Easily accessible for those looking to explore nature and enjoy outdoor activities. Popular among adventurers and families alike. | hiking, camping, scenic views, wildlife |
Understanding Airbnb License Requirements & STR Laws in Warrensville (2026)
While Warrensville, North Carolina, United States currently shows low STR regulations, specific Airbnb license requirements might still exist or change. Always verify the latest short term rental regulations and Airbnb license requirements directly with local government authorities for Warrensville to ensure full compliance before hosting.
(Source: AirROI data, 2026, finding no licensed listings among those analyzed)
Top Performing Airbnb Properties in Warrensville (2026)
Benchmark your potential! Explore examples of top-performing Airbnb properties in Warrensvillebased on Trailing Twelve Month (TTM) revenue. Analyze their characteristics, revenue, occupancy rate, and ADR to understand what drives success in this market.
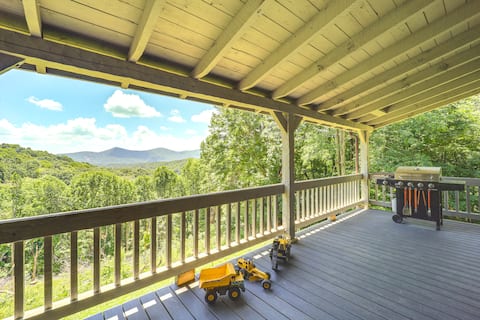
Ashe County Log Cabin: Mountain-View Deck, Sauna
Entire Place • 3 bedrooms
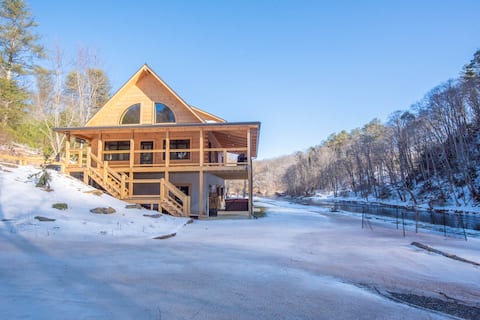
Brand New Cabin - New River - Hot Tub
Entire Place • 3 bedrooms

Sugar Tree Lodge - The Sweetest Place To Be.
Entire Place • 3 bedrooms
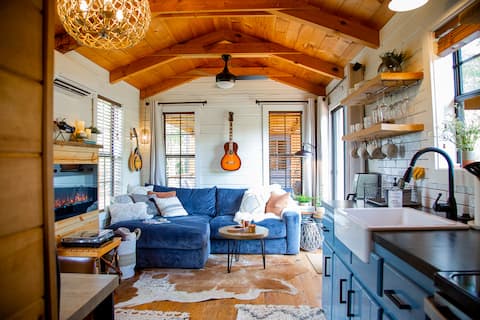
stylish modern cabin with panoramic views
Entire Place • 1 bedroom
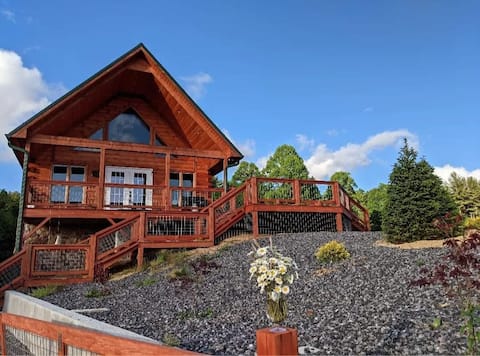
New Cabin with Amazing Views!
Entire Place • 3 bedrooms
Bearadise Log Cabin~Rustic Secluded Log Cabin~
Entire Place • 2 bedrooms
Note: Performance varies based on location, size, amenities, seasonality, and management quality. Data reflects the past 12 months.
Top Performing Airbnb Hosts in Warrensville (2026)
Learn from the best! This table showcases top-performing Airbnb hosts in Warrensville based on the number of properties managed and estimated total revenue over the past year. Analyze their scale and performance metrics.
| Host Name | Properties | Grossing Revenue | Stay Reviews | Avg Rating |
|---|---|---|---|---|
| Evolve | 3 | $102,988 | 100 | 4.68/5.0 |
| Jerrita | 3 | $78,973 | 45 | 4.91/5.0 |
| High Mountain Cabin Rentals | 2 | $41,129 | 30 | 4.83/5.0 |
| Karen | 1 | $39,422 | 195 | 4.96/5.0 |
| Jana | 1 | $37,641 | 139 | 4.99/5.0 |
| Roberto | 1 | $36,069 | 27 | 4.93/5.0 |
| Karen | 1 | $33,795 | 306 | 4.90/5.0 |
| Kelly | 5 | $30,588 | 713 | 4.98/5.0 |
| Dana | 1 | $30,254 | 36 | 5.00/5.0 |
| Sheree | 1 | $19,720 | 82 | 4.96/5.0 |
Analyzing the strategies of top hosts, such as their property selection, pricing, and guest communication, can offer valuable lessons for optimizing your own Airbnb operations in Warrensville.
Dive Deeper: Advanced Warrensville STR Market Data (2026)
Ready to unlock more insights? AirROI provides access to advanced metrics and comprehensive Airbnb data for Warrensville. Explore detailed analytics beyond this report to refine your investment strategy, optimize pricing, and maximize your vacation rental profits.
Explore Advanced MetricsWarrensville Short-Term Rental Market Composition (2026): Property & Room Types
Room Type Distribution
Property Type Distribution
Market Composition Insights for Warrensville
- The Warrensville Airbnb market composition is heavily skewed towards Entire Home/Apt listings, which make up 81.8% of the 22 active rentals. This indicates strong guest preference for privacy and space.
- Looking at the property type distribution in Warrensville, Outdoor/Unique properties are the most common (54.5%), reflecting the local real estate landscape.
- Houses represent a significant 40.9% portion, catering likely to families or larger groups.
- Smaller segments like unique stays (combined 4.5%) offer potential for unique stay experiences.
Warrensville Airbnb Room Capacity Analysis (2026): Bedroom Distribution
Distribution of Listings by Number of Bedrooms
Room Capacity Insights for Warrensville
- The dominant room capacity in Warrensville is 3 bedrooms listings, making up 22.7% of the market. This suggests a strong demand for properties suitable for families or small groups.
- Together, 3 bedrooms and 4 bedrooms properties represent 45.4% of the active Airbnb listings in Warrensville, indicating a high concentration in these sizes.
- A significant 49.9% of listings offer 3+ bedrooms, catering to larger groups and families seeking more space in Warrensville.
Warrensville Vacation Rental Guest Capacity Trends (2026)
Distribution of Listings by Guest Capacity
Guest Capacity Insights for Warrensville
- The most common guest capacity trend in Warrensville vacation rentals is listings accommodating 8+ guests (36.4%). This suggests the primary traveler segment is likely larger groups.
- Properties designed for 8+ guests and 2 guests dominate the Warrensville STR market, accounting for 59.1% of listings.
- 45.5% of properties accommodate 6+ guests, serving the market segment for larger families or group travel in Warrensville.
- On average, properties in Warrensville are equipped to host 4.7 guests.
Warrensville Airbnb Booking Patterns (2026): Available vs. Booked Days
Available Days Distribution
Booked Days Distribution
Booking Pattern Insights for Warrensville
- The most common availability pattern in Warrensville falls within the 181-270 days range, representing 40.9% of listings. This suggests many properties have significant open periods on their calendars.
- Approximately 77.3% of listings show high availability (181+ days open annually), indicating potential for increased bookings or specific owner usage patterns.
- For booked days, the 91-180 days range is most frequent in Warrensville (40.9%), reflecting common guest stay durations or potential owner blocking patterns.
- A notable 22.7% of properties secure long booking periods (181+ days booked per year), highlighting successful long-term rental strategies or significant owner usage.
Warrensville Airbnb Minimum Stay Requirements Analysis
Distribution of Listings by Minimum Night Requirement
1 Night
5 listings
22.7% of total
2 Nights
9 listings
40.9% of total
30+ Nights
8 listings
36.4% of total
Key Insights
- The most prevalent minimum stay requirement in Warrensville is 2 Nights, adopted by 40.9% of listings. This highlights the market's preference for shorter, flexible bookings.
- A strong majority (63.6%) of the Warrensville Airbnb data shows acceptance of very short stays (1-2 nights), indicating a dynamic, high-turnover market.
- A significant segment (36.4%) caters to monthly stays (30+ nights) in Warrensville, pointing to opportunities in the extended-stay market.
Recommendations
- Align with the market by considering a 2 Nights minimum stay, as 40.9% of Warrensville hosts use this setting.
- If feasible, allowing 1-night stays, especially midweek or during low season, could capture last-minute bookings, as only 22.7% currently do.
- Explore offering discounts for stays of 30+ nights to attract the 36.4% of the market seeking extended stays.
- Adjust minimum nights based on seasonality – potentially shorter during low season and longer during peak demand periods in Warrensville.
Warrensville Airbnb Cancellation Policy Trends Analysis (2026)
Limited
1 listings
4.5% of total
Flexible
2 listings
9.1% of total
Moderate
7 listings
31.8% of total
Firm
5 listings
22.7% of total
Strict
7 listings
31.8% of total
Cancellation Policy Insights for Warrensville
- The prevailing Airbnb cancellation policy trend in Warrensville is Moderate, used by 31.8% of listings.
- A majority (54.5%) of hosts in Warrensville utilize Firm or Strict policies, indicating a market where hosts prioritize booking security.
Recommendations for Hosts
- Consider adopting a Moderate policy to align with the 31.8% market standard in Warrensville.
- With 31.8% using Strict terms, this is a viable option in Warrensville, particularly for high-value properties or during peak demand periods.
- Regularly review your cancellation policy against competitors and market demand shifts in Warrensville.
Warrensville STR Booking Lead Time Analysis (2026)
Average Booking Lead Time by Month
Booking Lead Time Insights for Warrensville
- The overall average booking lead time for vacation rentals in Warrensville is 48 days.
- Guests book furthest in advance for stays during August (average 68 days), likely coinciding with peak travel demand or local events.
- The shortest booking windows occur for stays in April (average 34 days), indicating more last-minute travel plans during this time.
- Seasonally, Summer (56 days avg.) sees the longest lead times, while Winter (46 days avg.) has the shortest, reflecting typical travel planning cycles.
Recommendations for Hosts
- Use the overall average lead time (48 days) as a baseline for your pricing and availability strategy in Warrensville.
- For August stays, consider implementing length-of-stay discounts or slightly higher rates for bookings made less than 68 days out to capitalize on advance planning.
- Target marketing efforts for the Summer season well in advance (at least 56 days) to capture early planners.
- Monitor your own booking lead times against these Warrensville averages to identify opportunities for dynamic pricing adjustments.
Popular & Essential Airbnb Amenities in Warrensville (2026)
Amenity Prevalence
Amenity Insights for Warrensville
- Essential amenities in Warrensville that guests expect include: Heating, Wifi, Smoke alarm. Lacking these (any) could significantly impact bookings.
- Popular amenities like Coffee maker, Free parking on premises, Kitchen are common but not universal. Offering these can provide a competitive edge.
Recommendations for Hosts
- Ensure your listing includes all essential amenities for Warrensville: Heating, Wifi, Smoke alarm.
- Prioritize adding missing essentials: Smoke alarm.
- Consider adding popular differentiators like Coffee maker or Free parking on premises to increase appeal.
- Highlight unique or less common amenities you offer (e.g., hot tub, dedicated workspace, EV charger) in your listing description and photos.
- Regularly check competitor amenities in Warrensville to stay competitive.
Warrensville Airbnb Guest Demographics & Profile Analysis (2026)
Guest Profile Summary for Warrensville
- The typical guest profile for Airbnb in Warrensville consists of primarily domestic travelers (96%), often arriving from nearby Raleigh, typically belonging to the Post-2000s (Gen Z/Alpha) group (50%), primarily speaking English or Spanish.
- Domestic travelers account for 96.4% of guests.
- Key international markets include United States (96.4%) and Canada (1.2%).
- Top languages spoken are English (81.2%) followed by Spanish (5.8%).
- A significant demographic segment is the Post-2000s (Gen Z/Alpha) group, representing 50% of guests.
Recommendations for Hosts
- Target domestic marketing efforts towards travelers from Raleigh and Charlotte.
- Tailor amenities and listing descriptions to appeal to the dominant Post-2000s (Gen Z/Alpha) demographic (e.g., highlight fast WiFi, smart home features, local guides).
- Highlight unique local experiences or amenities relevant to the primary guest profile.
- Consider seasonal promotions aligned with peak travel times for key origin markets.
Nearby Short-Term Rental Market Comparison
How does the Warrensville Airbnb market stack up against its neighbors? Compare key performance metrics like average monthly revenue, ADR, and occupancy rates in surrounding areas to understand the broader regional STR landscape.
| Market | Active Properties | Monthly Revenue | Daily Rate | Avg. Occupancy |
|---|---|---|---|---|
| Denver | 109 | $6,309 | $590.96 | 45% |
| Catawba | 16 | $6,093 | $582.49 | 38% |
| Mooresville | 369 | $5,702 | $559.93 | 42% |
| Sherrills Ford | 107 | $5,615 | $547.26 | 41% |
| Troutman | 49 | $5,587 | $467.90 | 42% |
| Lake Norman of Catawba | 51 | $4,972 | $513.30 | 43% |
| Union Mills | 15 | $4,938 | $442.76 | 41% |
| Blacksburg | 297 | $4,116 | $509.14 | 40% |
| Fletcher | 113 | $3,859 | $333.95 | 46% |
| Buncombe County | 13 | $3,849 | $317.20 | 45% |