Troutman Airbnb Market Analysis 2026: Short Term Rental Data & Vacation Rental Statistics in North Carolina, United States
Is Airbnb profitable in Troutman in 2026? Explore comprehensive Airbnb analytics for Troutman, North Carolina, United States to uncover income potential. This 2026 STR market report for Troutman, based on AirROI data from February 2025 to January 2026, reveals key trends in the niche market of 49 active listings.
Whether you're considering an Airbnb investment in Troutman, optimizing your existing vacation rental, or exploring rental arbitrage opportunities, understanding the Troutman Airbnb data is crucial. Leveraging the low regulation environment is key to maximizing your short term rental income potential. Let's dive into the specifics.
Key Troutman Airbnb Performance Metrics Overview
Monthly Airbnb Revenue Variations & Income Potential in Troutman (2026)
Understanding the monthly revenue variations for Airbnb listings in Troutman is key to maximizing your short term rental income potential. Seasonality significantly impacts earnings. Our analysis, based on data from the past 12 months, shows that the peak revenue month for STRs in Troutman is typically July, while February often presents the lowest earnings, highlighting opportunities for strategic pricing adjustments during shoulder and low seasons. Explore the typical Airbnb income in Troutman across different performance tiers:
- Best-in-class properties (Top 10%) achieve $15,280+ monthly, often utilizing dynamic pricing and superior guest experiences.
- Strong performing properties (Top 25%) earn $8,960 or more, indicating effective management and desirable locations/amenities.
- Typical properties (Median) generate around $4,766 per month, representing the average market performance.
- Entry-level properties (Bottom 25%) see earnings around $2,566, often with potential for optimization.
Average Monthly Airbnb Earnings Trend in Troutman
Troutman Airbnb Occupancy Rate Trends (2026)
Maximize your bookings by understanding the Troutman STR occupancy trends. Seasonal demand shifts significantly influence how often properties are booked. Typically, Julysees the highest demand (peak season occupancy), while February experiences the lowest (low season). Effective strategies, like adjusting minimum stays or offering promotions, can boost occupancy during slower periods. Here's how different property tiers perform in Troutman:
- Best-in-class properties (Top 10%) achieve 77%+ occupancy, indicating high desirability and potentially optimized availability.
- Strong performing properties (Top 25%) maintain 61% or higher occupancy, suggesting good market fit and guest satisfaction.
- Typical properties (Median) have an occupancy rate around 43%.
- Entry-level properties (Bottom 25%) average 26% occupancy, potentially facing higher vacancy.
Average Monthly Occupancy Rate Trend in Troutman
Average Daily Rate (ADR) Airbnb Trends in Troutman (2026)
Effective short term rental pricing strategy in Troutman involves understanding monthly ADR fluctuations. The Average Daily Rate (ADR) for Airbnb in Troutman typically peaks in July and dips lowest during February. Leveraging Airbnb dynamic pricing tools or strategies based on this seasonality can significantly boost revenue. Here's a look at the typical nightly rates achieved:
- Best-in-class properties (Top 10%) command rates of $864+ per night, often due to premium features or locations.
- Strong performing properties (Top 25%) achieve nightly rates of $607 or more.
- Typical properties (Median) charge around $376 per night.
- Entry-level properties (Bottom 25%) earn around $195 per night.
Average Daily Rate (ADR) Trend by Month in Troutman
Get Live Troutman Market Intelligence 👇

Explore Real-time Analytics
Airbnb Seasonality Analysis & Trends in Troutman (2026)
Peak Season (July, June, August)
- Revenue averages $10,963 per month
- Occupancy rates average 58.3%
- Daily rates average $524
Shoulder Season
- Revenue averages $6,000 per month
- Occupancy maintains around 39.9%
- Daily rates hold near $440
Low Season (February, March, April)
- Revenue drops to average $4,034 per month
- Occupancy decreases to average 39.5%
- Daily rates adjust to average $376
Seasonality Insights for Troutman
- The Airbnb seasonality in Troutman shows highly seasonal trends requiring careful strategy. While the sections above show seasonal averages, it's also insightful to look at the extremes:
- During the high season, the absolute peak month showcases Troutman's highest earning potential, with monthly revenues capable of climbing to $12,686, occupancy reaching a high of 64.5%, and ADRs peaking at $538.
- Conversely, the slowest single month of the year, typically falling within the low season, marks the market's lowest point. In this month, revenue might dip to $2,521, occupancy could drop to 30.9%, and ADRs may adjust down to $361.
- Understanding both the seasonal averages and these monthly peaks and troughs in revenue, occupancy, and ADR is crucial for maximizing your Airbnb profit potential in Troutman.
Seasonal Strategies for Maximizing Profit
- Peak Season: Maximize revenue through premium pricing and potentially longer minimum stays. Ensure high availability.
- Low Season: Offer competitive pricing, special promotions (e.g., extended stay discounts), and flexible cancellation policies. Target off-season travelers like remote workers or budget-conscious guests.
- Shoulder Seasons: Implement dynamic pricing that balances peak and low rates. Target weekend travelers or specific events. Offer slightly more flexible terms than peak season.
- Regularly analyze your own performance against these Troutman seasonality benchmarks and adjust your pricing and availability strategy accordingly.
Best Areas for Airbnb Investment in Troutman (2026)
Exploring the top neighborhoods for short-term rentals in Troutman? This section highlights key areas, outlining why they are attractive for hosts and guests, along with notable local attractions. Consider these locations based on your target guest profile and investment strategy.
| Neighborhood / Area | Why Host Here? (Target Guests & Appeal) | Key Attractions & Landmarks |
|---|---|---|
| Lake Norman | A popular destination for visitors seeking recreational activities like boating, fishing, and waterfront dining. It attracts families and water enthusiasts, making it ideal for vacation rentals. | Lake Norman State Park, Dixie Landings, Dare Park, The Point Lake & Golf Club, Lake Norman Marine |
| Historic Downtown Troutman | Charming small-town atmosphere with unique shops and restaurants. It offers a quaint experience for travelers looking for a quieter, community-oriented stay. | Troutman Depot, Cafes and local diners, Troutman Plaza, Iredell Museums, Farmers Market |
| Mooresville | Adjacent to Troutman, this area offers a variety of attractions including shopping, dining, and proximity to Lake Norman, appealing to a wider range of tourists. | Lowe's Corporate Headquarters, Mooresville Historic District, Lake Norman State Park, North Carolina Auto Racing Hall of Fame, Mack's Apples |
| Mount Ulla | Scenic countryside area that provides a peaceful escape. Ideal for guests looking for outdoor experiences and a connection to nature. | Lake Norman Golf Club, Catawba River, Wildlife parks, Hiking trails, Outdoor recreational activities |
| Statesville | A larger city nearby that offers a variety of urban attractions, shopping, and dining options, attracting both leisure and business travelers. | Iredell County Historical Museum, Statesville Fish Hatchery, Fort Dobbs, Statesville's historic downtown, Local breweries |
| Harmoney | A quiet residential area attracting tourists wanting to experience life in a small town while still being close to larger attractions in Troutman and Mooresville. | Parks and recreation areas, Local eateries, Community events, Nature trails, Small artisan shops |
| Cornelius | Located close to Lake Norman, this town offers great access to water activities and is a popular choice for people looking to stay in luxury rentals. | Lake Norman, Birkdale Village, Jetton Park, Cornelius Town Park, Local breweries and eateries |
| Davidson | A charming college town with a vibrant atmosphere due to Davidson College, it attracts guests interested in culture, community events, and outdoor activities along the lake. | Davidson College, Main Street shops and restaurants, Lake Norman waterfront, Historical sites, Community festivals |
Understanding Airbnb License Requirements & STR Laws in Troutman (2026)
While Troutman, North Carolina, United States currently shows low STR regulations, specific Airbnb license requirements might still exist or change. Always verify the latest short term rental regulations and Airbnb license requirements directly with local government authorities for Troutman to ensure full compliance before hosting.
(Source: AirROI data, 2026, based on 2% licensed listings)
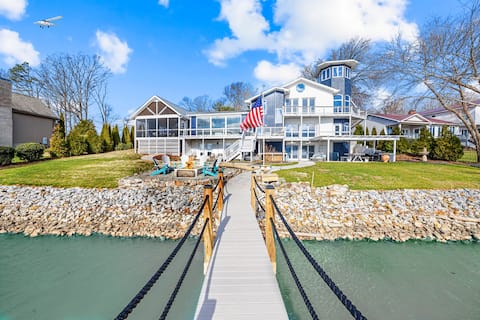
Top Performing Airbnb Properties in Troutman (2026)
Benchmark your potential! Explore examples of top-performing Airbnb properties in Troutmanbased on Trailing Twelve Month (TTM) revenue. Analyze their characteristics, revenue, occupancy rate, and ADR to understand what drives success in this market.

Winding Down by AvantStay | Sleeps 20 + Dock, View
Entire Place • 7 bedrooms
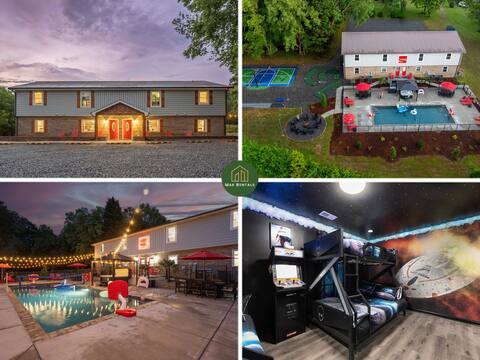
Sleeps 30! Pool, Pond, Pickleball, PuttPutt, Plus!
Entire Place • 12 bedrooms

Lakefront | Pool | GameRoom| Pickleball| Putt Putt
Entire Place • 6 bedrooms
Hot Tub, 360 Lake Views, Movie Theatre, King Suite
Entire Place • 5 bedrooms
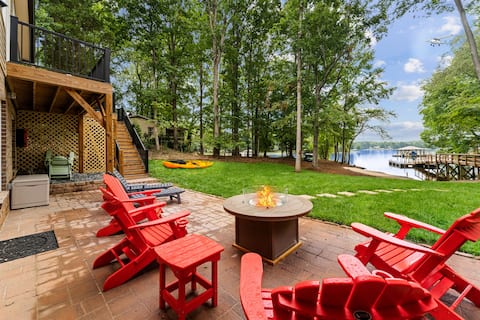
Sandy Beach, 2 King Suites, Game Rooms & Views!
Entire Place • 5 bedrooms

Whitetail Cove by AvantStay | Lakefront, Sleeps 20
Entire Place • 6 bedrooms
Note: Performance varies based on location, size, amenities, seasonality, and management quality. Data reflects the past 12 months.
Top Performing Airbnb Hosts in Troutman (2026)
Learn from the best! This table showcases top-performing Airbnb hosts in Troutman based on the number of properties managed and estimated total revenue over the past year. Analyze their scale and performance metrics.
| Host Name | Properties | Grossing Revenue | Stay Reviews | Avg Rating |
|---|---|---|---|---|
| AvantStay Lake Norman | 4 | $597,510 | 40 | 4.87/5.0 |
| Wishlist | 4 | $590,140 | 204 | 4.97/5.0 |
| Skylar | 3 | $533,095 | 62 | 4.93/5.0 |
| Mak | 2 | $145,409 | 226 | 4.96/5.0 |
| Ivy | 2 | $135,309 | 24 | 4.75/5.0 |
| Deb | 2 | $113,917 | 183 | 4.88/5.0 |
| Evolve | 4 | $113,604 | 66 | 4.86/5.0 |
| Southern Charm Retreats | 2 | $87,721 | 11 | 4.80/5.0 |
| Krista | 1 | $81,674 | 39 | 5.00/5.0 |
| Jan | 1 | $78,558 | 75 | 4.91/5.0 |
Analyzing the strategies of top hosts, such as their property selection, pricing, and guest communication, can offer valuable lessons for optimizing your own Airbnb operations in Troutman.
Dive Deeper: Advanced Troutman STR Market Data (2026)
Ready to unlock more insights? AirROI provides access to advanced metrics and comprehensive Airbnb data for Troutman. Explore detailed analytics beyond this report to refine your investment strategy, optimize pricing, and maximize your vacation rental profits.
Explore Advanced MetricsTroutman Short-Term Rental Market Composition (2026): Property & Room Types
Room Type Distribution
Property Type Distribution
Market Composition Insights for Troutman
- The Troutman Airbnb market composition is heavily skewed towards Entire Home/Apt listings, which make up 95.9% of the 49 active rentals. This indicates strong guest preference for privacy and space.
- Looking at the property type distribution in Troutman, House properties are the most common (89.8%), reflecting the local real estate landscape.
- Houses represent a significant 89.8% portion, catering likely to families or larger groups.
- Smaller segments like hotel/boutique (combined 4.1%) offer potential for unique stay experiences.
Troutman Airbnb Room Capacity Analysis (2026): Bedroom Distribution
Distribution of Listings by Number of Bedrooms
Room Capacity Insights for Troutman
- The dominant room capacity in Troutman is 5+ bedrooms listings, making up 32.7% of the market. This suggests a strong demand for properties suitable for families or small groups.
- Together, 5+ bedrooms and 3 bedrooms properties represent 63.3% of the active Airbnb listings in Troutman, indicating a high concentration in these sizes.
- A significant 81.7% of listings offer 3+ bedrooms, catering to larger groups and families seeking more space in Troutman.
Troutman Vacation Rental Guest Capacity Trends (2026)
Distribution of Listings by Guest Capacity
Guest Capacity Insights for Troutman
- The most common guest capacity trend in Troutman vacation rentals is listings accommodating 8+ guests (61.2%). This suggests the primary traveler segment is likely larger groups.
- Properties designed for 8+ guests and 6 guests dominate the Troutman STR market, accounting for 77.5% of listings.
- 79.5% of properties accommodate 6+ guests, serving the market segment for larger families or group travel in Troutman.
- On average, properties in Troutman are equipped to host 6.7 guests.
Troutman Airbnb Booking Patterns (2026): Available vs. Booked Days
Available Days Distribution
Booked Days Distribution
Booking Pattern Insights for Troutman
- The most common availability pattern in Troutman falls within the 181-270 days range, representing 44.9% of listings. This suggests many properties have significant open periods on their calendars.
- Approximately 73.5% of listings show high availability (181+ days open annually), indicating potential for increased bookings or specific owner usage patterns.
- For booked days, the 91-180 days range is most frequent in Troutman (42.9%), reflecting common guest stay durations or potential owner blocking patterns.
- A notable 28.6% of properties secure long booking periods (181+ days booked per year), highlighting successful long-term rental strategies or significant owner usage.
Troutman Airbnb Minimum Stay Requirements Analysis
Distribution of Listings by Minimum Night Requirement
1 Night
5 listings
10.2% of total
2 Nights
13 listings
26.5% of total
3 Nights
5 listings
10.2% of total
4-6 Nights
1 listings
2% of total
30+ Nights
25 listings
51% of total
Key Insights
- The most prevalent minimum stay requirement in Troutman is 30+ Nights, adopted by 51% of listings. This highlights the market's preference for longer commitments.
- A significant segment (51%) caters to monthly stays (30+ nights) in Troutman, pointing to opportunities in the extended-stay market.
Recommendations
- Align with the market by considering a 30+ Nights minimum stay, as 51% of Troutman hosts use this setting.
- If feasible, allowing 1-night stays, especially midweek or during low season, could capture last-minute bookings, as only 10.2% currently do.
- Explore offering discounts for stays of 30+ nights to attract the 51% of the market seeking extended stays.
- Adjust minimum nights based on seasonality – potentially shorter during low season and longer during peak demand periods in Troutman.
Troutman Airbnb Cancellation Policy Trends Analysis (2026)
Super Strict 60 Days
3 listings
6.1% of total
Super Strict 30 Days
2 listings
4.1% of total
Flexible
5 listings
10.2% of total
Moderate
9 listings
18.4% of total
Firm
23 listings
46.9% of total
Strict
7 listings
14.3% of total
Cancellation Policy Insights for Troutman
- The prevailing Airbnb cancellation policy trend in Troutman is Firm, used by 46.9% of listings.
- A majority (61.2%) of hosts in Troutman utilize Firm or Strict policies, indicating a market where hosts prioritize booking security.
Recommendations for Hosts
- Consider adopting a Firm policy to align with the 46.9% market standard in Troutman.
- Using a Strict policy might deter some guests, as only 14.3% of listings use it. Evaluate if potential revenue protection outweighs possible lower booking rates.
- Regularly review your cancellation policy against competitors and market demand shifts in Troutman.
Troutman STR Booking Lead Time Analysis (2026)
Average Booking Lead Time by Month
Booking Lead Time Insights for Troutman
- The overall average booking lead time for vacation rentals in Troutman is 57 days.
- Guests book furthest in advance for stays during June (average 89 days), likely coinciding with peak travel demand or local events.
- The shortest booking windows occur for stays in February (average 26 days), indicating more last-minute travel plans during this time.
- Seasonally, Summer (75 days avg.) sees the longest lead times, while Winter (37 days avg.) has the shortest, reflecting typical travel planning cycles.
Recommendations for Hosts
- Use the overall average lead time (57 days) as a baseline for your pricing and availability strategy in Troutman.
- For June stays, consider implementing length-of-stay discounts or slightly higher rates for bookings made less than 89 days out to capitalize on advance planning.
- Target marketing efforts for the Summer season well in advance (at least 75 days) to capture early planners.
- Monitor your own booking lead times against these Troutman averages to identify opportunities for dynamic pricing adjustments.
Popular & Essential Airbnb Amenities in Troutman (2026)
Amenity Prevalence
Amenity Insights for Troutman
- Essential amenities in Troutman that guests expect include: Wifi, Air conditioning, Heating, Kitchen, Hot water, Cooking basics, Coffee maker, Smoke alarm, Dishes and silverware, TV. Lacking these (any) could significantly impact bookings.
Recommendations for Hosts
- Ensure your listing includes all essential amenities for Troutman: Wifi, Air conditioning, Heating, Kitchen, Hot water, Cooking basics, Coffee maker, Smoke alarm, Dishes and silverware, TV.
- Prioritize adding missing essentials: Cooking basics, Coffee maker, Smoke alarm, Dishes and silverware, TV.
- Highlight unique or less common amenities you offer (e.g., hot tub, dedicated workspace, EV charger) in your listing description and photos.
- Regularly check competitor amenities in Troutman to stay competitive.
Troutman Airbnb Guest Demographics & Profile Analysis (2026)
Guest Profile Summary for Troutman
- The typical guest profile for Airbnb in Troutman consists of primarily domestic travelers (98%), often arriving from nearby Charlotte, typically belonging to the Post-2000s (Gen Z/Alpha) group (50%), primarily speaking English or Spanish.
- Domestic travelers account for 97.6% of guests.
- Key international markets include United States (97.6%) and Canada (0.5%).
- Top languages spoken are English (77.4%) followed by Spanish (11.6%).
- A significant demographic segment is the Post-2000s (Gen Z/Alpha) group, representing 50% of guests.
Recommendations for Hosts
- Target domestic marketing efforts towards travelers from Charlotte and New York.
- Tailor amenities and listing descriptions to appeal to the dominant Post-2000s (Gen Z/Alpha) demographic (e.g., highlight fast WiFi, smart home features, local guides).
- Highlight unique local experiences or amenities relevant to the primary guest profile.
- Consider seasonal promotions aligned with peak travel times for key origin markets.
Nearby Short-Term Rental Market Comparison
How does the Troutman Airbnb market stack up against its neighbors? Compare key performance metrics like average monthly revenue, ADR, and occupancy rates in surrounding areas to understand the broader regional STR landscape.
| Market | Active Properties | Monthly Revenue | Daily Rate | Avg. Occupancy |
|---|---|---|---|---|
| Denver | 109 | $6,309 | $590.96 | 45% |
| Catawba | 16 | $6,093 | $582.49 | 38% |
| Mooresville | 369 | $5,702 | $559.93 | 42% |
| Sherrills Ford | 107 | $5,615 | $547.26 | 41% |
| Lake Norman of Catawba | 51 | $4,972 | $513.30 | 43% |
| Chapin | 93 | $3,971 | $386.37 | 43% |
| Semora | 50 | $3,408 | $377.45 | 38% |
| Watauga County | 47 | $3,370 | $314.71 | 39% |
| Nebo | 88 | $3,330 | $381.79 | 34% |
| Blowing Rock | 426 | $3,209 | $339.38 | 38% |