Sugar Grove Airbnb Market Analysis 2026: Short Term Rental Data & Vacation Rental Statistics in North Carolina, United States
Is Airbnb profitable in Sugar Grove in 2026? Explore comprehensive Airbnb analytics for Sugar Grove, North Carolina, United States to uncover income potential. This 2026 STR market report for Sugar Grove, based on AirROI data from February 2025 to January 2026, reveals key trends in the niche market of 61 active listings.
Whether you're considering an Airbnb investment in Sugar Grove, optimizing your existing vacation rental, or exploring rental arbitrage opportunities, understanding the Sugar Grove Airbnb data is crucial. Leveraging the low regulation environment is key to maximizing your short term rental income potential. Let's dive into the specifics.
Key Sugar Grove Airbnb Performance Metrics Overview
Monthly Airbnb Revenue Variations & Income Potential in Sugar Grove (2026)
Understanding the monthly revenue variations for Airbnb listings in Sugar Grove is key to maximizing your short term rental income potential. Seasonality significantly impacts earnings. Our analysis, based on data from the past 12 months, shows that the peak revenue month for STRs in Sugar Grove is typically October, while February often presents the lowest earnings, highlighting opportunities for strategic pricing adjustments during shoulder and low seasons. Explore the typical Airbnb income in Sugar Grove across different performance tiers:
- Best-in-class properties (Top 10%) achieve $7,265+ monthly, often utilizing dynamic pricing and superior guest experiences.
- Strong performing properties (Top 25%) earn $5,087 or more, indicating effective management and desirable locations/amenities.
- Typical properties (Median) generate around $3,050 per month, representing the average market performance.
- Entry-level properties (Bottom 25%) see earnings around $1,642, often with potential for optimization.
Average Monthly Airbnb Earnings Trend in Sugar Grove
Sugar Grove Airbnb Occupancy Rate Trends (2026)
Maximize your bookings by understanding the Sugar Grove STR occupancy trends. Seasonal demand shifts significantly influence how often properties are booked. Typically, Julysees the highest demand (peak season occupancy), while January experiences the lowest (low season). Effective strategies, like adjusting minimum stays or offering promotions, can boost occupancy during slower periods. Here's how different property tiers perform in Sugar Grove:
- Best-in-class properties (Top 10%) achieve 79%+ occupancy, indicating high desirability and potentially optimized availability.
- Strong performing properties (Top 25%) maintain 65% or higher occupancy, suggesting good market fit and guest satisfaction.
- Typical properties (Median) have an occupancy rate around 43%.
- Entry-level properties (Bottom 25%) average 22% occupancy, potentially facing higher vacancy.
Average Monthly Occupancy Rate Trend in Sugar Grove
Average Daily Rate (ADR) Airbnb Trends in Sugar Grove (2026)
Effective short term rental pricing strategy in Sugar Grove involves understanding monthly ADR fluctuations. The Average Daily Rate (ADR) for Airbnb in Sugar Grove typically peaks in December and dips lowest during April. Leveraging Airbnb dynamic pricing tools or strategies based on this seasonality can significantly boost revenue. Here's a look at the typical nightly rates achieved:
- Best-in-class properties (Top 10%) command rates of $541+ per night, often due to premium features or locations.
- Strong performing properties (Top 25%) achieve nightly rates of $408 or more.
- Typical properties (Median) charge around $241 per night.
- Entry-level properties (Bottom 25%) earn around $184 per night.
Average Daily Rate (ADR) Trend by Month in Sugar Grove
Get Live Sugar Grove Market Intelligence 👇

Explore Real-time Analytics
Airbnb Seasonality Analysis & Trends in Sugar Grove (2026)
Peak Season (October, July, November)
- Revenue averages $4,797 per month
- Occupancy rates average 52.9%
- Daily rates average $320
Shoulder Season
- Revenue averages $3,532 per month
- Occupancy maintains around 43.2%
- Daily rates hold near $304
Low Season (January, February, April)
- Revenue drops to average $2,851 per month
- Occupancy decreases to average 37.2%
- Daily rates adjust to average $298
Seasonality Insights for Sugar Grove
- The Airbnb seasonality in Sugar Grove shows moderate seasonality with distinct peak and low periods. While the sections above show seasonal averages, it's also insightful to look at the extremes:
- During the high season, the absolute peak month showcases Sugar Grove's highest earning potential, with monthly revenues capable of climbing to $5,242, occupancy reaching a high of 56.4%, and ADRs peaking at $338.
- Conversely, the slowest single month of the year, typically falling within the low season, marks the market's lowest point. In this month, revenue might dip to $2,750, occupancy could drop to 28.6%, and ADRs may adjust down to $274.
- Understanding both the seasonal averages and these monthly peaks and troughs in revenue, occupancy, and ADR is crucial for maximizing your Airbnb profit potential in Sugar Grove.
Seasonal Strategies for Maximizing Profit
- Peak Season: Maximize revenue through premium pricing and potentially longer minimum stays. Ensure high availability.
- Low Season: Offer competitive pricing, special promotions (e.g., extended stay discounts), and flexible cancellation policies. Target off-season travelers like remote workers or budget-conscious guests.
- Shoulder Seasons: Implement dynamic pricing that balances peak and low rates. Target weekend travelers or specific events. Offer slightly more flexible terms than peak season.
- Regularly analyze your own performance against these Sugar Grove seasonality benchmarks and adjust your pricing and availability strategy accordingly.
Best Areas for Airbnb Investment in Sugar Grove (2026)
Exploring the top neighborhoods for short-term rentals in Sugar Grove? This section highlights key areas, outlining why they are attractive for hosts and guests, along with notable local attractions. Consider these locations based on your target guest profile and investment strategy.
| Neighborhood / Area | Why Host Here? (Target Guests & Appeal) | Key Attractions & Landmarks |
|---|---|---|
| Sugar Mountain | A popular location for skiing and snowboarding enthusiasts during the winter months, and offers stunning views and hiking opportunities in the summer. Attracts outdoor lovers year-round. | Sugar Mountain Resort, Grandfather Mountain, Linville Gorge Wilderness, Appalachian Ski Mtn. |
| Banner Elk | Known for its beautiful mountain scenery and proximity to popular hiking trails, Banner Elk is a delightful town that attracts visitors seeking outdoor adventures and relaxing mountain getaways. | Banner Elk Winery, Sugar Creek Golf Club, Mile High Swinging Bridge, Beech Mountain Resort |
| Boone | A vibrant college town with a lively cultural scene, Boone draws students, families, and outdoor adventurers alike with its diverse activities and beautiful surroundings. | Appalachian State University, Daniel Boone Native Gardens, Tweetsie Railroad, Blue Ridge Parkway, Hiking Trails |
| Blowing Rock | Famous for its picturesque views and charming downtown, Blowing Rock offers visitors a quaint shopping experience and proximity to natural wonders, making it a desirable Airbnb location. | Blowing Rock Attraction, Tweetsie Railroad, The Blowing Rock, Glen Burney Trail |
| West Jefferson | A small town with a vibrant arts scene and beautiful landscapes, West Jefferson attracts visitors looking for a more laid-back atmosphere while providing access to endless outdoor activities. | Ashe County Cheese Factory, New River State Park, Mount Jefferson State Natural Area |
| Lake Watauga | Known for its stunning lake and recreational opportunities, this area is popular for summer vacations and water activities, appealing to families and outdoor enthusiasts. | Watauga Lake, Hiking Trails, Fishing and Boating |
| Linville Falls | The breathtaking Linville Falls attracts nature lovers and hikers eager to explore the profound beauty of the adjacent Linville Gorge, providing access to scenic trails. | Linville Falls, Linville Gorge, Hiking Trails, Waterfalls |
| Doughton Park | This area is popular for its breathtaking views and renowned with hikers exploring the Blue Ridge Parkway, Ideal for visitors looking for tranquility and nature. | Blue Ridge Parkway, Hiking Trails, Wildlife Viewing |
Understanding Airbnb License Requirements & STR Laws in Sugar Grove (2026)
While Sugar Grove, North Carolina, United States currently shows low STR regulations, specific Airbnb license requirements might still exist or change. Always verify the latest short term rental regulations and Airbnb license requirements directly with local government authorities for Sugar Grove to ensure full compliance before hosting.
(Source: AirROI data, 2026, finding no licensed listings among those analyzed)
Top Performing Airbnb Properties in Sugar Grove (2026)
Benchmark your potential! Explore examples of top-performing Airbnb properties in Sugar Grovebased on Trailing Twelve Month (TTM) revenue. Analyze their characteristics, revenue, occupancy rate, and ADR to understand what drives success in this market.
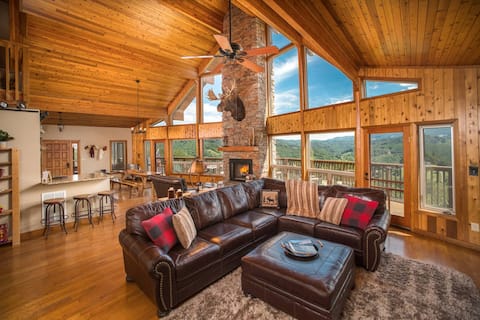
A-Frame, Grand Views, Hot Tub, Mins to Boone & ASU
Entire Place • 3 bedrooms
Cozy Winter Escape: Dog Friendly | Hot Tub
Entire Place • 2 bedrooms
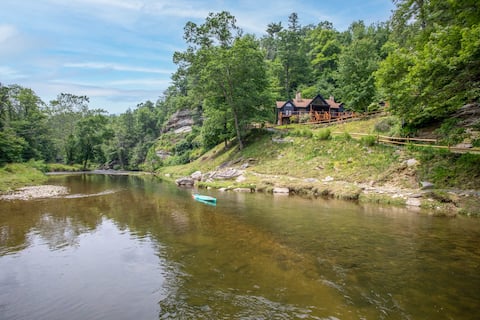
Larger riverside cabin on beautiful acreage
Entire Place • 3 bedrooms
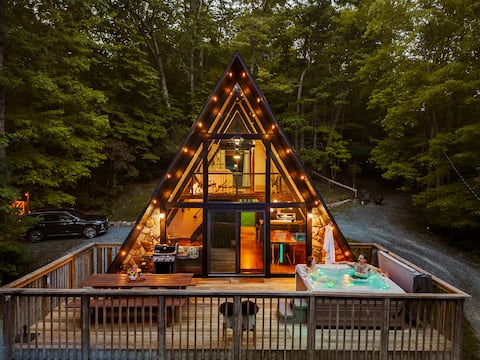
Stylish A-Frame: Hot Tub, Arcade, Dog Friendly
Entire Place • 3 bedrooms

Private Petting ZOO - Fire Pit, FP & Hot Tub!
Entire Place • 3 bedrooms
Vista View - Hot tub, fenced yard, great views!
Entire Place • 3 bedrooms
Note: Performance varies based on location, size, amenities, seasonality, and management quality. Data reflects the past 12 months.
Top Performing Airbnb Hosts in Sugar Grove (2026)
Learn from the best! This table showcases top-performing Airbnb hosts in Sugar Grove based on the number of properties managed and estimated total revenue over the past year. Analyze their scale and performance metrics.
| Host Name | Properties | Grossing Revenue | Stay Reviews | Avg Rating |
|---|---|---|---|---|
| Connie | 9 | $394,928 | 1524 | 4.91/5.0 |
| Blue Ridge Mountain Rentals | 10 | $234,381 | 87 | 4.90/5.0 |
| Carolina Cabin Rentals | 5 | $195,162 | 88 | 4.70/5.0 |
| Heather Mogollon | 1 | $102,845 | 378 | 4.98/5.0 |
| Kate | 1 | $100,447 | 171 | 4.97/5.0 |
| Emily | 1 | $78,324 | 310 | 4.96/5.0 |
| Michelly | 1 | $66,788 | 99 | 4.95/5.0 |
| High Mountain Cabin Rentals | 1 | $66,709 | 9 | 4.89/5.0 |
| Nancy | 2 | $65,299 | 525 | 4.98/5.0 |
| Ronald Steven | 1 | $59,176 | 5 | 5.00/5.0 |
Analyzing the strategies of top hosts, such as their property selection, pricing, and guest communication, can offer valuable lessons for optimizing your own Airbnb operations in Sugar Grove.
Dive Deeper: Advanced Sugar Grove STR Market Data (2026)
Ready to unlock more insights? AirROI provides access to advanced metrics and comprehensive Airbnb data for Sugar Grove. Explore detailed analytics beyond this report to refine your investment strategy, optimize pricing, and maximize your vacation rental profits.
Explore Advanced MetricsSugar Grove Short-Term Rental Market Composition (2026): Property & Room Types
Room Type Distribution
Property Type Distribution
Market Composition Insights for Sugar Grove
- The Sugar Grove Airbnb market composition is heavily skewed towards Entire Home/Apt listings, which make up 100% of the 61 active rentals. This indicates strong guest preference for privacy and space.
- Looking at the property type distribution in Sugar Grove, Outdoor/Unique properties are the most common (57.4%), reflecting the local real estate landscape.
- Houses represent a significant 34.4% portion, catering likely to families or larger groups.
- Smaller segments like hotel/boutique, apartment/condo, unique stays, others (combined 8.1%) offer potential for unique stay experiences.
Sugar Grove Airbnb Room Capacity Analysis (2026): Bedroom Distribution
Distribution of Listings by Number of Bedrooms
Room Capacity Insights for Sugar Grove
- The dominant room capacity in Sugar Grove is 3 bedrooms listings, making up 44.3% of the market. This suggests a strong demand for properties suitable for families or small groups.
- Together, 3 bedrooms and 2 bedrooms properties represent 65.6% of the active Airbnb listings in Sugar Grove, indicating a high concentration in these sizes.
- A significant 62.3% of listings offer 3+ bedrooms, catering to larger groups and families seeking more space in Sugar Grove.
Sugar Grove Vacation Rental Guest Capacity Trends (2026)
Distribution of Listings by Guest Capacity
Guest Capacity Insights for Sugar Grove
- The most common guest capacity trend in Sugar Grove vacation rentals is listings accommodating 8+ guests (45.9%). This suggests the primary traveler segment is likely larger groups.
- Properties designed for 8+ guests and 6 guests dominate the Sugar Grove STR market, accounting for 67.2% of listings.
- 75.4% of properties accommodate 6+ guests, serving the market segment for larger families or group travel in Sugar Grove.
- On average, properties in Sugar Grove are equipped to host 6.4 guests.
Sugar Grove Airbnb Booking Patterns (2026): Available vs. Booked Days
Available Days Distribution
Booked Days Distribution
Booking Pattern Insights for Sugar Grove
- The most common availability pattern in Sugar Grove falls within the 181-270 days range, representing 41% of listings. This suggests many properties have significant open periods on their calendars.
- Approximately 78.7% of listings show high availability (181+ days open annually), indicating potential for increased bookings or specific owner usage patterns.
- For booked days, the 91-180 days range is most frequent in Sugar Grove (37.7%), reflecting common guest stay durations or potential owner blocking patterns.
- A notable 26.2% of properties secure long booking periods (181+ days booked per year), highlighting successful long-term rental strategies or significant owner usage.
Sugar Grove Airbnb Minimum Stay Requirements Analysis
Distribution of Listings by Minimum Night Requirement
1 Night
8 listings
13.1% of total
2 Nights
26 listings
42.6% of total
30+ Nights
27 listings
44.3% of total
Key Insights
- The most prevalent minimum stay requirement in Sugar Grove is 30+ Nights, adopted by 44.3% of listings. This highlights the market's preference for longer commitments.
- A significant segment (44.3%) caters to monthly stays (30+ nights) in Sugar Grove, pointing to opportunities in the extended-stay market.
Recommendations
- Align with the market by considering a 30+ Nights minimum stay, as 44.3% of Sugar Grove hosts use this setting.
- If feasible, allowing 1-night stays, especially midweek or during low season, could capture last-minute bookings, as only 13.1% currently do.
- A 2-night minimum appears standard (42.6%). Consider this for weekends or peak periods.
- Explore offering discounts for stays of 30+ nights to attract the 44.3% of the market seeking extended stays.
- Adjust minimum nights based on seasonality – potentially shorter during low season and longer during peak demand periods in Sugar Grove.
Sugar Grove Airbnb Cancellation Policy Trends Analysis (2026)
Super Strict 60 Days
10 listings
16.4% of total
Limited
4 listings
6.6% of total
Flexible
8 listings
13.1% of total
Moderate
12 listings
19.7% of total
Firm
25 listings
41% of total
Strict
2 listings
3.3% of total
Cancellation Policy Insights for Sugar Grove
- The prevailing Airbnb cancellation policy trend in Sugar Grove is Firm, used by 41% of listings.
- There's a relatively balanced mix between guest-friendly (32.8%) and stricter (44.3%) policies, offering choices for different guest needs.
- Strict cancellation policies are quite rare (3.3%), potentially making listings with this policy less competitive unless justified by high demand or property type.
Recommendations for Hosts
- Consider adopting a Firm policy to align with the 41% market standard in Sugar Grove.
- Using a Strict policy might deter some guests, as only 3.3% of listings use it. Evaluate if potential revenue protection outweighs possible lower booking rates.
- Regularly review your cancellation policy against competitors and market demand shifts in Sugar Grove.
Sugar Grove STR Booking Lead Time Analysis (2026)
Average Booking Lead Time by Month
Booking Lead Time Insights for Sugar Grove
- The overall average booking lead time for vacation rentals in Sugar Grove is 59 days.
- Guests book furthest in advance for stays during October (average 97 days), likely coinciding with peak travel demand or local events.
- The shortest booking windows occur for stays in January (average 33 days), indicating more last-minute travel plans during this time.
- Seasonally, Fall (78 days avg.) sees the longest lead times, while Winter (42 days avg.) has the shortest, reflecting typical travel planning cycles.
Recommendations for Hosts
- Use the overall average lead time (59 days) as a baseline for your pricing and availability strategy in Sugar Grove.
- For October stays, consider implementing length-of-stay discounts or slightly higher rates for bookings made less than 97 days out to capitalize on advance planning.
- Target marketing efforts for the Fall season well in advance (at least 78 days) to capture early planners.
- Monitor your own booking lead times against these Sugar Grove averages to identify opportunities for dynamic pricing adjustments.
Popular & Essential Airbnb Amenities in Sugar Grove (2026)
Amenity Prevalence
Amenity Insights for Sugar Grove
- Essential amenities in Sugar Grove that guests expect include: Heating, Wifi, Dishes and silverware, Refrigerator, Kitchen, Coffee maker, Smoke alarm, TV, Free parking on premises, Microwave. Lacking these (any) could significantly impact bookings.
Recommendations for Hosts
- Ensure your listing includes all essential amenities for Sugar Grove: Heating, Wifi, Dishes and silverware, Refrigerator, Kitchen, Coffee maker, Smoke alarm, TV, Free parking on premises, Microwave.
- Prioritize adding missing essentials: Dishes and silverware, Refrigerator, Kitchen, Coffee maker, Smoke alarm, TV, Free parking on premises, Microwave.
- Highlight unique or less common amenities you offer (e.g., hot tub, dedicated workspace, EV charger) in your listing description and photos.
- Regularly check competitor amenities in Sugar Grove to stay competitive.
Sugar Grove Airbnb Guest Demographics & Profile Analysis (2026)
Guest Profile Summary for Sugar Grove
- The typical guest profile for Airbnb in Sugar Grove consists of primarily domestic travelers (99%), often arriving from nearby Charlotte, typically belonging to the Post-2000s (Gen Z/Alpha) group (50%), primarily speaking English or Spanish.
- Domestic travelers account for 98.7% of guests.
- Key international markets include United States (98.7%) and DC (0.4%).
- Top languages spoken are English (70.6%) followed by Spanish (16%).
- A significant demographic segment is the Post-2000s (Gen Z/Alpha) group, representing 50% of guests.
Recommendations for Hosts
- Target domestic marketing efforts towards travelers from Charlotte and Raleigh.
- Tailor amenities and listing descriptions to appeal to the dominant Post-2000s (Gen Z/Alpha) demographic (e.g., highlight fast WiFi, smart home features, local guides).
- Highlight unique local experiences or amenities relevant to the primary guest profile.
- Consider seasonal promotions aligned with peak travel times for key origin markets.
Nearby Short-Term Rental Market Comparison
How does the Sugar Grove Airbnb market stack up against its neighbors? Compare key performance metrics like average monthly revenue, ADR, and occupancy rates in surrounding areas to understand the broader regional STR landscape.
| Market | Active Properties | Monthly Revenue | Daily Rate | Avg. Occupancy |
|---|---|---|---|---|
| Denver | 109 | $6,309 | $590.96 | 45% |
| Catawba | 16 | $6,093 | $582.49 | 38% |
| Mooresville | 369 | $5,702 | $559.93 | 42% |
| Sherrills Ford | 107 | $5,615 | $547.26 | 41% |
| Troutman | 49 | $5,587 | $467.90 | 42% |
| Lake Norman of Catawba | 51 | $4,972 | $513.30 | 43% |
| Union Mills | 15 | $4,938 | $442.76 | 41% |
| Blacksburg | 297 | $4,116 | $509.14 | 40% |
| Fletcher | 113 | $3,859 | $333.95 | 46% |
| Buncombe County | 13 | $3,849 | $317.20 | 45% |