Southern Pines Airbnb Market Analysis 2026: Short Term Rental Data & Vacation Rental Statistics in North Carolina, United States
Is Airbnb profitable in Southern Pines in 2026? Explore comprehensive Airbnb analytics for Southern Pines, North Carolina, United States to uncover income potential. This 2026 STR market report for Southern Pines, based on AirROI data from February 2025 to January 2026, reveals key trends in the niche market of 190 active listings.
Whether you're considering an Airbnb investment in Southern Pines, optimizing your existing vacation rental, or exploring rental arbitrage opportunities, understanding the Southern Pines Airbnb data is crucial. Leveraging the low regulation environment is key to maximizing your short term rental income potential. Let's dive into the specifics.
Key Southern Pines Airbnb Performance Metrics Overview
Monthly Airbnb Revenue Variations & Income Potential in Southern Pines (2026)
Understanding the monthly revenue variations for Airbnb listings in Southern Pines is key to maximizing your short term rental income potential. Seasonality significantly impacts earnings. Our analysis, based on data from the past 12 months, shows that the peak revenue month for STRs in Southern Pines is typically July, while January often presents the lowest earnings, highlighting opportunities for strategic pricing adjustments during shoulder and low seasons. Explore the typical Airbnb income in Southern Pines across different performance tiers:
- Best-in-class properties (Top 10%) achieve $6,968+ monthly, often utilizing dynamic pricing and superior guest experiences.
- Strong performing properties (Top 25%) earn $4,320 or more, indicating effective management and desirable locations/amenities.
- Typical properties (Median) generate around $2,654 per month, representing the average market performance.
- Entry-level properties (Bottom 25%) see earnings around $1,420, often with potential for optimization.
Average Monthly Airbnb Earnings Trend in Southern Pines
Southern Pines Airbnb Occupancy Rate Trends (2026)
Maximize your bookings by understanding the Southern Pines STR occupancy trends. Seasonal demand shifts significantly influence how often properties are booked. Typically, Julysees the highest demand (peak season occupancy), while January experiences the lowest (low season). Effective strategies, like adjusting minimum stays or offering promotions, can boost occupancy during slower periods. Here's how different property tiers perform in Southern Pines:
- Best-in-class properties (Top 10%) achieve 77%+ occupancy, indicating high desirability and potentially optimized availability.
- Strong performing properties (Top 25%) maintain 64% or higher occupancy, suggesting good market fit and guest satisfaction.
- Typical properties (Median) have an occupancy rate around 45%.
- Entry-level properties (Bottom 25%) average 25% occupancy, potentially facing higher vacancy.
Average Monthly Occupancy Rate Trend in Southern Pines
Average Daily Rate (ADR) Airbnb Trends in Southern Pines (2026)
Effective short term rental pricing strategy in Southern Pines involves understanding monthly ADR fluctuations. The Average Daily Rate (ADR) for Airbnb in Southern Pines typically peaks in June and dips lowest during January. Leveraging Airbnb dynamic pricing tools or strategies based on this seasonality can significantly boost revenue. Here's a look at the typical nightly rates achieved:
- Best-in-class properties (Top 10%) command rates of $648+ per night, often due to premium features or locations.
- Strong performing properties (Top 25%) achieve nightly rates of $299 or more.
- Typical properties (Median) charge around $192 per night.
- Entry-level properties (Bottom 25%) earn around $139 per night.
Average Daily Rate (ADR) Trend by Month in Southern Pines
Get Live Southern Pines Market Intelligence 👇

Explore Real-time Analytics
Airbnb Seasonality Analysis & Trends in Southern Pines (2026)
Peak Season (July, October, November)
- Revenue averages $4,617 per month
- Occupancy rates average 49.4%
- Daily rates average $308
Shoulder Season
- Revenue averages $3,761 per month
- Occupancy maintains around 46.9%
- Daily rates hold near $316
Low Season (January, February, September)
- Revenue drops to average $2,649 per month
- Occupancy decreases to average 37.1%
- Daily rates adjust to average $281
Seasonality Insights for Southern Pines
- The Airbnb seasonality in Southern Pines shows highly seasonal trends requiring careful strategy. While the sections above show seasonal averages, it's also insightful to look at the extremes:
- During the high season, the absolute peak month showcases Southern Pines's highest earning potential, with monthly revenues capable of climbing to $5,129, occupancy reaching a high of 55.0%, and ADRs peaking at $349.
- Conversely, the slowest single month of the year, typically falling within the low season, marks the market's lowest point. In this month, revenue might dip to $2,122, occupancy could drop to 28.8%, and ADRs may adjust down to $270.
- Understanding both the seasonal averages and these monthly peaks and troughs in revenue, occupancy, and ADR is crucial for maximizing your Airbnb profit potential in Southern Pines.
Seasonal Strategies for Maximizing Profit
- Peak Season: Maximize revenue through premium pricing and potentially longer minimum stays. Ensure high availability.
- Low Season: Offer competitive pricing, special promotions (e.g., extended stay discounts), and flexible cancellation policies. Target off-season travelers like remote workers or budget-conscious guests.
- Shoulder Seasons: Implement dynamic pricing that balances peak and low rates. Target weekend travelers or specific events. Offer slightly more flexible terms than peak season.
- Regularly analyze your own performance against these Southern Pines seasonality benchmarks and adjust your pricing and availability strategy accordingly.
Best Areas for Airbnb Investment in Southern Pines (2026)
Exploring the top neighborhoods for short-term rentals in Southern Pines? This section highlights key areas, outlining why they are attractive for hosts and guests, along with notable local attractions. Consider these locations based on your target guest profile and investment strategy.
| Neighborhood / Area | Why Host Here? (Target Guests & Appeal) | Key Attractions & Landmarks |
|---|---|---|
| Downtown Southern Pines | Charming downtown area with unique shops, restaurants, and easy access to local attractions. It's a hub for visitors seeking a quaint, local experience in Southern Pines. | Southern Pines Golf Club, Sandhills Horticultural Gardens, Downtown Shops and Cafes, Southern Pines Train Station, North Carolina Art Museum |
| Pinehurst | Adjacent to Southern Pines, Pinehurst is famous for its golf courses and historic charm. It's perfect for hosting golfers and families visiting the area. | Pinehurst Resort, Pinehurst No. 2 Golf Course, Pinehurst Village, Tufts Archives, Pinehurst Brewery |
| Moore County | Broad area around Southern Pines featuring scenic landscapes and outdoor activities. Appeals to nature lovers and families exploring the Sandhills region. | Weymouth Center for the Arts, Golfing in Moore County, Hiking trails, Local farms and markets, Lake Auman |
| Aberdeen | Nearby town with a mix of charm and convenience. Close enough for guests who want to enjoy Southern Pines while being in a quieter locale. | Aberdeen Lake Park, Historic downtown Aberdeen, Southern Middle School Golf Course, Local shops and eateries |
| Lakeview | Peaceful area known for its scenic views and lakes. Great for guests looking for relaxation and outdoor recreation. | Lakeview Park, Fishing and boating activities, Scenic picnic areas, Nature trails |
| West Southern Pines | A residential area with easy access to both Southern Pines and Pinehurst, perfect for families and larger groups. | Pinehurst Greenway Trail, Historical sites, Local restaurants, Community events |
| Carthage | A bit further out but offers a traditional Southern feel with access to local events and festivals. Good for visitors looking for an authentic experience. | Carthage Historic Courthouse, Local antique shops, Golf courses, Community parks |
| Southern Pines Military Schools | Area surrounding the historic military academies which attracts families and alumni visiting for events. | Military school campuses, Cultural events, Sports events, Community outreach programs |
Understanding Airbnb License Requirements & STR Laws in Southern Pines (2026)
While Southern Pines, North Carolina, United States currently shows low STR regulations, specific Airbnb license requirements might still exist or change. Always verify the latest short term rental regulations and Airbnb license requirements directly with local government authorities for Southern Pines to ensure full compliance before hosting.
(Source: AirROI data, 2026, finding no licensed listings among those analyzed)
Top Performing Airbnb Properties in Southern Pines (2026)
Benchmark your potential! Explore examples of top-performing Airbnb properties in Southern Pinesbased on Trailing Twelve Month (TTM) revenue. Analyze their characteristics, revenue, occupancy rate, and ADR to understand what drives success in this market.
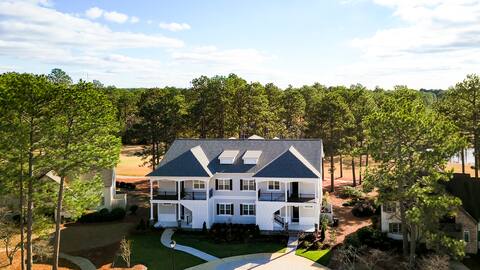
Pinehaven - Luxury Golf Retreat - Sleeps 32
Entire Place • 14 bedrooms
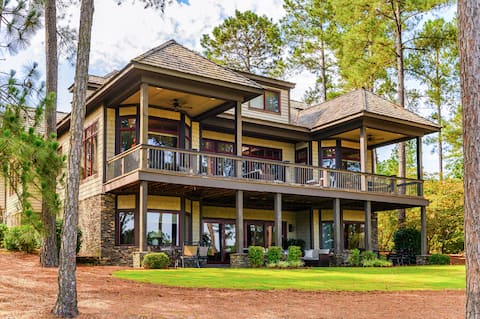
Kenwood Villa - Spectacular Golf Views - Sleeps 22
Entire Place • 8 bedrooms
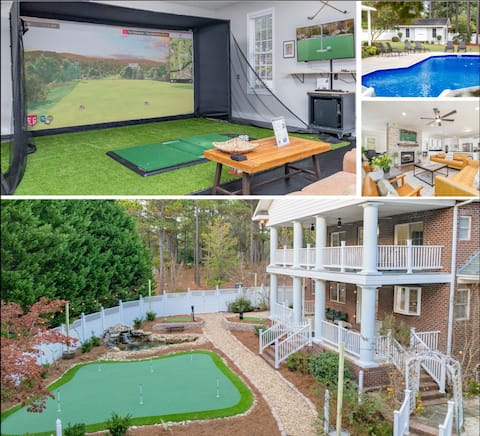
Simulator & Unbeatable Golf Experience On 2 Acres!
Entire Place • 6 bedrooms
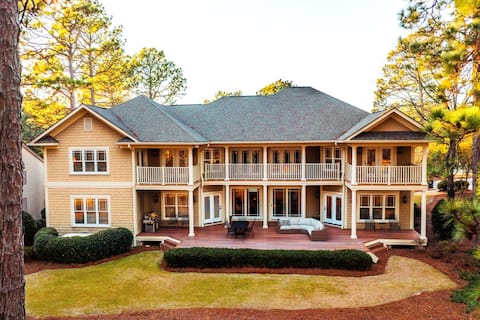
Ramsey Cottage on Pinehurst No 9 - Spectacular️ Go
Entire Place • 6 bedrooms

Insane Golf Retreat & Simulator - Bogey Bunks
Entire Place • 5 bedrooms

Luxurious Pinehurst Home close to everything.
Entire Place • 5 bedrooms
Note: Performance varies based on location, size, amenities, seasonality, and management quality. Data reflects the past 12 months.
Top Performing Airbnb Hosts in Southern Pines (2026)
Learn from the best! This table showcases top-performing Airbnb hosts in Southern Pines based on the number of properties managed and estimated total revenue over the past year. Analyze their scale and performance metrics.
| Host Name | Properties | Grossing Revenue | Stay Reviews | Avg Rating |
|---|---|---|---|---|
| Harry | 3 | $475,633 | 61 | 4.99/5.0 |
| Anthony | 2 | $454,449 | 123 | 4.91/5.0 |
| Chris | 2 | $400,711 | 131 | 5.00/5.0 |
| Damara & Birche | 9 | $352,555 | 449 | 4.93/5.0 |
| Shannyn | 3 | $226,516 | 201 | 4.97/5.0 |
| Evolve | 5 | $206,618 | 218 | 4.86/5.0 |
| Meghan | 5 | $160,114 | 617 | 4.98/5.0 |
| Ameeta | 3 | $143,186 | 118 | 4.99/5.0 |
| Kelly | 3 | $130,255 | 86 | 4.96/5.0 |
| Jessica | 4 | $117,565 | 862 | 4.92/5.0 |
Analyzing the strategies of top hosts, such as their property selection, pricing, and guest communication, can offer valuable lessons for optimizing your own Airbnb operations in Southern Pines.
Dive Deeper: Advanced Southern Pines STR Market Data (2026)
Ready to unlock more insights? AirROI provides access to advanced metrics and comprehensive Airbnb data for Southern Pines. Explore detailed analytics beyond this report to refine your investment strategy, optimize pricing, and maximize your vacation rental profits.
Explore Advanced MetricsSouthern Pines Short-Term Rental Market Composition (2026): Property & Room Types
Room Type Distribution
Property Type Distribution
Market Composition Insights for Southern Pines
- The Southern Pines Airbnb market composition is heavily skewed towards Entire Home/Apt listings, which make up 95.3% of the 190 active rentals. This indicates strong guest preference for privacy and space.
- Looking at the property type distribution in Southern Pines, House properties are the most common (67.4%), reflecting the local real estate landscape.
- Houses represent a significant 67.4% portion, catering likely to families or larger groups.
- The presence of 10% Hotel/Boutique listings indicates integration with traditional hospitality.
- Smaller segments like others, outdoor/unique, unique stays (combined 7.3%) offer potential for unique stay experiences.
Southern Pines Airbnb Room Capacity Analysis (2026): Bedroom Distribution
Distribution of Listings by Number of Bedrooms
Room Capacity Insights for Southern Pines
- The dominant room capacity in Southern Pines is 3 bedrooms listings, making up 27.9% of the market. This suggests a strong demand for properties suitable for families or small groups.
- Together, 3 bedrooms and 1 bedroom properties represent 51.1% of the active Airbnb listings in Southern Pines, indicating a high concentration in these sizes.
- A significant 52.6% of listings offer 3+ bedrooms, catering to larger groups and families seeking more space in Southern Pines.
Southern Pines Vacation Rental Guest Capacity Trends (2026)
Distribution of Listings by Guest Capacity
Guest Capacity Insights for Southern Pines
- The most common guest capacity trend in Southern Pines vacation rentals is listings accommodating 8+ guests (36.3%). This suggests the primary traveler segment is likely larger groups.
- Properties designed for 8+ guests and 6 guests dominate the Southern Pines STR market, accounting for 52.6% of listings.
- 57.3% of properties accommodate 6+ guests, serving the market segment for larger families or group travel in Southern Pines.
- On average, properties in Southern Pines are equipped to host 5.5 guests.
Southern Pines Airbnb Booking Patterns (2026): Available vs. Booked Days
Available Days Distribution
Booked Days Distribution
Booking Pattern Insights for Southern Pines
- The most common availability pattern in Southern Pines falls within the 181-270 days range, representing 38.9% of listings. This suggests many properties have significant open periods on their calendars.
- Approximately 70.5% of listings show high availability (181+ days open annually), indicating potential for increased bookings or specific owner usage patterns.
- For booked days, the 91-180 days range is most frequent in Southern Pines (37.4%), reflecting common guest stay durations or potential owner blocking patterns.
- A notable 31.6% of properties secure long booking periods (181+ days booked per year), highlighting successful long-term rental strategies or significant owner usage.
Southern Pines Airbnb Minimum Stay Requirements Analysis
Distribution of Listings by Minimum Night Requirement
1 Night
49 listings
25.8% of total
2 Nights
63 listings
33.2% of total
3 Nights
8 listings
4.2% of total
4-6 Nights
6 listings
3.2% of total
7-29 Nights
5 listings
2.6% of total
30+ Nights
59 listings
31.1% of total
Key Insights
- The most prevalent minimum stay requirement in Southern Pines is 2 Nights, adopted by 33.2% of listings. This highlights the market's preference for shorter, flexible bookings.
- A significant segment (31.1%) caters to monthly stays (30+ nights) in Southern Pines, pointing to opportunities in the extended-stay market.
Recommendations
- Align with the market by considering a 2 Nights minimum stay, as 33.2% of Southern Pines hosts use this setting.
- If feasible, allowing 1-night stays, especially midweek or during low season, could capture last-minute bookings, as only 25.8% currently do.
- Explore offering discounts for stays of 30+ nights to attract the 31.1% of the market seeking extended stays.
- Adjust minimum nights based on seasonality – potentially shorter during low season and longer during peak demand periods in Southern Pines.
Southern Pines Airbnb Cancellation Policy Trends Analysis (2026)
Super Strict 60 Days
1 listings
0.5% of total
Limited
11 listings
5.8% of total
Super Strict 30 Days
5 listings
2.6% of total
Flexible
33 listings
17.4% of total
Moderate
44 listings
23.2% of total
Firm
75 listings
39.5% of total
Strict
21 listings
11.1% of total
Cancellation Policy Insights for Southern Pines
- The prevailing Airbnb cancellation policy trend in Southern Pines is Firm, used by 39.5% of listings.
- A majority (50.6%) of hosts in Southern Pines utilize Firm or Strict policies, indicating a market where hosts prioritize booking security.
Recommendations for Hosts
- Consider adopting a Firm policy to align with the 39.5% market standard in Southern Pines.
- Using a Strict policy might deter some guests, as only 11.1% of listings use it. Evaluate if potential revenue protection outweighs possible lower booking rates.
- Regularly review your cancellation policy against competitors and market demand shifts in Southern Pines.
Southern Pines STR Booking Lead Time Analysis (2026)
Average Booking Lead Time by Month
Booking Lead Time Insights for Southern Pines
- The overall average booking lead time for vacation rentals in Southern Pines is 47 days.
- Guests book furthest in advance for stays during November (average 61 days), likely coinciding with peak travel demand or local events.
- The shortest booking windows occur for stays in January (average 27 days), indicating more last-minute travel plans during this time.
- Seasonally, Fall (55 days avg.) sees the longest lead times, while Winter (33 days avg.) has the shortest, reflecting typical travel planning cycles.
Recommendations for Hosts
- Use the overall average lead time (47 days) as a baseline for your pricing and availability strategy in Southern Pines.
- For November stays, consider implementing length-of-stay discounts or slightly higher rates for bookings made less than 61 days out to capitalize on advance planning.
- Target marketing efforts for the Fall season well in advance (at least 55 days) to capture early planners.
- Monitor your own booking lead times against these Southern Pines averages to identify opportunities for dynamic pricing adjustments.
Popular & Essential Airbnb Amenities in Southern Pines (2026)
Amenity Prevalence
Amenity Insights for Southern Pines
- Essential amenities in Southern Pines that guests expect include: Air conditioning, Wifi, Smoke alarm, TV. Lacking these (any) could significantly impact bookings.
- Popular amenities like Free parking on premises, Heating, Hot water are common but not universal. Offering these can provide a competitive edge.
Recommendations for Hosts
- Ensure your listing includes all essential amenities for Southern Pines: Air conditioning, Wifi, Smoke alarm, TV.
- Prioritize adding missing essentials: Wifi, Smoke alarm, TV.
- Consider adding popular differentiators like Free parking on premises or Heating to increase appeal.
- Highlight unique or less common amenities you offer (e.g., hot tub, dedicated workspace, EV charger) in your listing description and photos.
- Regularly check competitor amenities in Southern Pines to stay competitive.
Southern Pines Airbnb Guest Demographics & Profile Analysis (2026)
Guest Profile Summary for Southern Pines
- The typical guest profile for Airbnb in Southern Pines consists of primarily domestic travelers (95%), often arriving from nearby Raleigh, typically belonging to the Post-2000s (Gen Z/Alpha) group (50%), primarily speaking English or Spanish.
- Domestic travelers account for 95.4% of guests.
- Key international markets include United States (95.4%) and DC (1.9%).
- Top languages spoken are English (74.7%) followed by Spanish (11.7%).
- A significant demographic segment is the Post-2000s (Gen Z/Alpha) group, representing 50% of guests.
Recommendations for Hosts
- Target domestic marketing efforts towards travelers from Raleigh and Charlotte.
- Tailor amenities and listing descriptions to appeal to the dominant Post-2000s (Gen Z/Alpha) demographic (e.g., highlight fast WiFi, smart home features, local guides).
- Highlight unique local experiences or amenities relevant to the primary guest profile.
- Consider seasonal promotions aligned with peak travel times for key origin markets.
Nearby Short-Term Rental Market Comparison
How does the Southern Pines Airbnb market stack up against its neighbors? Compare key performance metrics like average monthly revenue, ADR, and occupancy rates in surrounding areas to understand the broader regional STR landscape.
| Market | Active Properties | Monthly Revenue | Daily Rate | Avg. Occupancy |
|---|---|---|---|---|
| Denver | 109 | $6,309 | $590.96 | 45% |
| Mooresville | 369 | $5,702 | $559.93 | 42% |
| Sherrills Ford | 107 | $5,615 | $547.26 | 41% |
| Troutman | 49 | $5,587 | $467.90 | 42% |
| Lake Norman of Catawba | 51 | $4,972 | $513.30 | 43% |
| Macon | 45 | $4,003 | $519.11 | 35% |
| Bracey | 51 | $3,814 | $470.46 | 35% |
| Semora | 50 | $3,408 | $377.45 | 38% |
| Boydton | 26 | $3,255 | $356.17 | 37% |
| Cornelius | 75 | $3,195 | $267.36 | 49% |