Smithfield Airbnb Market Analysis 2026: Short Term Rental Data & Vacation Rental Statistics in North Carolina, United States
Is Airbnb profitable in Smithfield in 2026? Explore comprehensive Airbnb analytics for Smithfield, North Carolina, United States to uncover income potential. This 2026 STR market report for Smithfield, based on AirROI data from February 2025 to January 2026, reveals key trends in the niche market of 28 active listings.
Whether you're considering an Airbnb investment in Smithfield, optimizing your existing vacation rental, or exploring rental arbitrage opportunities, understanding the Smithfield Airbnb data is crucial. Leveraging the low regulation environment is key to maximizing your short term rental income potential. Let's dive into the specifics.
Key Smithfield Airbnb Performance Metrics Overview
Monthly Airbnb Revenue Variations & Income Potential in Smithfield (2026)
Understanding the monthly revenue variations for Airbnb listings in Smithfield is key to maximizing your short term rental income potential. Seasonality significantly impacts earnings. Our analysis, based on data from the past 12 months, shows that the peak revenue month for STRs in Smithfield is typically November, while February often presents the lowest earnings, highlighting opportunities for strategic pricing adjustments during shoulder and low seasons. Explore the typical Airbnb income in Smithfield across different performance tiers:
- Best-in-class properties (Top 10%) achieve $4,394+ monthly, often utilizing dynamic pricing and superior guest experiences.
- Strong performing properties (Top 25%) earn $3,476 or more, indicating effective management and desirable locations/amenities.
- Typical properties (Median) generate around $2,479 per month, representing the average market performance.
- Entry-level properties (Bottom 25%) see earnings around $1,192, often with potential for optimization.
Average Monthly Airbnb Earnings Trend in Smithfield
Smithfield Airbnb Occupancy Rate Trends (2026)
Maximize your bookings by understanding the Smithfield STR occupancy trends. Seasonal demand shifts significantly influence how often properties are booked. Typically, Novembersees the highest demand (peak season occupancy), while February experiences the lowest (low season). Effective strategies, like adjusting minimum stays or offering promotions, can boost occupancy during slower periods. Here's how different property tiers perform in Smithfield:
- Best-in-class properties (Top 10%) achieve 83%+ occupancy, indicating high desirability and potentially optimized availability.
- Strong performing properties (Top 25%) maintain 71% or higher occupancy, suggesting good market fit and guest satisfaction.
- Typical properties (Median) have an occupancy rate around 51%.
- Entry-level properties (Bottom 25%) average 25% occupancy, potentially facing higher vacancy.
Average Monthly Occupancy Rate Trend in Smithfield
Average Daily Rate (ADR) Airbnb Trends in Smithfield (2026)
Effective short term rental pricing strategy in Smithfield involves understanding monthly ADR fluctuations. The Average Daily Rate (ADR) for Airbnb in Smithfield typically peaks in October and dips lowest during March. Leveraging Airbnb dynamic pricing tools or strategies based on this seasonality can significantly boost revenue. Here's a look at the typical nightly rates achieved:
- Best-in-class properties (Top 10%) command rates of $232+ per night, often due to premium features or locations.
- Strong performing properties (Top 25%) achieve nightly rates of $179 or more.
- Typical properties (Median) charge around $142 per night.
- Entry-level properties (Bottom 25%) earn around $114 per night.
Average Daily Rate (ADR) Trend by Month in Smithfield
Get Live Smithfield Market Intelligence 👇

Explore Real-time Analytics
Airbnb Seasonality Analysis & Trends in Smithfield (2026)
Peak Season (November, October, July)
- Revenue averages $2,955 per month
- Occupancy rates average 57.0%
- Daily rates average $160
Shoulder Season
- Revenue averages $2,521 per month
- Occupancy maintains around 48.5%
- Daily rates hold near $150
Low Season (February, April, September)
- Revenue drops to average $1,941 per month
- Occupancy decreases to average 44.4%
- Daily rates adjust to average $140
Seasonality Insights for Smithfield
- The Airbnb seasonality in Smithfield shows moderate seasonality with distinct peak and low periods. While the sections above show seasonal averages, it's also insightful to look at the extremes:
- During the high season, the absolute peak month showcases Smithfield's highest earning potential, with monthly revenues capable of climbing to $3,009, occupancy reaching a high of 60.6%, and ADRs peaking at $167.
- Conversely, the slowest single month of the year, typically falling within the low season, marks the market's lowest point. In this month, revenue might dip to $1,538, occupancy could drop to 39.9%, and ADRs may adjust down to $133.
- Understanding both the seasonal averages and these monthly peaks and troughs in revenue, occupancy, and ADR is crucial for maximizing your Airbnb profit potential in Smithfield.
Seasonal Strategies for Maximizing Profit
- Peak Season: Maximize revenue through premium pricing and potentially longer minimum stays. Ensure high availability.
- Low Season: Offer competitive pricing, special promotions (e.g., extended stay discounts), and flexible cancellation policies. Target off-season travelers like remote workers or budget-conscious guests.
- Shoulder Seasons: Implement dynamic pricing that balances peak and low rates. Target weekend travelers or specific events. Offer slightly more flexible terms than peak season.
- Regularly analyze your own performance against these Smithfield seasonality benchmarks and adjust your pricing and availability strategy accordingly.
Best Areas for Airbnb Investment in Smithfield (2026)
Exploring the top neighborhoods for short-term rentals in Smithfield? This section highlights key areas, outlining why they are attractive for hosts and guests, along with notable local attractions. Consider these locations based on your target guest profile and investment strategy.
| Neighborhood / Area | Why Host Here? (Target Guests & Appeal) | Key Attractions & Landmarks |
|---|---|---|
| Downtown Smithfield | The heart of Smithfield, offering a mix of historic charm and modern amenities. Perfect for families and travelers seeking a small-town experience with local dining and shopping options. | Smithfield Market, Johnston County Heritage Center, Downtown Smithfield, The Country Doctor Museum, Local restaurants and shops |
| Smithfield Historic District | A quaint area filled with historic homes and beautiful architecture. Great for visitors interested in history and Southern charm, making it a prime spot for unique Airbnb stays. | Historic homes, Local tours, Civil War sites, Art galleries, Smithfield's annual festivals |
| Shady Grove | A peaceful suburban area ideal for families and longer-term stays. Offers access to parks and recreational facilities, perfect for visitors looking for a quiet retreat. | Shady Grove Park, Nearby hiking trails, Family-friendly environment, Fishing spots, Local playgrounds |
| Four Oaks | Just a short drive from Smithfield, this small town offers a peaceful country atmosphere. Great for travelers looking for a rural experience with proximity to urban amenities. | Rural landscape, Local farms, Amish community, Community events, Access to Interstate 95 |
| Selma | Located nearby, Selma's charm and local attractions make it a worthwhile Airbnb market. It's a gateway for travelers exploring the greater Johnston County area. | Historic downtown Selma, Railroad Museum, Local antique shops, Annual events, Access to the Neuse River |
| Clayton | A rapidly growing suburb with a vibrant downtown area. Close to Smithfield, this spot is popular among young families and professionals. | Clayton Community Park, Historic Clayton, Local breweries and eateries, Annual Clayton Harvest Festival, Outdoor activities |
| Benson | A small town with Southern hospitality, offering a quiet experience for visitors. Known for its close-knit community and local events throughout the year. | Local events, Annual Mule Days festival, Benson Museum, Parks and recreation, Community markets |
| Micro | A tiny town near Smithfield that offers a unique small-town experience. Ideal for those wanting to escape the hustle and bustle of larger towns. | Micro Park, Local diners, Quaint shops, Community events, Quiet atmosphere |
Understanding Airbnb License Requirements & STR Laws in Smithfield (2026)
While Smithfield, North Carolina, United States currently shows low STR regulations, specific Airbnb license requirements might still exist or change. Always verify the latest short term rental regulations and Airbnb license requirements directly with local government authorities for Smithfield to ensure full compliance before hosting.
(Source: AirROI data, 2026, finding no licensed listings among those analyzed)
Top Performing Airbnb Properties in Smithfield (2026)
Benchmark your potential! Explore examples of top-performing Airbnb properties in Smithfieldbased on Trailing Twelve Month (TTM) revenue. Analyze their characteristics, revenue, occupancy rate, and ADR to understand what drives success in this market.
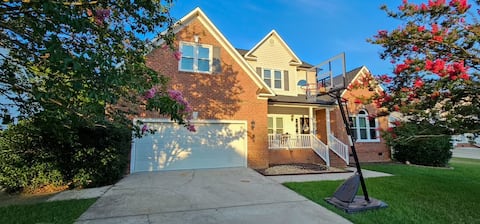
Cozy Suburban Retreat in Smithfield - Off I-95
Entire Place • 5 bedrooms
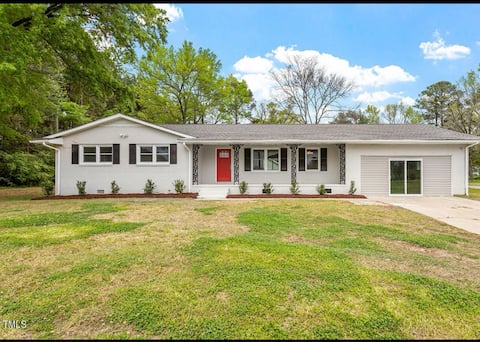
3BR/2BA - Fenced - Near I-95 & Outlets
Entire Place • 3 bedrooms

Sherman's Retreat on Buck's Pond
Entire Place • 2 bedrooms
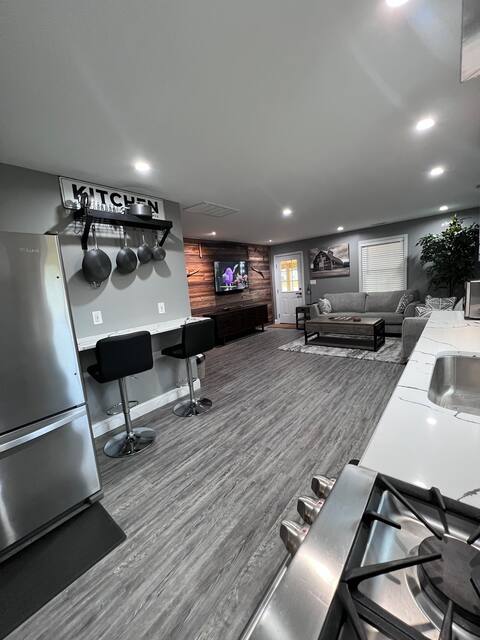
50 shades of grey
Entire Place • 2 bedrooms
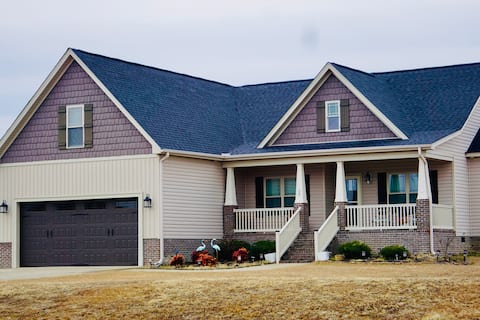
Rare Find! 4BR/3BA Farmhouse minutes from Outlets
Entire Place • 4 bedrooms

2BR Retro Duplex Off I-95 Close To Outlets
Entire Place • 2 bedrooms
Note: Performance varies based on location, size, amenities, seasonality, and management quality. Data reflects the past 12 months.
Top Performing Airbnb Hosts in Smithfield (2026)
Learn from the best! This table showcases top-performing Airbnb hosts in Smithfield based on the number of properties managed and estimated total revenue over the past year. Analyze their scale and performance metrics.
| Host Name | Properties | Grossing Revenue | Stay Reviews | Avg Rating |
|---|---|---|---|---|
| Troy | 4 | $154,072 | 116 | 4.90/5.0 |
| Raj | 1 | $47,126 | 45 | 4.80/5.0 |
| Betsy And David | 1 | $44,489 | 24 | 4.96/5.0 |
| Mark | 1 | $41,296 | 238 | 4.98/5.0 |
| Gurjinder | 1 | $41,221 | 67 | 5.00/5.0 |
| Franquil | 1 | $34,409 | 68 | 4.99/5.0 |
| Saudy | 2 | $33,182 | 59 | 4.88/5.0 |
| Elenny | 1 | $30,237 | 250 | 4.93/5.0 |
| Gemma | 2 | $28,688 | 126 | 4.86/5.0 |
| Sydney | 1 | $23,541 | 53 | 4.85/5.0 |
Analyzing the strategies of top hosts, such as their property selection, pricing, and guest communication, can offer valuable lessons for optimizing your own Airbnb operations in Smithfield.
Dive Deeper: Advanced Smithfield STR Market Data (2026)
Ready to unlock more insights? AirROI provides access to advanced metrics and comprehensive Airbnb data for Smithfield. Explore detailed analytics beyond this report to refine your investment strategy, optimize pricing, and maximize your vacation rental profits.
Explore Advanced MetricsSmithfield Short-Term Rental Market Composition (2026): Property & Room Types
Room Type Distribution
Property Type Distribution
Market Composition Insights for Smithfield
- The Smithfield Airbnb market composition is heavily skewed towards Entire Home/Apt listings, which make up 92.9% of the 28 active rentals. This indicates strong guest preference for privacy and space.
- Looking at the property type distribution in Smithfield, House properties are the most common (82.1%), reflecting the local real estate landscape.
- Houses represent a significant 82.1% portion, catering likely to families or larger groups.
- Smaller segments like hotel/boutique, outdoor/unique (combined 7.2%) offer potential for unique stay experiences.
Smithfield Airbnb Room Capacity Analysis (2026): Bedroom Distribution
Distribution of Listings by Number of Bedrooms
Room Capacity Insights for Smithfield
- The dominant room capacity in Smithfield is 2 bedrooms listings, making up 50% of the market. This suggests a strong demand for properties suitable for couples or solo travelers.
- Together, 2 bedrooms and 3 bedrooms properties represent 75.0% of the active Airbnb listings in Smithfield, indicating a high concentration in these sizes.
- A significant 35.7% of listings offer 3+ bedrooms, catering to larger groups and families seeking more space in Smithfield.
Smithfield Vacation Rental Guest Capacity Trends (2026)
Distribution of Listings by Guest Capacity
Guest Capacity Insights for Smithfield
- The most common guest capacity trend in Smithfield vacation rentals is listings accommodating 4 guests (28.6%). This suggests the primary traveler segment is likely small families or groups.
- Properties designed for 4 guests and 6 guests dominate the Smithfield STR market, accounting for 57.2% of listings.
- 50.0% of properties accommodate 6+ guests, serving the market segment for larger families or group travel in Smithfield.
- On average, properties in Smithfield are equipped to host 5.2 guests.
Smithfield Airbnb Booking Patterns (2026): Available vs. Booked Days
Available Days Distribution
Booked Days Distribution
Booking Pattern Insights for Smithfield
- The most common availability pattern in Smithfield falls within the 181-270 days range, representing 39.3% of listings. This suggests many properties have significant open periods on their calendars.
- Approximately 64.3% of listings show high availability (181+ days open annually), indicating potential for increased bookings or specific owner usage patterns.
- For booked days, the 91-180 days range is most frequent in Smithfield (39.3%), reflecting common guest stay durations or potential owner blocking patterns.
- A notable 35.7% of properties secure long booking periods (181+ days booked per year), highlighting successful long-term rental strategies or significant owner usage.
Smithfield Airbnb Minimum Stay Requirements Analysis
Distribution of Listings by Minimum Night Requirement
1 Night
8 listings
28.6% of total
2 Nights
11 listings
39.3% of total
3 Nights
1 listings
3.6% of total
4-6 Nights
1 listings
3.6% of total
7-29 Nights
1 listings
3.6% of total
30+ Nights
6 listings
21.4% of total
Key Insights
- The most prevalent minimum stay requirement in Smithfield is 2 Nights, adopted by 39.3% of listings. This highlights the market's preference for shorter, flexible bookings.
- A strong majority (67.9%) of the Smithfield Airbnb data shows acceptance of very short stays (1-2 nights), indicating a dynamic, high-turnover market.
- A significant segment (21.4%) caters to monthly stays (30+ nights) in Smithfield, pointing to opportunities in the extended-stay market.
Recommendations
- Align with the market by considering a 2 Nights minimum stay, as 39.3% of Smithfield hosts use this setting.
- If feasible, allowing 1-night stays, especially midweek or during low season, could capture last-minute bookings, as only 28.6% currently do.
- Explore offering discounts for stays of 30+ nights to attract the 21.4% of the market seeking extended stays.
- Adjust minimum nights based on seasonality – potentially shorter during low season and longer during peak demand periods in Smithfield.
Smithfield Airbnb Cancellation Policy Trends Analysis (2026)
Flexible
10 listings
37% of total
Moderate
8 listings
29.6% of total
Firm
9 listings
33.3% of total
Cancellation Policy Insights for Smithfield
- The prevailing Airbnb cancellation policy trend in Smithfield is Flexible, used by 37% of listings.
- There's a relatively balanced mix between guest-friendly (66.6%) and stricter (33.3%) policies, offering choices for different guest needs.
Recommendations for Hosts
- Consider adopting a Flexible policy to align with the 37% market standard in Smithfield.
- Regularly review your cancellation policy against competitors and market demand shifts in Smithfield.
Smithfield STR Booking Lead Time Analysis (2026)
Average Booking Lead Time by Month
Booking Lead Time Insights for Smithfield
- The overall average booking lead time for vacation rentals in Smithfield is 26 days.
- Guests book furthest in advance for stays during November (average 39 days), likely coinciding with peak travel demand or local events.
- The shortest booking windows occur for stays in January (average 13 days), indicating more last-minute travel plans during this time.
- Seasonally, Fall (35 days avg.) sees the longest lead times, while Winter (22 days avg.) has the shortest, reflecting typical travel planning cycles.
Recommendations for Hosts
- Use the overall average lead time (26 days) as a baseline for your pricing and availability strategy in Smithfield.
- For November stays, consider implementing length-of-stay discounts or slightly higher rates for bookings made less than 39 days out to capitalize on advance planning.
- During January, focus on last-minute booking availability and promotions, as guests book with very short notice (13 days avg.).
- Target marketing efforts for the Fall season well in advance (at least 35 days) to capture early planners.
- Monitor your own booking lead times against these Smithfield averages to identify opportunities for dynamic pricing adjustments.
Popular & Essential Airbnb Amenities in Smithfield (2026)
Amenity Prevalence
Amenity Insights for Smithfield
- Essential amenities in Smithfield that guests expect include: TV, Wifi, Air conditioning, Heating, Hot water, Smoke alarm, Free parking on premises. Lacking these (any) could significantly impact bookings.
- Popular amenities like Kitchen, Coffee maker, Washer are common but not universal. Offering these can provide a competitive edge.
Recommendations for Hosts
- Ensure your listing includes all essential amenities for Smithfield: TV, Wifi, Air conditioning, Heating, Hot water, Smoke alarm, Free parking on premises.
- Prioritize adding missing essentials: Smoke alarm, Free parking on premises.
- Consider adding popular differentiators like Kitchen or Coffee maker to increase appeal.
- Highlight unique or less common amenities you offer (e.g., hot tub, dedicated workspace, EV charger) in your listing description and photos.
- Regularly check competitor amenities in Smithfield to stay competitive.
Smithfield Airbnb Guest Demographics & Profile Analysis (2026)
Guest Profile Summary for Smithfield
- The typical guest profile for Airbnb in Smithfield consists of primarily domestic travelers (98%), often arriving from nearby Charlotte, typically belonging to the Post-2000s (Gen Z/Alpha) group (50%), primarily speaking English or Spanish.
- Domestic travelers account for 98.1% of guests.
- Key international markets include United States (98.1%) and Canada (0.8%).
- Top languages spoken are English (76.1%) followed by Spanish (17.9%).
- A significant demographic segment is the Post-2000s (Gen Z/Alpha) group, representing 50% of guests.
Recommendations for Hosts
- Target domestic marketing efforts towards travelers from Charlotte and Raleigh.
- Tailor amenities and listing descriptions to appeal to the dominant Post-2000s (Gen Z/Alpha) demographic (e.g., highlight fast WiFi, smart home features, local guides).
- Highlight unique local experiences or amenities relevant to the primary guest profile.
- Consider seasonal promotions aligned with peak travel times for key origin markets.
Nearby Short-Term Rental Market Comparison
How does the Smithfield Airbnb market stack up against its neighbors? Compare key performance metrics like average monthly revenue, ADR, and occupancy rates in surrounding areas to understand the broader regional STR landscape.
| Market | Active Properties | Monthly Revenue | Daily Rate | Avg. Occupancy |
|---|---|---|---|---|
| Wrightsville Beach | 497 | $4,620 | $531.11 | 39% |
| Littleton | 133 | $4,152 | $483.40 | 38% |
| Macon | 45 | $4,003 | $519.11 | 35% |
| Bracey | 51 | $3,814 | $470.46 | 35% |
| Cedar Point | 30 | $3,725 | $310.88 | 49% |
| Emerald Isle | 510 | $3,693 | $392.93 | 42% |
| Henrico | 78 | $3,576 | $472.35 | 38% |
| North Topsail Beach | 946 | $3,533 | $428.67 | 39% |
| Surf City | 737 | $3,518 | $389.38 | 39% |
| Semora | 50 | $3,408 | $377.45 | 38% |