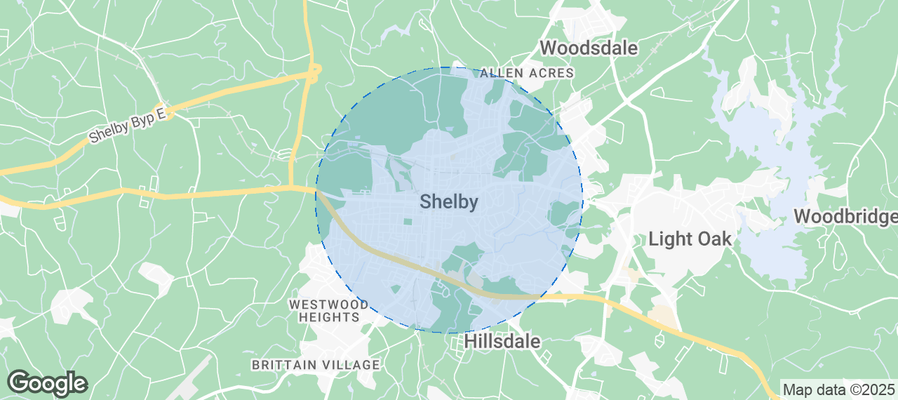
Shelby Airbnb Market Analysis 2026: Short Term Rental Data & Vacation Rental Statistics in North Carolina, United States
Is Airbnb profitable in Shelby in 2026? Explore comprehensive Airbnb analytics for Shelby, North Carolina, United States to uncover income potential. This 2026 STR market report for Shelby, based on AirROI data from February 2025 to January 2026, reveals key trends in the niche market of 27 active listings.
Whether you're considering an Airbnb investment in Shelby, optimizing your existing vacation rental, or exploring rental arbitrage opportunities, understanding the Shelby Airbnb data is crucial. Leveraging the low regulation environment is key to maximizing your short term rental income potential. Let's dive into the specifics.
Key Shelby Airbnb Performance Metrics Overview
Monthly Airbnb Revenue Variations & Income Potential in Shelby (2026)
Understanding the monthly revenue variations for Airbnb listings in Shelby is key to maximizing your short term rental income potential. Seasonality significantly impacts earnings. Our analysis, based on data from the past 12 months, shows that the peak revenue month for STRs in Shelby is typically July, while December often presents the lowest earnings, highlighting opportunities for strategic pricing adjustments during shoulder and low seasons. Explore the typical Airbnb income in Shelby across different performance tiers:
- Best-in-class properties (Top 10%) achieve $4,064+ monthly, often utilizing dynamic pricing and superior guest experiences.
- Strong performing properties (Top 25%) earn $2,794 or more, indicating effective management and desirable locations/amenities.
- Typical properties (Median) generate around $1,866 per month, representing the average market performance.
- Entry-level properties (Bottom 25%) see earnings around $1,041, often with potential for optimization.
Average Monthly Airbnb Earnings Trend in Shelby
Shelby Airbnb Occupancy Rate Trends (2026)
Maximize your bookings by understanding the Shelby STR occupancy trends. Seasonal demand shifts significantly influence how often properties are booked. Typically, Marchsees the highest demand (peak season occupancy), while December experiences the lowest (low season). Effective strategies, like adjusting minimum stays or offering promotions, can boost occupancy during slower periods. Here's how different property tiers perform in Shelby:
- Best-in-class properties (Top 10%) achieve 72%+ occupancy, indicating high desirability and potentially optimized availability.
- Strong performing properties (Top 25%) maintain 53% or higher occupancy, suggesting good market fit and guest satisfaction.
- Typical properties (Median) have an occupancy rate around 32%.
- Entry-level properties (Bottom 25%) average 17% occupancy, potentially facing higher vacancy.
Average Monthly Occupancy Rate Trend in Shelby
Average Daily Rate (ADR) Airbnb Trends in Shelby (2026)
Effective short term rental pricing strategy in Shelby involves understanding monthly ADR fluctuations. The Average Daily Rate (ADR) for Airbnb in Shelby typically peaks in September and dips lowest during March. Leveraging Airbnb dynamic pricing tools or strategies based on this seasonality can significantly boost revenue. Here's a look at the typical nightly rates achieved:
- Best-in-class properties (Top 10%) command rates of $388+ per night, often due to premium features or locations.
- Strong performing properties (Top 25%) achieve nightly rates of $230 or more.
- Typical properties (Median) charge around $166 per night.
- Entry-level properties (Bottom 25%) earn around $134 per night.
Average Daily Rate (ADR) Trend by Month in Shelby
Get Live Shelby Market Intelligence 👇
Explore Real-time Analytics
Airbnb Seasonality Analysis & Trends in Shelby (2026)
Peak Season (July, March, August)
- Revenue averages $2,712 per month
- Occupancy rates average 41.3%
- Daily rates average $223
Shoulder Season
- Revenue averages $2,392 per month
- Occupancy maintains around 38.1%
- Daily rates hold near $229
Low Season (January, September, December)
- Revenue drops to average $1,645 per month
- Occupancy decreases to average 29.8%
- Daily rates adjust to average $238
Seasonality Insights for Shelby
- The Airbnb seasonality in Shelby shows moderate seasonality with distinct peak and low periods. While the sections above show seasonal averages, it's also insightful to look at the extremes:
- During the high season, the absolute peak month showcases Shelby's highest earning potential, with monthly revenues capable of climbing to $2,902, occupancy reaching a high of 51.6%, and ADRs peaking at $251.
- Conversely, the slowest single month of the year, typically falling within the low season, marks the market's lowest point. In this month, revenue might dip to $1,502, occupancy could drop to 27.1%, and ADRs may adjust down to $217.
- Understanding both the seasonal averages and these monthly peaks and troughs in revenue, occupancy, and ADR is crucial for maximizing your Airbnb profit potential in Shelby.
Seasonal Strategies for Maximizing Profit
- Peak Season: Maximize revenue through premium pricing and potentially longer minimum stays. Ensure high availability.
- Low Season: Offer competitive pricing, special promotions (e.g., extended stay discounts), and flexible cancellation policies. Target off-season travelers like remote workers or budget-conscious guests.
- Shoulder Seasons: Implement dynamic pricing that balances peak and low rates. Target weekend travelers or specific events. Offer slightly more flexible terms than peak season.
- Regularly analyze your own performance against these Shelby seasonality benchmarks and adjust your pricing and availability strategy accordingly.
Best Areas for Airbnb Investment in Shelby (2026)
Exploring the top neighborhoods for short-term rentals in Shelby? This section highlights key areas, outlining why they are attractive for hosts and guests, along with notable local attractions. Consider these locations based on your target guest profile and investment strategy.
| Neighborhood / Area | Why Host Here? (Target Guests & Appeal) | Key Attractions & Landmarks |
|---|---|---|
| Downtown Shelby | The heart of Shelby with vibrant local dining, shops, and events. A great location for guests wanting to explore local culture and community. | Cleveland County Arts Council, Shelby City Park, Historic Court Square, Don Gibson Theatre, Local eateries and shops |
| Cleveland County | Rural charm with local attractions and outdoor activities. Ideal for those seeking a tranquil stay amidst nature and small-town hospitality. | Crowders Mountain State Park, Kings Mountain National Military Park, Local farms and festivals, Cleveland County History Museum |
| Boiling Springs | A quaint neighborhood hosting Gardner-Webb University. Perfect for visitors related to the university and local sports events. | Gardner-Webb University, Local dining and cafes, Nearby parks and recreational areas |
| Fairview Park | A residential area close to downtown with family-friendly parks and amenities. Great for families visiting Shelby. | Fairview Park, Local sports complexes, Children's playgrounds |
| Crestview | Quiet suburban area with a mix of residents and invite for families. Attractive for longer stays and family vacations. | Local parks, Nearby shopping centers, Community events |
| Lattimore | A small town with a strong sense of community, ideal for visitors looking to explore rural America and local history. | Historic homes, Local festivals, Community parks |
| South Shelby | An upcoming area with new developments and local flavor. Offers a unique and authentic experience of Shelby. | Local eateries, Shelby Historic District, Community events |
| North Shelby | A growing area with access to nature and suburban convenience. Close proximity to main highways for easy travel. | Nearby lakes, Local parks, Shopping and dining options |
Understanding Airbnb License Requirements & STR Laws in Shelby (2026)
While Shelby, North Carolina, United States currently shows low STR regulations, specific Airbnb license requirements might still exist or change. Always verify the latest short term rental regulations and Airbnb license requirements directly with local government authorities for Shelby to ensure full compliance before hosting.
(Source: AirROI data, 2026, finding no licensed listings among those analyzed)
Top Performing Airbnb Properties in Shelby (2026)
Benchmark your potential! Explore examples of top-performing Airbnb properties in Shelbybased on Trailing Twelve Month (TTM) revenue. Analyze their characteristics, revenue, occupancy rate, and ADR to understand what drives success in this market.
Windsor Place
Entire Place • 6 bedrooms
3 Bedroom in Downtown Shelby
Entire Place • 3 bedrooms
Cozy Private Farm House w Master Suite Near Shelby
Entire Place • 4 bedrooms

Secluded creekside treehouse with hot tub
Entire Place • 1 bedroom
Beautifully restored country estate near GWU
Entire Place • 2 bedrooms

Shelby’s Hideaway
Entire Place • 4 bedrooms
Note: Performance varies based on location, size, amenities, seasonality, and management quality. Data reflects the past 12 months.
Top Performing Airbnb Hosts in Shelby (2026)
Learn from the best! This table showcases top-performing Airbnb hosts in Shelby based on the number of properties managed and estimated total revenue over the past year. Analyze their scale and performance metrics.
| Host Name | Properties | Grossing Revenue | Stay Reviews | Avg Rating |
|---|---|---|---|---|
| Elizabeth | 1 | $81,684 | 8 | 4.88/5.0 |
| Mickey | 3 | $65,701 | 377 | 4.98/5.0 |
| Donna | 2 | $59,416 | 364 | 4.90/5.0 |
| Paris | 1 | $36,469 | 62 | 4.76/5.0 |
| Courtney | 2 | $35,856 | 98 | 4.87/5.0 |
| Angela | 1 | $35,033 | 15 | 5.00/5.0 |
| Heather | 1 | $29,026 | 13 | 4.92/5.0 |
| Chad | 1 | $28,795 | 25 | 5.00/5.0 |
| Shelley | 1 | $27,989 | 29 | 4.90/5.0 |
| Empire Dreams | 1 | $16,646 | 5 | 5.00/5.0 |
Analyzing the strategies of top hosts, such as their property selection, pricing, and guest communication, can offer valuable lessons for optimizing your own Airbnb operations in Shelby.
Dive Deeper: Advanced Shelby STR Market Data (2026)
Ready to unlock more insights? AirROI provides access to advanced metrics and comprehensive Airbnb data for Shelby. Explore detailed analytics beyond this report to refine your investment strategy, optimize pricing, and maximize your vacation rental profits.
Explore Advanced MetricsShelby Short-Term Rental Market Composition (2026): Property & Room Types
Room Type Distribution
Property Type Distribution
Market Composition Insights for Shelby
- The Shelby Airbnb market composition is heavily skewed towards Entire Home/Apt listings, which make up 81.5% of the 27 active rentals. This indicates strong guest preference for privacy and space.
- Looking at the property type distribution in Shelby, House properties are the most common (70.4%), reflecting the local real estate landscape.
- Houses represent a significant 70.4% portion, catering likely to families or larger groups.
- The presence of 11.1% Hotel/Boutique listings indicates integration with traditional hospitality.
- Smaller segments like apartment/condo, outdoor/unique, others (combined 11.1%) offer potential for unique stay experiences.
Shelby Airbnb Room Capacity Analysis (2026): Bedroom Distribution
Distribution of Listings by Number of Bedrooms
Room Capacity Insights for Shelby
- The dominant room capacity in Shelby is 3 bedrooms listings, making up 29.6% of the market. This suggests a strong demand for properties suitable for families or small groups.
- Together, 3 bedrooms and 1 bedroom properties represent 51.8% of the active Airbnb listings in Shelby, indicating a high concentration in these sizes.
- A significant 55.5% of listings offer 3+ bedrooms, catering to larger groups and families seeking more space in Shelby.
Shelby Vacation Rental Guest Capacity Trends (2026)
Distribution of Listings by Guest Capacity
Guest Capacity Insights for Shelby
- The most common guest capacity trend in Shelby vacation rentals is listings accommodating 6 guests (29.6%). This suggests the primary traveler segment is likely larger groups.
- Properties designed for 6 guests and 8+ guests dominate the Shelby STR market, accounting for 51.8% of listings.
- 55.5% of properties accommodate 6+ guests, serving the market segment for larger families or group travel in Shelby.
- On average, properties in Shelby are equipped to host 4.7 guests.
Shelby Airbnb Booking Patterns (2026): Available vs. Booked Days
Available Days Distribution
Booked Days Distribution
Booking Pattern Insights for Shelby
- The most common availability pattern in Shelby falls within the 271-366 days range, representing 59.3% of listings. This suggests many properties have significant open periods on their calendars.
- Approximately 85.2% of listings show high availability (181+ days open annually), indicating potential for increased bookings or specific owner usage patterns.
- For booked days, the 31-90 days range is most frequent in Shelby (29.6%), reflecting common guest stay durations or potential owner blocking patterns.
- A notable 14.8% of properties secure long booking periods (181+ days booked per year), highlighting successful long-term rental strategies or significant owner usage.
Shelby Airbnb Minimum Stay Requirements Analysis
Distribution of Listings by Minimum Night Requirement
1 Night
11 listings
40.7% of total
2 Nights
7 listings
25.9% of total
3 Nights
2 listings
7.4% of total
7-29 Nights
1 listings
3.7% of total
30+ Nights
6 listings
22.2% of total
Key Insights
- The most prevalent minimum stay requirement in Shelby is 1 Night, adopted by 40.7% of listings. This highlights the market's preference for shorter, flexible bookings.
- A strong majority (66.6%) of the Shelby Airbnb data shows acceptance of very short stays (1-2 nights), indicating a dynamic, high-turnover market.
- A significant segment (22.2%) caters to monthly stays (30+ nights) in Shelby, pointing to opportunities in the extended-stay market.
Recommendations
- Align with the market by considering a 1 Night minimum stay, as 40.7% of Shelby hosts use this setting.
- Explore offering discounts for stays of 30+ nights to attract the 22.2% of the market seeking extended stays.
- Adjust minimum nights based on seasonality – potentially shorter during low season and longer during peak demand periods in Shelby.
Shelby Airbnb Cancellation Policy Trends Analysis (2026)
Limited
1 listings
3.7% of total
Flexible
10 listings
37% of total
Moderate
12 listings
44.4% of total
Firm
2 listings
7.4% of total
Strict
2 listings
7.4% of total
Cancellation Policy Insights for Shelby
- The prevailing Airbnb cancellation policy trend in Shelby is Moderate, used by 44.4% of listings.
- The market strongly favors guest-friendly terms, with 81.4% of listings offering Flexible or Moderate policies. This suggests guests in Shelby may expect booking flexibility.
- Strict cancellation policies are quite rare (7.4%), potentially making listings with this policy less competitive unless justified by high demand or property type.
Recommendations for Hosts
- Consider adopting a Moderate policy to align with the 44.4% market standard in Shelby.
- Using a Strict policy might deter some guests, as only 7.4% of listings use it. Evaluate if potential revenue protection outweighs possible lower booking rates.
- Regularly review your cancellation policy against competitors and market demand shifts in Shelby.
Shelby STR Booking Lead Time Analysis (2026)
Average Booking Lead Time by Month
Booking Lead Time Insights for Shelby
- The overall average booking lead time for vacation rentals in Shelby is 42 days.
- Guests book furthest in advance for stays during October (average 74 days), likely coinciding with peak travel demand or local events.
- The shortest booking windows occur for stays in March (average 24 days), indicating more last-minute travel plans during this time.
- Seasonally, Fall (64 days avg.) sees the longest lead times, while Winter (32 days avg.) has the shortest, reflecting typical travel planning cycles.
Recommendations for Hosts
- Use the overall average lead time (42 days) as a baseline for your pricing and availability strategy in Shelby.
- For October stays, consider implementing length-of-stay discounts or slightly higher rates for bookings made less than 74 days out to capitalize on advance planning.
- Target marketing efforts for the Fall season well in advance (at least 64 days) to capture early planners.
- Monitor your own booking lead times against these Shelby averages to identify opportunities for dynamic pricing adjustments.
Popular & Essential Airbnb Amenities in Shelby (2026)
Amenity Prevalence
Amenity Insights for Shelby
- Essential amenities in Shelby that guests expect include: Free parking on premises, Air conditioning, Wifi, Smoke alarm, TV. Lacking these (any) could significantly impact bookings.
- Popular amenities like Heating, Kitchen, Hot water are common but not universal. Offering these can provide a competitive edge.
Recommendations for Hosts
- Ensure your listing includes all essential amenities for Shelby: Free parking on premises, Air conditioning, Wifi, Smoke alarm, TV.
- Prioritize adding missing essentials: Smoke alarm, TV.
- Consider adding popular differentiators like Heating or Kitchen to increase appeal.
- Highlight unique or less common amenities you offer (e.g., hot tub, dedicated workspace, EV charger) in your listing description and photos.
- Regularly check competitor amenities in Shelby to stay competitive.
Shelby Airbnb Guest Demographics & Profile Analysis (2026)
Guest Profile Summary for Shelby
- The typical guest profile for Airbnb in Shelby consists of primarily domestic travelers (96%), often arriving from nearby Charlotte, typically belonging to the Post-2000s (Gen Z/Alpha) group (50%), primarily speaking English or Spanish.
- Domestic travelers account for 96.4% of guests.
- Key international markets include United States (96.4%) and Canada (1.6%).
- Top languages spoken are English (80.9%) followed by Spanish (10.1%).
- A significant demographic segment is the Post-2000s (Gen Z/Alpha) group, representing 50% of guests.
Recommendations for Hosts
- Target domestic marketing efforts towards travelers from Charlotte and New Lenox.
- Tailor amenities and listing descriptions to appeal to the dominant Post-2000s (Gen Z/Alpha) demographic (e.g., highlight fast WiFi, smart home features, local guides).
- Highlight unique local experiences or amenities relevant to the primary guest profile.
- Consider seasonal promotions aligned with peak travel times for key origin markets.
Nearby Short-Term Rental Market Comparison
How does the Shelby Airbnb market stack up against its neighbors? Compare key performance metrics like average monthly revenue, ADR, and occupancy rates in surrounding areas to understand the broader regional STR landscape.
| Market | Active Properties | Monthly Revenue | Daily Rate | Avg. Occupancy |
|---|---|---|---|---|
| Denver | 109 | $6,309 | $590.96 | 45% |
| Catawba | 16 | $6,093 | $582.49 | 38% |
| Mooresville | 369 | $5,702 | $559.93 | 42% |
| Sherrills Ford | 107 | $5,615 | $547.26 | 41% |
| Troutman | 49 | $5,587 | $467.90 | 42% |
| Lake Norman of Catawba | 51 | $4,972 | $513.30 | 43% |
| Union Mills | 15 | $4,938 | $442.76 | 41% |
| Six Mile | 57 | $4,396 | $449.78 | 42% |
| West Union | 30 | $4,126 | $564.92 | 32% |
| Chapin | 93 | $3,971 | $386.37 | 43% |