Scaly Mountain Airbnb Market Analysis 2026: Short Term Rental Data & Vacation Rental Statistics in North Carolina, United States
Is Airbnb profitable in Scaly Mountain in 2026? Explore comprehensive Airbnb analytics for Scaly Mountain, North Carolina, United States to uncover income potential. This 2026 STR market report for Scaly Mountain, based on AirROI data from February 2025 to January 2026, reveals key trends in the niche market of 26 active listings.
Whether you're considering an Airbnb investment in Scaly Mountain, optimizing your existing vacation rental, or exploring rental arbitrage opportunities, understanding the Scaly Mountain Airbnb data is crucial. Leveraging the low regulation environment is key to maximizing your short term rental income potential. Let's dive into the specifics.
Key Scaly Mountain Airbnb Performance Metrics Overview
Monthly Airbnb Revenue Variations & Income Potential in Scaly Mountain (2026)
Understanding the monthly revenue variations for Airbnb listings in Scaly Mountain is key to maximizing your short term rental income potential. Seasonality significantly impacts earnings. Our analysis, based on data from the past 12 months, shows that the peak revenue month for STRs in Scaly Mountain is typically October, while April often presents the lowest earnings, highlighting opportunities for strategic pricing adjustments during shoulder and low seasons. Explore the typical Airbnb income in Scaly Mountain across different performance tiers:
- Best-in-class properties (Top 10%) achieve $8,673+ monthly, often utilizing dynamic pricing and superior guest experiences.
- Strong performing properties (Top 25%) earn $4,628 or more, indicating effective management and desirable locations/amenities.
- Typical properties (Median) generate around $2,875 per month, representing the average market performance.
- Entry-level properties (Bottom 25%) see earnings around $1,322, often with potential for optimization.
Average Monthly Airbnb Earnings Trend in Scaly Mountain
Scaly Mountain Airbnb Occupancy Rate Trends (2026)
Maximize your bookings by understanding the Scaly Mountain STR occupancy trends. Seasonal demand shifts significantly influence how often properties are booked. Typically, Octobersees the highest demand (peak season occupancy), while May experiences the lowest (low season). Effective strategies, like adjusting minimum stays or offering promotions, can boost occupancy during slower periods. Here's how different property tiers perform in Scaly Mountain:
- Best-in-class properties (Top 10%) achieve 68%+ occupancy, indicating high desirability and potentially optimized availability.
- Strong performing properties (Top 25%) maintain 56% or higher occupancy, suggesting good market fit and guest satisfaction.
- Typical properties (Median) have an occupancy rate around 36%.
- Entry-level properties (Bottom 25%) average 17% occupancy, potentially facing higher vacancy.
Average Monthly Occupancy Rate Trend in Scaly Mountain
Average Daily Rate (ADR) Airbnb Trends in Scaly Mountain (2026)
Effective short term rental pricing strategy in Scaly Mountain involves understanding monthly ADR fluctuations. The Average Daily Rate (ADR) for Airbnb in Scaly Mountain typically peaks in December and dips lowest during March. Leveraging Airbnb dynamic pricing tools or strategies based on this seasonality can significantly boost revenue. Here's a look at the typical nightly rates achieved:
- Best-in-class properties (Top 10%) command rates of $487+ per night, often due to premium features or locations.
- Strong performing properties (Top 25%) achieve nightly rates of $335 or more.
- Typical properties (Median) charge around $229 per night.
- Entry-level properties (Bottom 25%) earn around $170 per night.
Average Daily Rate (ADR) Trend by Month in Scaly Mountain
Get Live Scaly Mountain Market Intelligence 👇

Explore Real-time Analytics
Airbnb Seasonality Analysis & Trends in Scaly Mountain (2026)
Peak Season (October, December, November)
- Revenue averages $5,020 per month
- Occupancy rates average 45.1%
- Daily rates average $308
Shoulder Season
- Revenue averages $3,839 per month
- Occupancy maintains around 38.0%
- Daily rates hold near $289
Low Season (March, April, May)
- Revenue drops to average $2,598 per month
- Occupancy decreases to average 31.7%
- Daily rates adjust to average $277
Seasonality Insights for Scaly Mountain
- The Airbnb seasonality in Scaly Mountain shows highly seasonal trends requiring careful strategy. While the sections above show seasonal averages, it's also insightful to look at the extremes:
- During the high season, the absolute peak month showcases Scaly Mountain's highest earning potential, with monthly revenues capable of climbing to $5,728, occupancy reaching a high of 50.3%, and ADRs peaking at $311.
- Conversely, the slowest single month of the year, typically falling within the low season, marks the market's lowest point. In this month, revenue might dip to $2,319, occupancy could drop to 30.0%, and ADRs may adjust down to $271.
- Understanding both the seasonal averages and these monthly peaks and troughs in revenue, occupancy, and ADR is crucial for maximizing your Airbnb profit potential in Scaly Mountain.
Seasonal Strategies for Maximizing Profit
- Peak Season: Maximize revenue through premium pricing and potentially longer minimum stays. Ensure high availability.
- Low Season: Offer competitive pricing, special promotions (e.g., extended stay discounts), and flexible cancellation policies. Target off-season travelers like remote workers or budget-conscious guests.
- Shoulder Seasons: Implement dynamic pricing that balances peak and low rates. Target weekend travelers or specific events. Offer slightly more flexible terms than peak season.
- Regularly analyze your own performance against these Scaly Mountain seasonality benchmarks and adjust your pricing and availability strategy accordingly.
Best Areas for Airbnb Investment in Scaly Mountain (2026)
Exploring the top neighborhoods for short-term rentals in Scaly Mountain? This section highlights key areas, outlining why they are attractive for hosts and guests, along with notable local attractions. Consider these locations based on your target guest profile and investment strategy.
| Neighborhood / Area | Why Host Here? (Target Guests & Appeal) | Key Attractions & Landmarks |
|---|---|---|
| Scaly Mountain | A picturesque mountain retreat known for its natural beauty and outdoor activities. Ideal for travelers looking to escape the hustle and bustle of city life with opportunities for hiking, fishing, and enjoying nature. | Sky Valley Resort, Scaly Mountain Outdoor Center, Wildcat Cliffs Country Club, Dillard House, Highlands Botanical Garden, Whiteside Mountain |
| Highlands | An upscale mountain town known for its stunning vistas and vibrant arts scene. Popular with luxury travelers seeking fine dining, shopping, and outdoor adventures. | Highlands Nature Center, Dry Falls, Whiteside Mountain, Rosewood Market, Highland-Hester Park, Sunset Rock and Ravenel Park |
| Franklin | A charming town with a rich history and vibrant community, perfect for those who enjoy exploring outdoor attractions and local culture. | Franklin Gem and Mineral Museum, Coweeta Hydrologic Laboratory, The Great Smoky Mountains, Nantahala National Forest, The Cherokee Heritage Museum and Gallery, Tassee's Place |
| Cashiers | Known for its beautiful waterfalls and outdoor activities, Cashiers attracts nature lovers seeking a tranquil getaway. | Whiteside Cove, Silver Run Falls, Lake Toxaway, Sapphire Valley Resort, Horsepasture River, Blue Ridge Parkway |
| Tuckasegee | Offers a serene atmosphere with access to outdoor activities like rafting and fishing. Great for adventure seekers and nature enthusiasts. | Nantahala River, Lake Tuckasegee, Tuckasegee River, Raging Waters Rafting, Great Smoky Mountains National Park, Deep Creek |
| Sylva | A quaint college town with a vibrant community, great for those seeking cultural experiences and outdoor activities nearby. | Historic Downtown Sylva, Railroad Grade Road, Balsam Lake, The Smoky Mountain Center for the Arts, Scott Creek, Tuckasegee River |
| Cullowhee | Home to Western Carolina University, offering a youthful vibe and great access to outdoor activities, perfect for young travelers. | Western Carolina University, Lake Glenville, Nantahala National Forest, The Appalachian Trail, Tuckasegee River, Whiteside Mountain |
| Wolf Ridge | A lesser-known gem with plenty of opportunities for skiing and snowboarding in the winter and hiking in the summer, attracting adventure seekers. | Wolf Ridge Ski Resort, Big Ivy Community Center, Blue Ridge Parkway, Pisgah National Forest, Bald Mountain, Hiking Trails |
Understanding Airbnb License Requirements & STR Laws in Scaly Mountain (2026)
While Scaly Mountain, North Carolina, United States currently shows low STR regulations, specific Airbnb license requirements might still exist or change. Always verify the latest short term rental regulations and Airbnb license requirements directly with local government authorities for Scaly Mountain to ensure full compliance before hosting.
(Source: AirROI data, 2026, finding no licensed listings among those analyzed)
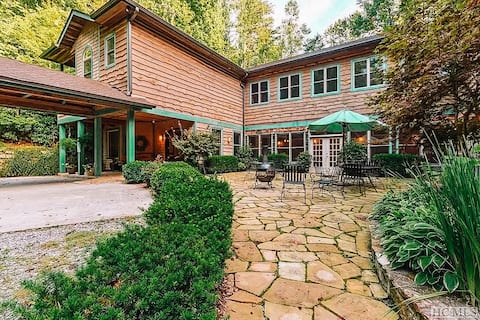
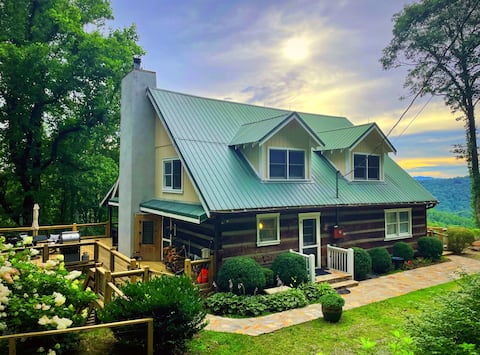
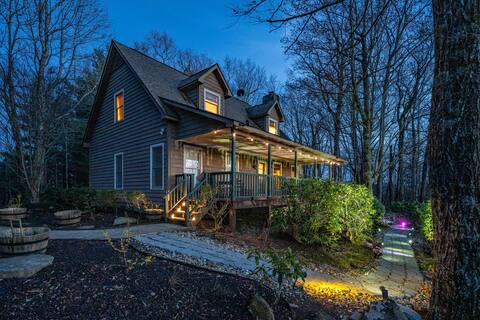
Top Performing Airbnb Properties in Scaly Mountain (2026)
Benchmark your potential! Explore examples of top-performing Airbnb properties in Scaly Mountainbased on Trailing Twelve Month (TTM) revenue. Analyze their characteristics, revenue, occupancy rate, and ADR to understand what drives success in this market.
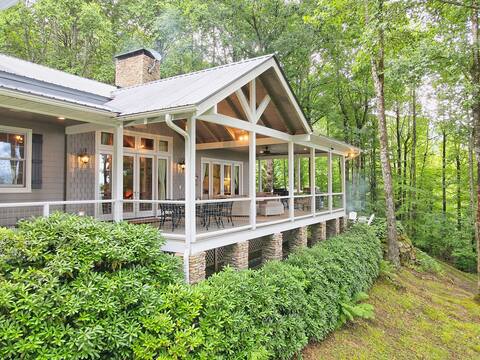
Panoramic Mtn Views, Fire Pit & Wine Cellar
Entire Place • 7 bedrooms

Deja View Lodge: Highlands 12 Acre Private Estate
Entire Place • 4 bedrooms
Highlands Retreat 7 Suite Mountain Home
Entire Place • 7 bedrooms

Sky High Cottage near Highlands
Entire Place • 3 bedrooms
Pet Friendly, Private Cabin, Fire Pit, GREAT VIEWS
Entire Place • 3 bedrooms
Near Highlands: 36-Acre Scaly Mountain Lodge
Entire Place • 2 bedrooms
Note: Performance varies based on location, size, amenities, seasonality, and management quality. Data reflects the past 12 months.
Top Performing Airbnb Hosts in Scaly Mountain (2026)
Learn from the best! This table showcases top-performing Airbnb hosts in Scaly Mountain based on the number of properties managed and estimated total revenue over the past year. Analyze their scale and performance metrics.
| Host Name | Properties | Grossing Revenue | Stay Reviews | Avg Rating |
|---|---|---|---|---|
| Jennifer Salah | 1 | $134,729 | 40 | 5.00/5.0 |
| Chrissie | 1 | $104,568 | 53 | 5.00/5.0 |
| Kimberly | 1 | $79,323 | 28 | 4.68/5.0 |
| Mary | 1 | $59,268 | 35 | 4.97/5.0 |
| Eric | 1 | $48,780 | 45 | 4.91/5.0 |
| Evolve | 1 | $48,533 | 27 | 5.00/5.0 |
| Katie Jane | 1 | $46,745 | 47 | 4.98/5.0 |
| Heather | 1 | $41,362 | 28 | 4.93/5.0 |
| Dj | 1 | $30,510 | 19 | 4.84/5.0 |
| Samuel | 1 | $26,554 | 108 | 4.94/5.0 |
Analyzing the strategies of top hosts, such as their property selection, pricing, and guest communication, can offer valuable lessons for optimizing your own Airbnb operations in Scaly Mountain.
Dive Deeper: Advanced Scaly Mountain STR Market Data (2026)
Ready to unlock more insights? AirROI provides access to advanced metrics and comprehensive Airbnb data for Scaly Mountain. Explore detailed analytics beyond this report to refine your investment strategy, optimize pricing, and maximize your vacation rental profits.
Explore Advanced MetricsScaly Mountain Short-Term Rental Market Composition (2026): Property & Room Types
Room Type Distribution
Property Type Distribution
Market Composition Insights for Scaly Mountain
- The Scaly Mountain Airbnb market composition is heavily skewed towards Entire Home/Apt listings, which make up 96.2% of the 26 active rentals. This indicates strong guest preference for privacy and space.
- Looking at the property type distribution in Scaly Mountain, House properties are the most common (46.2%), reflecting the local real estate landscape.
- Houses represent a significant 46.2% portion, catering likely to families or larger groups.
- Smaller segments like others, hotel/boutique (combined 7.6%) offer potential for unique stay experiences.
Scaly Mountain Airbnb Room Capacity Analysis (2026): Bedroom Distribution
Distribution of Listings by Number of Bedrooms
Room Capacity Insights for Scaly Mountain
- The dominant room capacity in Scaly Mountain is 2 bedrooms listings, making up 46.2% of the market. This suggests a strong demand for properties suitable for couples or solo travelers.
- Together, 2 bedrooms and 3 bedrooms properties represent 69.3% of the active Airbnb listings in Scaly Mountain, indicating a high concentration in these sizes.
- A significant 42.3% of listings offer 3+ bedrooms, catering to larger groups and families seeking more space in Scaly Mountain.
Scaly Mountain Vacation Rental Guest Capacity Trends (2026)
Distribution of Listings by Guest Capacity
Guest Capacity Insights for Scaly Mountain
- The most common guest capacity trend in Scaly Mountain vacation rentals is listings accommodating 6 guests (38.5%). This suggests the primary traveler segment is likely larger groups.
- Properties designed for 6 guests and 8+ guests dominate the Scaly Mountain STR market, accounting for 61.6% of listings.
- 65.4% of properties accommodate 6+ guests, serving the market segment for larger families or group travel in Scaly Mountain.
- On average, properties in Scaly Mountain are equipped to host 5.7 guests.
Scaly Mountain Airbnb Booking Patterns (2026): Available vs. Booked Days
Available Days Distribution
Booked Days Distribution
Booking Pattern Insights for Scaly Mountain
- The most common availability pattern in Scaly Mountain falls within the 271-366 days range, representing 50% of listings. This suggests many properties have significant open periods on their calendars.
- Approximately 80.8% of listings show high availability (181+ days open annually), indicating potential for increased bookings or specific owner usage patterns.
- For booked days, the 91-180 days range is most frequent in Scaly Mountain (34.6%), reflecting common guest stay durations or potential owner blocking patterns.
- A notable 19.2% of properties secure long booking periods (181+ days booked per year), highlighting successful long-term rental strategies or significant owner usage.
Scaly Mountain Airbnb Minimum Stay Requirements Analysis
Distribution of Listings by Minimum Night Requirement
1 Night
1 listings
3.8% of total
2 Nights
14 listings
53.8% of total
3 Nights
1 listings
3.8% of total
4-6 Nights
1 listings
3.8% of total
30+ Nights
9 listings
34.6% of total
Key Insights
- The most prevalent minimum stay requirement in Scaly Mountain is 2 Nights, adopted by 53.8% of listings. This highlights the market's preference for shorter, flexible bookings.
- A significant segment (34.6%) caters to monthly stays (30+ nights) in Scaly Mountain, pointing to opportunities in the extended-stay market.
Recommendations
- Align with the market by considering a 2 Nights minimum stay, as 53.8% of Scaly Mountain hosts use this setting.
- If feasible, allowing 1-night stays, especially midweek or during low season, could capture last-minute bookings, as only 3.8% currently do.
- A 2-night minimum appears standard (53.8%). Consider this for weekends or peak periods.
- Explore offering discounts for stays of 30+ nights to attract the 34.6% of the market seeking extended stays.
- Adjust minimum nights based on seasonality – potentially shorter during low season and longer during peak demand periods in Scaly Mountain.
Scaly Mountain Airbnb Cancellation Policy Trends Analysis (2026)
Super Strict 30 Days
4 listings
15.4% of total
Flexible
1 listings
3.8% of total
Moderate
5 listings
19.2% of total
Firm
13 listings
50% of total
Strict
3 listings
11.5% of total
Cancellation Policy Insights for Scaly Mountain
- The prevailing Airbnb cancellation policy trend in Scaly Mountain is Firm, used by 50% of listings.
- A majority (61.5%) of hosts in Scaly Mountain utilize Firm or Strict policies, indicating a market where hosts prioritize booking security.
Recommendations for Hosts
- Consider adopting a Firm policy to align with the 50% market standard in Scaly Mountain.
- Using a Strict policy might deter some guests, as only 11.5% of listings use it. Evaluate if potential revenue protection outweighs possible lower booking rates.
- Regularly review your cancellation policy against competitors and market demand shifts in Scaly Mountain.
Scaly Mountain STR Booking Lead Time Analysis (2026)
Average Booking Lead Time by Month
Booking Lead Time Insights for Scaly Mountain
- The overall average booking lead time for vacation rentals in Scaly Mountain is 53 days.
- Guests book furthest in advance for stays during October (average 92 days), likely coinciding with peak travel demand or local events.
- The shortest booking windows occur for stays in February (average 12 days), indicating more last-minute travel plans during this time.
- Seasonally, Fall (70 days avg.) sees the longest lead times, while Spring (32 days avg.) has the shortest, reflecting typical travel planning cycles.
Recommendations for Hosts
- Use the overall average lead time (53 days) as a baseline for your pricing and availability strategy in Scaly Mountain.
- For October stays, consider implementing length-of-stay discounts or slightly higher rates for bookings made less than 92 days out to capitalize on advance planning.
- During February, focus on last-minute booking availability and promotions, as guests book with very short notice (12 days avg.).
- Target marketing efforts for the Fall season well in advance (at least 70 days) to capture early planners.
- Monitor your own booking lead times against these Scaly Mountain averages to identify opportunities for dynamic pricing adjustments.
Popular & Essential Airbnb Amenities in Scaly Mountain (2026)
Amenity Prevalence
Amenity Insights for Scaly Mountain
- Essential amenities in Scaly Mountain that guests expect include: Wifi, Refrigerator, Free parking on premises, Air conditioning, Smoke alarm. Lacking these (any) could significantly impact bookings.
- Popular amenities like Coffee maker, Fire extinguisher, Bed linens are common but not universal. Offering these can provide a competitive edge.
Recommendations for Hosts
- Ensure your listing includes all essential amenities for Scaly Mountain: Wifi, Refrigerator, Free parking on premises, Air conditioning, Smoke alarm.
- Prioritize adding missing essentials: Free parking on premises, Air conditioning, Smoke alarm.
- Consider adding popular differentiators like Coffee maker or Fire extinguisher to increase appeal.
- Highlight unique or less common amenities you offer (e.g., hot tub, dedicated workspace, EV charger) in your listing description and photos.
- Regularly check competitor amenities in Scaly Mountain to stay competitive.
Scaly Mountain Airbnb Guest Demographics & Profile Analysis (2026)
Guest Profile Summary for Scaly Mountain
- The typical guest profile for Airbnb in Scaly Mountain consists of primarily domestic travelers (98%), often arriving from nearby Atlanta, typically belonging to the Post-2000s (Gen Z/Alpha) group (50%), primarily speaking English or Spanish.
- Domestic travelers account for 98.3% of guests.
- Key international markets include United States (98.3%) and United Kingdom (1.7%).
- Top languages spoken are English (74.5%) followed by Spanish (12.8%).
- A significant demographic segment is the Post-2000s (Gen Z/Alpha) group, representing 50% of guests.
Recommendations for Hosts
- Target domestic marketing efforts towards travelers from Atlanta and Miami.
- Tailor amenities and listing descriptions to appeal to the dominant Post-2000s (Gen Z/Alpha) demographic (e.g., highlight fast WiFi, smart home features, local guides).
- Highlight unique local experiences or amenities relevant to the primary guest profile.
- Consider seasonal promotions aligned with peak travel times for key origin markets.
Nearby Short-Term Rental Market Comparison
How does the Scaly Mountain Airbnb market stack up against its neighbors? Compare key performance metrics like average monthly revenue, ADR, and occupancy rates in surrounding areas to understand the broader regional STR landscape.
| Market | Active Properties | Monthly Revenue | Daily Rate | Avg. Occupancy |
|---|---|---|---|---|
| Sevier County | 68 | $7,108 | $567.95 | 44% |
| Gilmer County | 26 | $5,298 | $459.59 | 40% |
| Union Mills | 15 | $4,938 | $442.76 | 41% |
| Sevierville | 6,269 | $4,747 | $370.20 | 46% |
| Fannin County | 42 | $4,574 | $435.93 | 38% |
| East Ellijay | 15 | $4,415 | $368.05 | 41% |
| Epworth | 79 | $4,411 | $406.97 | 40% |
| Six Mile | 57 | $4,396 | $449.78 | 42% |
| Gatlinburg | 3,565 | $4,385 | $353.70 | 45% |
| Commerce | 19 | $4,298 | $285.34 | 45% |