Salisbury Airbnb Market Analysis 2026: Short Term Rental Data & Vacation Rental Statistics in North Carolina, United States
Is Airbnb profitable in Salisbury in 2026? Explore comprehensive Airbnb analytics for Salisbury, North Carolina, United States to uncover income potential. This 2026 STR market report for Salisbury, based on AirROI data from February 2025 to January 2026, reveals key trends in the niche market of 73 active listings.
Whether you're considering an Airbnb investment in Salisbury, optimizing your existing vacation rental, or exploring rental arbitrage opportunities, understanding the Salisbury Airbnb data is crucial. Leveraging the low regulation environment is key to maximizing your short term rental income potential. Let's dive into the specifics.
Key Salisbury Airbnb Performance Metrics Overview
Monthly Airbnb Revenue Variations & Income Potential in Salisbury (2026)
Understanding the monthly revenue variations for Airbnb listings in Salisbury is key to maximizing your short term rental income potential. Seasonality significantly impacts earnings. Our analysis, based on data from the past 12 months, shows that the peak revenue month for STRs in Salisbury is typically October, while February often presents the lowest earnings, highlighting opportunities for strategic pricing adjustments during shoulder and low seasons. Explore the typical Airbnb income in Salisbury across different performance tiers:
- Best-in-class properties (Top 10%) achieve $4,423+ monthly, often utilizing dynamic pricing and superior guest experiences.
- Strong performing properties (Top 25%) earn $3,145 or more, indicating effective management and desirable locations/amenities.
- Typical properties (Median) generate around $1,957 per month, representing the average market performance.
- Entry-level properties (Bottom 25%) see earnings around $1,011, often with potential for optimization.
Average Monthly Airbnb Earnings Trend in Salisbury
Salisbury Airbnb Occupancy Rate Trends (2026)
Maximize your bookings by understanding the Salisbury STR occupancy trends. Seasonal demand shifts significantly influence how often properties are booked. Typically, Novembersees the highest demand (peak season occupancy), while January experiences the lowest (low season). Effective strategies, like adjusting minimum stays or offering promotions, can boost occupancy during slower periods. Here's how different property tiers perform in Salisbury:
- Best-in-class properties (Top 10%) achieve 78%+ occupancy, indicating high desirability and potentially optimized availability.
- Strong performing properties (Top 25%) maintain 64% or higher occupancy, suggesting good market fit and guest satisfaction.
- Typical properties (Median) have an occupancy rate around 45%.
- Entry-level properties (Bottom 25%) average 23% occupancy, potentially facing higher vacancy.
Average Monthly Occupancy Rate Trend in Salisbury
Average Daily Rate (ADR) Airbnb Trends in Salisbury (2026)
Effective short term rental pricing strategy in Salisbury involves understanding monthly ADR fluctuations. The Average Daily Rate (ADR) for Airbnb in Salisbury typically peaks in October and dips lowest during February. Leveraging Airbnb dynamic pricing tools or strategies based on this seasonality can significantly boost revenue. Here's a look at the typical nightly rates achieved:
- Best-in-class properties (Top 10%) command rates of $249+ per night, often due to premium features or locations.
- Strong performing properties (Top 25%) achieve nightly rates of $176 or more.
- Typical properties (Median) charge around $144 per night.
- Entry-level properties (Bottom 25%) earn around $110 per night.
Average Daily Rate (ADR) Trend by Month in Salisbury
Get Live Salisbury Market Intelligence 👇

Explore Real-time Analytics
Airbnb Seasonality Analysis & Trends in Salisbury (2026)
Peak Season (October, November, May)
- Revenue averages $2,880 per month
- Occupancy rates average 50.0%
- Daily rates average $172
Shoulder Season
- Revenue averages $2,513 per month
- Occupancy maintains around 44.2%
- Daily rates hold near $163
Low Season (January, February, April)
- Revenue drops to average $1,927 per month
- Occupancy decreases to average 41.0%
- Daily rates adjust to average $152
Seasonality Insights for Salisbury
- The Airbnb seasonality in Salisbury shows moderate seasonality with distinct peak and low periods. While the sections above show seasonal averages, it's also insightful to look at the extremes:
- During the high season, the absolute peak month showcases Salisbury's highest earning potential, with monthly revenues capable of climbing to $3,023, occupancy reaching a high of 51.0%, and ADRs peaking at $181.
- Conversely, the slowest single month of the year, typically falling within the low season, marks the market's lowest point. In this month, revenue might dip to $1,780, occupancy could drop to 32.3%, and ADRs may adjust down to $140.
- Understanding both the seasonal averages and these monthly peaks and troughs in revenue, occupancy, and ADR is crucial for maximizing your Airbnb profit potential in Salisbury.
Seasonal Strategies for Maximizing Profit
- Peak Season: Maximize revenue through premium pricing and potentially longer minimum stays. Ensure high availability.
- Low Season: Offer competitive pricing, special promotions (e.g., extended stay discounts), and flexible cancellation policies. Target off-season travelers like remote workers or budget-conscious guests.
- Shoulder Seasons: Implement dynamic pricing that balances peak and low rates. Target weekend travelers or specific events. Offer slightly more flexible terms than peak season.
- Regularly analyze your own performance against these Salisbury seasonality benchmarks and adjust your pricing and availability strategy accordingly.
Best Areas for Airbnb Investment in Salisbury (2026)
Exploring the top neighborhoods for short-term rentals in Salisbury? This section highlights key areas, outlining why they are attractive for hosts and guests, along with notable local attractions. Consider these locations based on your target guest profile and investment strategy.
| Neighborhood / Area | Why Host Here? (Target Guests & Appeal) | Key Attractions & Landmarks |
|---|---|---|
| Downtown Salisbury | The historic heart of Salisbury, offering a vibrant atmosphere with shops, restaurants, and cultural venues. Attracts visitors looking for a charming small-town experience with modern amenities. | Salisbury Station, Salisbury Civic Center, Rowan Museum, Bell Tower Green, Downtown Shops and Restaurants |
| Catawba College | A beautiful college campus that attracts students, parents, and visitors for events. Ideal for guests seeking educational and cultural experiences. | Catawba College, Lentz-Eggers Science Center, College Park, Art Galleries |
| Salisbury NC Waterfront | Ideal for those who enjoy nature and outdoor activities, with access to water sports and scenic views. Attracts visitors seeking a peaceful retreat in nature. | Lake Salisbury, Daniel Boone Native Gardens, Salisbury City Park, Yadkin River |
| Historic District | Known for its beautiful historic homes and architecture. Great for tourists interested in history and local culture, providing a quaint southern experience. | Historic homes tours, Salisbury National Cemetery, Public Art Displays, Civil War Trails |
| Foodie District | A foodie hotspot filled with diverse eateries and local breweries. Attracts culinary enthusiasts looking for unique dining experiences. | Local Brews, Restaurant Row, Food Festivals, Farmers’ Market |
| Military Park | A scenic park that hosts events and offers recreational activities. A good spot for families and those looking for short-term stays near outdoor fun. | Military Park Events, Playgrounds, Trails, Picnic Areas |
| Salisbury Arts District | A thriving area for those interested in the arts, offering galleries and studios that reflect local talent. Ideal for art lovers and cultural travelers. | Salisbury Arts and Crafts, Local Artists’ Studios, Art Walks, Theater Events |
| Livingstone College | Attracts visitors during college events, athletics, and parent weekends. Good for short-term rentals catering to family members and alumni. | Livingstone College Events, Athletic Competitions, Cultural Events |
Understanding Airbnb License Requirements & STR Laws in Salisbury (2026)
While Salisbury, North Carolina, United States currently shows low STR regulations, specific Airbnb license requirements might still exist or change. Always verify the latest short term rental regulations and Airbnb license requirements directly with local government authorities for Salisbury to ensure full compliance before hosting.
(Source: AirROI data, 2026, finding no licensed listings among those analyzed)
Top Performing Airbnb Properties in Salisbury (2026)
Benchmark your potential! Explore examples of top-performing Airbnb properties in Salisburybased on Trailing Twelve Month (TTM) revenue. Analyze their characteristics, revenue, occupancy rate, and ADR to understand what drives success in this market.

Henry Connor Bost House
Entire Place • 6 bedrooms
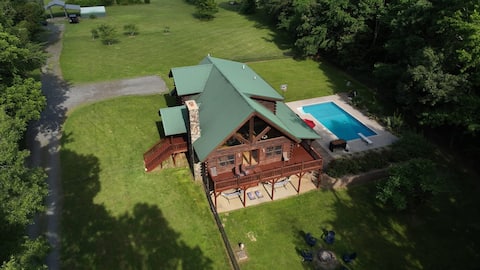
A Slice of Salisbury-Cabin W/ Pool, 10 Acres
Entire Place • 3 bedrooms
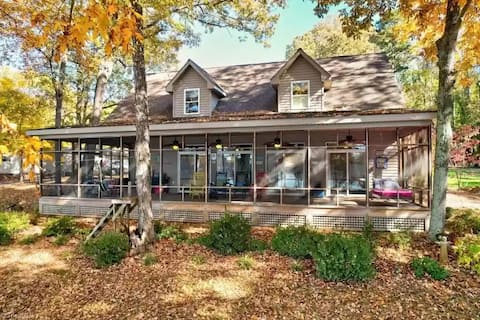
Oar House - Lakefront, Pier, Boat Ramp & Fire Pit
Entire Place • 5 bedrooms
Renovated Historic 1940s Rectory
Entire Place • 6 bedrooms

4 BR 2 BA Historic Home. Welcome to Circa 1925!
Entire Place • N/A

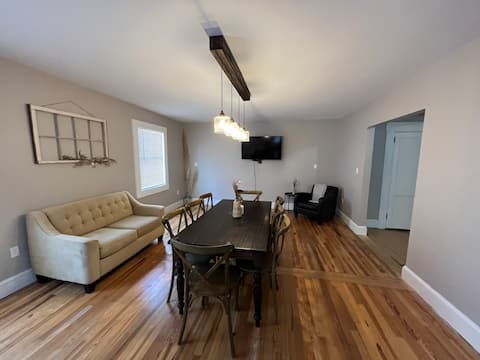
3BR Downtown Retreat | King Bed | Cozy & Fast WiFi
Entire Place • 3 bedrooms
Note: Performance varies based on location, size, amenities, seasonality, and management quality. Data reflects the past 12 months.
Top Performing Airbnb Hosts in Salisbury (2026)
Learn from the best! This table showcases top-performing Airbnb hosts in Salisbury based on the number of properties managed and estimated total revenue over the past year. Analyze their scale and performance metrics.
| Host Name | Properties | Grossing Revenue | Stay Reviews | Avg Rating |
|---|---|---|---|---|
| David | 11 | $247,436 | 492 | 4.88/5.0 |
| Laurie | 1 | $150,647 | 89 | 4.89/5.0 |
| Ranin | 2 | $122,199 | 112 | 4.92/5.0 |
| Carson | 1 | $72,122 | 133 | 4.71/5.0 |
| Lori | 1 | $62,877 | 11 | 5.00/5.0 |
| Cara & Marcelo | 1 | $55,297 | 39 | 4.97/5.0 |
| Empire Dreams | 4 | $46,497 | 11 | 4.74/5.0 |
| Chris | 1 | $44,780 | 38 | 5.00/5.0 |
| James | 2 | $44,588 | 50 | 4.82/5.0 |
| Taylor & Dylan | 1 | $43,390 | 93 | 4.80/5.0 |
Analyzing the strategies of top hosts, such as their property selection, pricing, and guest communication, can offer valuable lessons for optimizing your own Airbnb operations in Salisbury.
Dive Deeper: Advanced Salisbury STR Market Data (2026)
Ready to unlock more insights? AirROI provides access to advanced metrics and comprehensive Airbnb data for Salisbury. Explore detailed analytics beyond this report to refine your investment strategy, optimize pricing, and maximize your vacation rental profits.
Explore Advanced MetricsSalisbury Short-Term Rental Market Composition (2026): Property & Room Types
Room Type Distribution
Property Type Distribution
Market Composition Insights for Salisbury
- The Salisbury Airbnb market composition is heavily skewed towards Entire Home/Apt listings, which make up 87.7% of the 73 active rentals. This indicates strong guest preference for privacy and space.
- Looking at the property type distribution in Salisbury, House properties are the most common (72.6%), reflecting the local real estate landscape.
- Houses represent a significant 72.6% portion, catering likely to families or larger groups.
- Smaller segments like hotel/boutique, others (combined 4.1%) offer potential for unique stay experiences.
Salisbury Airbnb Room Capacity Analysis (2026): Bedroom Distribution
Distribution of Listings by Number of Bedrooms
Room Capacity Insights for Salisbury
- The dominant room capacity in Salisbury is 2 bedrooms listings, making up 37% of the market. This suggests a strong demand for properties suitable for couples or solo travelers.
- Together, 2 bedrooms and 3 bedrooms properties represent 61.7% of the active Airbnb listings in Salisbury, indicating a high concentration in these sizes.
- A significant 34.3% of listings offer 3+ bedrooms, catering to larger groups and families seeking more space in Salisbury.
Salisbury Vacation Rental Guest Capacity Trends (2026)
Distribution of Listings by Guest Capacity
Guest Capacity Insights for Salisbury
- The most common guest capacity trend in Salisbury vacation rentals is listings accommodating 4 guests (23.3%). This suggests the primary traveler segment is likely small families or groups.
- Properties designed for 4 guests and 6 guests dominate the Salisbury STR market, accounting for 45.2% of listings.
- 42.4% of properties accommodate 6+ guests, serving the market segment for larger families or group travel in Salisbury.
- On average, properties in Salisbury are equipped to host 4.4 guests.
Salisbury Airbnb Booking Patterns (2026): Available vs. Booked Days
Available Days Distribution
Booked Days Distribution
Booking Pattern Insights for Salisbury
- The most common availability pattern in Salisbury falls within the 271-366 days range, representing 39.7% of listings. This suggests many properties have significant open periods on their calendars.
- Approximately 69.8% of listings show high availability (181+ days open annually), indicating potential for increased bookings or specific owner usage patterns.
- For booked days, the 91-180 days range is most frequent in Salisbury (30.1%), reflecting common guest stay durations or potential owner blocking patterns.
- A notable 30.1% of properties secure long booking periods (181+ days booked per year), highlighting successful long-term rental strategies or significant owner usage.
Salisbury Airbnb Minimum Stay Requirements Analysis
Distribution of Listings by Minimum Night Requirement
1 Night
19 listings
26% of total
2 Nights
19 listings
26% of total
3 Nights
9 listings
12.3% of total
7-29 Nights
8 listings
11% of total
30+ Nights
18 listings
24.7% of total
Key Insights
- The most prevalent minimum stay requirement in Salisbury is 1 Night, adopted by 26% of listings. This highlights the market's preference for shorter, flexible bookings.
- A significant segment (24.7%) caters to monthly stays (30+ nights) in Salisbury, pointing to opportunities in the extended-stay market.
Recommendations
- Align with the market by considering a 1 Night minimum stay, as 26% of Salisbury hosts use this setting.
- If feasible, allowing 1-night stays, especially midweek or during low season, could capture last-minute bookings, as only 26% currently do.
- Explore offering discounts for stays of 30+ nights to attract the 24.7% of the market seeking extended stays.
- Adjust minimum nights based on seasonality – potentially shorter during low season and longer during peak demand periods in Salisbury.
Salisbury Airbnb Cancellation Policy Trends Analysis (2026)
Limited
1 listings
1.4% of total
Flexible
17 listings
23.3% of total
Moderate
25 listings
34.2% of total
Firm
22 listings
30.1% of total
Strict
8 listings
11% of total
Cancellation Policy Insights for Salisbury
- The prevailing Airbnb cancellation policy trend in Salisbury is Moderate, used by 34.2% of listings.
- There's a relatively balanced mix between guest-friendly (57.5%) and stricter (41.1%) policies, offering choices for different guest needs.
Recommendations for Hosts
- Consider adopting a Moderate policy to align with the 34.2% market standard in Salisbury.
- Using a Strict policy might deter some guests, as only 11% of listings use it. Evaluate if potential revenue protection outweighs possible lower booking rates.
- Regularly review your cancellation policy against competitors and market demand shifts in Salisbury.
Salisbury STR Booking Lead Time Analysis (2026)
Average Booking Lead Time by Month
Booking Lead Time Insights for Salisbury
- The overall average booking lead time for vacation rentals in Salisbury is 32 days.
- Guests book furthest in advance for stays during October (average 48 days), likely coinciding with peak travel demand or local events.
- The shortest booking windows occur for stays in February (average 22 days), indicating more last-minute travel plans during this time.
- Seasonally, Fall (45 days avg.) sees the longest lead times, while Winter (32 days avg.) has the shortest, reflecting typical travel planning cycles.
Recommendations for Hosts
- Use the overall average lead time (32 days) as a baseline for your pricing and availability strategy in Salisbury.
- For October stays, consider implementing length-of-stay discounts or slightly higher rates for bookings made less than 48 days out to capitalize on advance planning.
- Target marketing efforts for the Fall season well in advance (at least 45 days) to capture early planners.
- Monitor your own booking lead times against these Salisbury averages to identify opportunities for dynamic pricing adjustments.
Popular & Essential Airbnb Amenities in Salisbury (2026)
Amenity Prevalence
Amenity Insights for Salisbury
- Essential amenities in Salisbury that guests expect include: Air conditioning, Free parking on premises, Smoke alarm, Wifi. Lacking these (any) could significantly impact bookings.
- Popular amenities like Kitchen, TV, Hot water are common but not universal. Offering these can provide a competitive edge.
Recommendations for Hosts
- Ensure your listing includes all essential amenities for Salisbury: Air conditioning, Free parking on premises, Smoke alarm, Wifi.
- Prioritize adding missing essentials: Air conditioning, Free parking on premises, Smoke alarm, Wifi.
- Consider adding popular differentiators like Kitchen or TV to increase appeal.
- Highlight unique or less common amenities you offer (e.g., hot tub, dedicated workspace, EV charger) in your listing description and photos.
- Regularly check competitor amenities in Salisbury to stay competitive.
Salisbury Airbnb Guest Demographics & Profile Analysis (2026)
Guest Profile Summary for Salisbury
- The typical guest profile for Airbnb in Salisbury consists of primarily domestic travelers (97%), often arriving from nearby Charlotte, typically belonging to the Post-2000s (Gen Z/Alpha) group (50%), primarily speaking English or Spanish.
- Domestic travelers account for 97.3% of guests.
- Key international markets include United States (97.3%) and DC (0.6%).
- Top languages spoken are English (74.5%) followed by Spanish (14.4%).
- A significant demographic segment is the Post-2000s (Gen Z/Alpha) group, representing 50% of guests.
Recommendations for Hosts
- Target domestic marketing efforts towards travelers from Charlotte and Raleigh.
- Tailor amenities and listing descriptions to appeal to the dominant Post-2000s (Gen Z/Alpha) demographic (e.g., highlight fast WiFi, smart home features, local guides).
- Highlight unique local experiences or amenities relevant to the primary guest profile.
- Consider seasonal promotions aligned with peak travel times for key origin markets.
Nearby Short-Term Rental Market Comparison
How does the Salisbury Airbnb market stack up against its neighbors? Compare key performance metrics like average monthly revenue, ADR, and occupancy rates in surrounding areas to understand the broader regional STR landscape.
| Market | Active Properties | Monthly Revenue | Daily Rate | Avg. Occupancy |
|---|---|---|---|---|
| Denver | 109 | $6,309 | $590.96 | 45% |
| Catawba | 16 | $6,093 | $582.49 | 38% |
| Mooresville | 369 | $5,702 | $559.93 | 42% |
| Sherrills Ford | 107 | $5,615 | $547.26 | 41% |
| Troutman | 49 | $5,587 | $467.90 | 42% |
| Lake Norman of Catawba | 51 | $4,972 | $513.30 | 43% |
| Chapin | 93 | $3,971 | $386.37 | 43% |
| Semora | 50 | $3,408 | $377.45 | 38% |
| Watauga County | 47 | $3,370 | $314.71 | 39% |
| Nebo | 88 | $3,330 | $381.79 | 34% |