Purlear Airbnb Market Analysis 2026: Short Term Rental Data & Vacation Rental Statistics in North Carolina, United States
Is Airbnb profitable in Purlear in 2026? Explore comprehensive Airbnb analytics for Purlear, North Carolina, United States to uncover income potential. This 2026 STR market report for Purlear, based on AirROI data from February 2025 to January 2026, reveals key trends in the niche market of 49 active listings.
Whether you're considering an Airbnb investment in Purlear, optimizing your existing vacation rental, or exploring rental arbitrage opportunities, understanding the Purlear Airbnb data is crucial. Leveraging the low regulation environment is key to maximizing your short term rental income potential. Let's dive into the specifics.
Key Purlear Airbnb Performance Metrics Overview
Monthly Airbnb Revenue Variations & Income Potential in Purlear (2026)
Understanding the monthly revenue variations for Airbnb listings in Purlear is key to maximizing your short term rental income potential. Seasonality significantly impacts earnings. Our analysis, based on data from the past 12 months, shows that the peak revenue month for STRs in Purlear is typically October, while February often presents the lowest earnings, highlighting opportunities for strategic pricing adjustments during shoulder and low seasons. Explore the typical Airbnb income in Purlear across different performance tiers:
- Best-in-class properties (Top 10%) achieve $5,057+ monthly, often utilizing dynamic pricing and superior guest experiences.
- Strong performing properties (Top 25%) earn $3,564 or more, indicating effective management and desirable locations/amenities.
- Typical properties (Median) generate around $2,022 per month, representing the average market performance.
- Entry-level properties (Bottom 25%) see earnings around $1,089, often with potential for optimization.
Average Monthly Airbnb Earnings Trend in Purlear
Purlear Airbnb Occupancy Rate Trends (2026)
Maximize your bookings by understanding the Purlear STR occupancy trends. Seasonal demand shifts significantly influence how often properties are booked. Typically, Octobersees the highest demand (peak season occupancy), while January experiences the lowest (low season). Effective strategies, like adjusting minimum stays or offering promotions, can boost occupancy during slower periods. Here's how different property tiers perform in Purlear:
- Best-in-class properties (Top 10%) achieve 75%+ occupancy, indicating high desirability and potentially optimized availability.
- Strong performing properties (Top 25%) maintain 60% or higher occupancy, suggesting good market fit and guest satisfaction.
- Typical properties (Median) have an occupancy rate around 39%.
- Entry-level properties (Bottom 25%) average 21% occupancy, potentially facing higher vacancy.
Average Monthly Occupancy Rate Trend in Purlear
Average Daily Rate (ADR) Airbnb Trends in Purlear (2026)
Effective short term rental pricing strategy in Purlear involves understanding monthly ADR fluctuations. The Average Daily Rate (ADR) for Airbnb in Purlear typically peaks in October and dips lowest during March. Leveraging Airbnb dynamic pricing tools or strategies based on this seasonality can significantly boost revenue. Here's a look at the typical nightly rates achieved:
- Best-in-class properties (Top 10%) command rates of $279+ per night, often due to premium features or locations.
- Strong performing properties (Top 25%) achieve nightly rates of $224 or more.
- Typical properties (Median) charge around $188 per night.
- Entry-level properties (Bottom 25%) earn around $147 per night.
Average Daily Rate (ADR) Trend by Month in Purlear
Get Live Purlear Market Intelligence 👇

Explore Real-time Analytics
Airbnb Seasonality Analysis & Trends in Purlear (2026)
Peak Season (October, December, November)
- Revenue averages $3,135 per month
- Occupancy rates average 47.7%
- Daily rates average $206
Shoulder Season
- Revenue averages $2,518 per month
- Occupancy maintains around 43.4%
- Daily rates hold near $189
Low Season (January, February, March)
- Revenue drops to average $1,776 per month
- Occupancy decreases to average 32.3%
- Daily rates adjust to average $180
Seasonality Insights for Purlear
- The Airbnb seasonality in Purlear shows highly seasonal trends requiring careful strategy. While the sections above show seasonal averages, it's also insightful to look at the extremes:
- During the high season, the absolute peak month showcases Purlear's highest earning potential, with monthly revenues capable of climbing to $3,654, occupancy reaching a high of 56.2%, and ADRs peaking at $209.
- Conversely, the slowest single month of the year, typically falling within the low season, marks the market's lowest point. In this month, revenue might dip to $1,485, occupancy could drop to 28.5%, and ADRs may adjust down to $171.
- Understanding both the seasonal averages and these monthly peaks and troughs in revenue, occupancy, and ADR is crucial for maximizing your Airbnb profit potential in Purlear.
Seasonal Strategies for Maximizing Profit
- Peak Season: Maximize revenue through premium pricing and potentially longer minimum stays. Ensure high availability.
- Low Season: Offer competitive pricing, special promotions (e.g., extended stay discounts), and flexible cancellation policies. Target off-season travelers like remote workers or budget-conscious guests.
- Shoulder Seasons: Implement dynamic pricing that balances peak and low rates. Target weekend travelers or specific events. Offer slightly more flexible terms than peak season.
- Regularly analyze your own performance against these Purlear seasonality benchmarks and adjust your pricing and availability strategy accordingly.
Best Areas for Airbnb Investment in Purlear (2026)
Exploring the top neighborhoods for short-term rentals in Purlear? This section highlights key areas, outlining why they are attractive for hosts and guests, along with notable local attractions. Consider these locations based on your target guest profile and investment strategy.
| Neighborhood / Area | Why Host Here? (Target Guests & Appeal) | Key Attractions & Landmarks |
|---|---|---|
| Blue Ridge Parkway | A scenic highway known for its beautiful views and outdoor activities. It's perfect for tourists who enjoy nature, hiking, and exploring the Appalachian Mountains. | Mabry Mill, Craggy Gardens, Linville Falls, Mount Mitchell, Pisgah National Forest |
| North Wilkesboro | A charming small town with rich history and community events. It's a great location for guests looking to experience local culture and festivals. | Wilkes County Courthouse, Carolinas Championship Wrestling, Multiple local festivals, Historic downtown shops, Cascades Falls Park |
| Boone | A vibrant college town with Appalachian State University. Offers a youthful atmosphere and attracts visitors year-round for outdoor activities and arts. | Blue Ridge Mountain Club, Daniel Boone Native Gardens, Appalachian State University, Hiking in the area, Local breweries and music festivals |
| West Jefferson | Known for its arts, crafts, and local economy. It's a great spot for visitors looking to explore small-town charm and the artsy vibe. | Jefferson Landing Golf Club, West Jefferson Art Gallery, Local crafts shops, River outfitters, Hiking trails |
| Wilkesboro | A historic town with a modern twist, known for its music and arts scene. Attracts tourists for events like MerleFest. | Wilkesboro's courthouse, MerleFest, Local blues and mountain music scenes, Internationals Festivals, Lake Wilkes |
| Hollins | A little-known gem at the edge of a beautiful nature preserve, perfect for nature lovers and those looking for a serene getaway. | Hollins Lake, Nature trails, Bird watching, Kayaking spots, Quiet camping |
| Lenoir | A small city with rich history in furniture making, now turning into an artistic venue with galleries and parks. | Lenoir City Park, Historic Lenoir, Local art galleries, Hiking trails nearby, Annual events and markets |
| Blowing Rock | Famous for its stunning views and as a tourist destination with upscale dining and outdoor activities. | Blowing Rock Memorial Park, The Blowing Rock, Mystery Hill, Hiking trails, Upscale restaurants |
Understanding Airbnb License Requirements & STR Laws in Purlear (2026)
While Purlear, North Carolina, United States currently shows low STR regulations, specific Airbnb license requirements might still exist or change. Always verify the latest short term rental regulations and Airbnb license requirements directly with local government authorities for Purlear to ensure full compliance before hosting.
(Source: AirROI data, 2026, finding no licensed listings among those analyzed)
Top Performing Airbnb Properties in Purlear (2026)
Benchmark your potential! Explore examples of top-performing Airbnb properties in Purlearbased on Trailing Twelve Month (TTM) revenue. Analyze their characteristics, revenue, occupancy rate, and ADR to understand what drives success in this market.

Log Cabin by a Stream, Firepit, Hot Tub, and Wi-Fi
Entire Place • 2 bedrooms
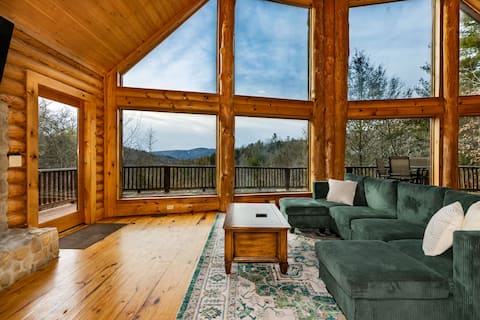
Cozy Mountain Cabin w/ Stunning Carolina Views!
Entire Place • 3 bedrooms
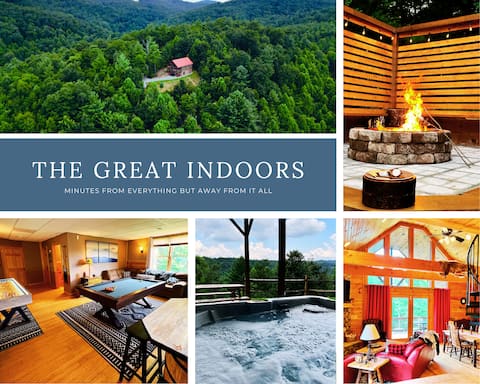
The Great Indoors Mountain Retreat w/ Hot Tub
Entire Place • 3 bedrooms

Buck Mountain Getaway: w/hot tub, fireplace, Boone
Entire Place • 3 bedrooms
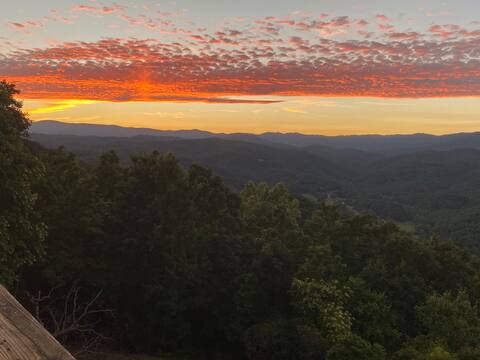
Unbeatable VIEWS! Hot tub & Fire Pit!
Entire Place • 2 bedrooms
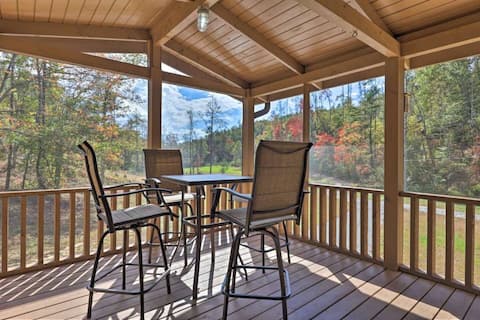
Secluded Creekside Cabin w/ Hot Tub, Screened Porc
Entire Place • 2 bedrooms
Note: Performance varies based on location, size, amenities, seasonality, and management quality. Data reflects the past 12 months.
Top Performing Airbnb Hosts in Purlear (2026)
Learn from the best! This table showcases top-performing Airbnb hosts in Purlear based on the number of properties managed and estimated total revenue over the past year. Analyze their scale and performance metrics.
| Host Name | Properties | Grossing Revenue | Stay Reviews | Avg Rating |
|---|---|---|---|---|
| Sky | 7 | $156,735 | 1090 | 4.89/5.0 |
| Benjamin & Sommer | 6 | $147,714 | 373 | 4.88/5.0 |
| Paul | 4 | $81,854 | 288 | 4.89/5.0 |
| Zach | 2 | $78,087 | 163 | 4.89/5.0 |
| Mitzi | 1 | $72,890 | 67 | 4.99/5.0 |
| Cameron | 1 | $68,763 | 150 | 4.75/5.0 |
| Michael | 1 | $67,701 | 93 | 4.99/5.0 |
| Benjamin | 2 | $62,559 | 73 | 4.99/5.0 |
| Lindsey | 1 | $62,538 | 150 | 4.90/5.0 |
| Evolve | 2 | $53,678 | 30 | 4.78/5.0 |
Analyzing the strategies of top hosts, such as their property selection, pricing, and guest communication, can offer valuable lessons for optimizing your own Airbnb operations in Purlear.
Dive Deeper: Advanced Purlear STR Market Data (2026)
Ready to unlock more insights? AirROI provides access to advanced metrics and comprehensive Airbnb data for Purlear. Explore detailed analytics beyond this report to refine your investment strategy, optimize pricing, and maximize your vacation rental profits.
Explore Advanced MetricsPurlear Short-Term Rental Market Composition (2026): Property & Room Types
Room Type Distribution
Property Type Distribution
Market Composition Insights for Purlear
- The Purlear Airbnb market composition is heavily skewed towards Entire Home/Apt listings, which make up 98% of the 49 active rentals. This indicates strong guest preference for privacy and space.
- Looking at the property type distribution in Purlear, Outdoor/Unique properties are the most common (61.2%), reflecting the local real estate landscape.
- Houses represent a significant 36.7% portion, catering likely to families or larger groups.
- Smaller segments like unique stays (combined 2.0%) offer potential for unique stay experiences.
Purlear Airbnb Room Capacity Analysis (2026): Bedroom Distribution
Distribution of Listings by Number of Bedrooms
Room Capacity Insights for Purlear
- The dominant room capacity in Purlear is 1 bedroom listings, making up 34.7% of the market. This suggests a strong demand for properties suitable for couples or solo travelers.
- Together, 1 bedroom and 2 bedrooms properties represent 63.3% of the active Airbnb listings in Purlear, indicating a high concentration in these sizes.
- A significant 34.6% of listings offer 3+ bedrooms, catering to larger groups and families seeking more space in Purlear.
Purlear Vacation Rental Guest Capacity Trends (2026)
Distribution of Listings by Guest Capacity
Guest Capacity Insights for Purlear
- The most common guest capacity trend in Purlear vacation rentals is listings accommodating 4 guests (30.6%). This suggests the primary traveler segment is likely small families or groups.
- Properties designed for 4 guests and 8+ guests dominate the Purlear STR market, accounting for 55.1% of listings.
- 40.8% of properties accommodate 6+ guests, serving the market segment for larger families or group travel in Purlear.
- On average, properties in Purlear are equipped to host 5.0 guests.
Purlear Airbnb Booking Patterns (2026): Available vs. Booked Days
Available Days Distribution
Booked Days Distribution
Booking Pattern Insights for Purlear
- The most common availability pattern in Purlear falls within the 181-270 days range, representing 40.8% of listings. This suggests many properties have significant open periods on their calendars.
- Approximately 73.5% of listings show high availability (181+ days open annually), indicating potential for increased bookings or specific owner usage patterns.
- For booked days, the 91-180 days range is most frequent in Purlear (40.8%), reflecting common guest stay durations or potential owner blocking patterns.
- A notable 26.5% of properties secure long booking periods (181+ days booked per year), highlighting successful long-term rental strategies or significant owner usage.
Purlear Airbnb Minimum Stay Requirements Analysis
Distribution of Listings by Minimum Night Requirement
1 Night
15 listings
30.6% of total
2 Nights
19 listings
38.8% of total
3 Nights
2 listings
4.1% of total
30+ Nights
13 listings
26.5% of total
Key Insights
- The most prevalent minimum stay requirement in Purlear is 2 Nights, adopted by 38.8% of listings. This highlights the market's preference for shorter, flexible bookings.
- A strong majority (69.4%) of the Purlear Airbnb data shows acceptance of very short stays (1-2 nights), indicating a dynamic, high-turnover market.
- A significant segment (26.5%) caters to monthly stays (30+ nights) in Purlear, pointing to opportunities in the extended-stay market.
Recommendations
- Align with the market by considering a 2 Nights minimum stay, as 38.8% of Purlear hosts use this setting.
- Explore offering discounts for stays of 30+ nights to attract the 26.5% of the market seeking extended stays.
- Adjust minimum nights based on seasonality – potentially shorter during low season and longer during peak demand periods in Purlear.
Purlear Airbnb Cancellation Policy Trends Analysis (2026)
Limited
3 listings
6.1% of total
Super Strict 30 Days
2 listings
4.1% of total
Flexible
3 listings
6.1% of total
Moderate
18 listings
36.7% of total
Firm
20 listings
40.8% of total
Strict
3 listings
6.1% of total
Cancellation Policy Insights for Purlear
- The prevailing Airbnb cancellation policy trend in Purlear is Firm, used by 40.8% of listings.
- There's a relatively balanced mix between guest-friendly (42.8%) and stricter (46.9%) policies, offering choices for different guest needs.
- Strict cancellation policies are quite rare (6.1%), potentially making listings with this policy less competitive unless justified by high demand or property type.
Recommendations for Hosts
- Consider adopting a Firm policy to align with the 40.8% market standard in Purlear.
- Using a Strict policy might deter some guests, as only 6.1% of listings use it. Evaluate if potential revenue protection outweighs possible lower booking rates.
- Regularly review your cancellation policy against competitors and market demand shifts in Purlear.
Purlear STR Booking Lead Time Analysis (2026)
Average Booking Lead Time by Month
Booking Lead Time Insights for Purlear
- The overall average booking lead time for vacation rentals in Purlear is 72 days.
- Guests book furthest in advance for stays during April (average 110 days), likely coinciding with peak travel demand or local events.
- The shortest booking windows occur for stays in January (average 39 days), indicating more last-minute travel plans during this time.
- Seasonally, Spring (87 days avg.) sees the longest lead times, while Winter (59 days avg.) has the shortest, reflecting typical travel planning cycles.
Recommendations for Hosts
- Use the overall average lead time (72 days) as a baseline for your pricing and availability strategy in Purlear.
- For April stays, consider implementing length-of-stay discounts or slightly higher rates for bookings made less than 110 days out to capitalize on advance planning.
- Target marketing efforts for the Spring season well in advance (at least 87 days) to capture early planners.
- Monitor your own booking lead times against these Purlear averages to identify opportunities for dynamic pricing adjustments.
Popular & Essential Airbnb Amenities in Purlear (2026)
Amenity Prevalence
Amenity Insights for Purlear
- Essential amenities in Purlear that guests expect include: Smoke alarm, Coffee maker, Free parking on premises. Lacking these (any) could significantly impact bookings.
- Popular amenities like Microwave, Fire extinguisher, Dishes and silverware are common but not universal. Offering these can provide a competitive edge.
Recommendations for Hosts
- Ensure your listing includes all essential amenities for Purlear: Smoke alarm, Coffee maker, Free parking on premises.
- Prioritize adding missing essentials: Coffee maker, Free parking on premises.
- Consider adding popular differentiators like Microwave or Fire extinguisher to increase appeal.
- Highlight unique or less common amenities you offer (e.g., hot tub, dedicated workspace, EV charger) in your listing description and photos.
- Regularly check competitor amenities in Purlear to stay competitive.
Purlear Airbnb Guest Demographics & Profile Analysis (2026)
Guest Profile Summary for Purlear
- The typical guest profile for Airbnb in Purlear consists of primarily domestic travelers (98%), often arriving from nearby Charlotte, typically belonging to the Post-2000s (Gen Z/Alpha) group (50%), primarily speaking English or Spanish.
- Domestic travelers account for 97.8% of guests.
- Key international markets include United States (97.8%) and DC (0.7%).
- Top languages spoken are English (74%) followed by Spanish (13.7%).
- A significant demographic segment is the Post-2000s (Gen Z/Alpha) group, representing 50% of guests.
Recommendations for Hosts
- Target domestic marketing efforts towards travelers from Charlotte and Raleigh.
- Tailor amenities and listing descriptions to appeal to the dominant Post-2000s (Gen Z/Alpha) demographic (e.g., highlight fast WiFi, smart home features, local guides).
- Highlight unique local experiences or amenities relevant to the primary guest profile.
- Consider seasonal promotions aligned with peak travel times for key origin markets.
Nearby Short-Term Rental Market Comparison
How does the Purlear Airbnb market stack up against its neighbors? Compare key performance metrics like average monthly revenue, ADR, and occupancy rates in surrounding areas to understand the broader regional STR landscape.
| Market | Active Properties | Monthly Revenue | Daily Rate | Avg. Occupancy |
|---|---|---|---|---|
| Denver | 109 | $6,309 | $590.96 | 45% |
| Catawba | 16 | $6,093 | $582.49 | 38% |
| Mooresville | 369 | $5,702 | $559.93 | 42% |
| Sherrills Ford | 107 | $5,615 | $547.26 | 41% |
| Troutman | 49 | $5,587 | $467.90 | 42% |
| Lake Norman of Catawba | 51 | $4,972 | $513.30 | 43% |
| Union Mills | 15 | $4,938 | $442.76 | 41% |
| Blacksburg | 297 | $4,116 | $509.14 | 40% |
| Fletcher | 113 | $3,859 | $333.95 | 46% |
| Buncombe County | 13 | $3,849 | $317.20 | 45% |