Old Fort Airbnb Market Analysis 2026: Short Term Rental Data & Vacation Rental Statistics in North Carolina, United States
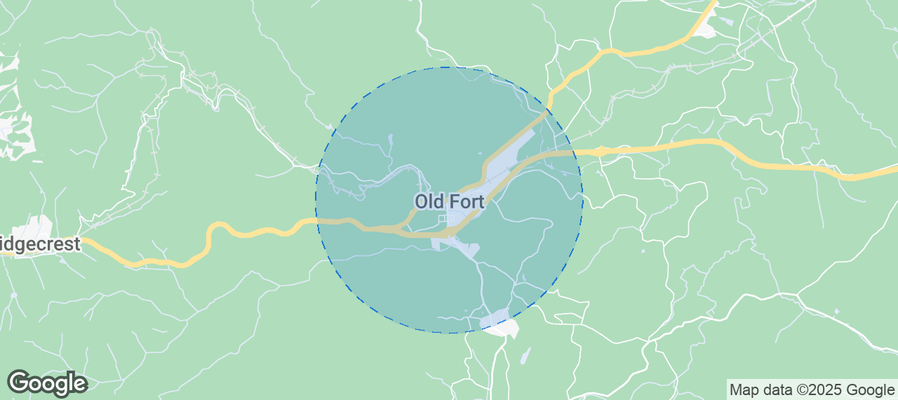
Is Airbnb profitable in Old Fort in 2026? Explore comprehensive Airbnb analytics for Old Fort, North Carolina, United States to uncover income potential. This 2026 STR market report for Old Fort, based on AirROI data from February 2025 to January 2026, reveals key trends in the niche market of 89 active listings.
Whether you're considering an Airbnb investment in Old Fort, optimizing your existing vacation rental, or exploring rental arbitrage opportunities, understanding the Old Fort Airbnb data is crucial. Leveraging the low regulation environment is key to maximizing your short term rental income potential. Let's dive into the specifics.
Key Old Fort Airbnb Performance Metrics Overview
Monthly Airbnb Revenue Variations & Income Potential in Old Fort (2026)
Understanding the monthly revenue variations for Airbnb listings in Old Fort is key to maximizing your short term rental income potential. Seasonality significantly impacts earnings. Our analysis, based on data from the past 12 months, shows that the peak revenue month for STRs in Old Fort is typically October, while February often presents the lowest earnings, highlighting opportunities for strategic pricing adjustments during shoulder and low seasons. Explore the typical Airbnb income in Old Fort across different performance tiers:
- Best-in-class properties (Top 10%) achieve $7,151+ monthly, often utilizing dynamic pricing and superior guest experiences.
- Strong performing properties (Top 25%) earn $4,157 or more, indicating effective management and desirable locations/amenities.
- Typical properties (Median) generate around $2,337 per month, representing the average market performance.
- Entry-level properties (Bottom 25%) see earnings around $1,233, often with potential for optimization.
Average Monthly Airbnb Earnings Trend in Old Fort
Old Fort Airbnb Occupancy Rate Trends (2026)
Maximize your bookings by understanding the Old Fort STR occupancy trends. Seasonal demand shifts significantly influence how often properties are booked. Typically, Octobersees the highest demand (peak season occupancy), while February experiences the lowest (low season). Effective strategies, like adjusting minimum stays or offering promotions, can boost occupancy during slower periods. Here's how different property tiers perform in Old Fort:
- Best-in-class properties (Top 10%) achieve 77%+ occupancy, indicating high desirability and potentially optimized availability.
- Strong performing properties (Top 25%) maintain 58% or higher occupancy, suggesting good market fit and guest satisfaction.
- Typical properties (Median) have an occupancy rate around 34%.
- Entry-level properties (Bottom 25%) average 19% occupancy, potentially facing higher vacancy.
Average Monthly Occupancy Rate Trend in Old Fort
Average Daily Rate (ADR) Airbnb Trends in Old Fort (2026)
Effective short term rental pricing strategy in Old Fort involves understanding monthly ADR fluctuations. The Average Daily Rate (ADR) for Airbnb in Old Fort typically peaks in December and dips lowest during February. Leveraging Airbnb dynamic pricing tools or strategies based on this seasonality can significantly boost revenue. Here's a look at the typical nightly rates achieved:
- Best-in-class properties (Top 10%) command rates of $444+ per night, often due to premium features or locations.
- Strong performing properties (Top 25%) achieve nightly rates of $326 or more.
- Typical properties (Median) charge around $222 per night.
- Entry-level properties (Bottom 25%) earn around $139 per night.
Average Daily Rate (ADR) Trend by Month in Old Fort
Get Live Old Fort Market Intelligence 👇
Explore Real-time Analytics
Airbnb Seasonality Analysis & Trends in Old Fort (2026)
Peak Season (October, December, November)
- Revenue averages $4,419 per month
- Occupancy rates average 49.3%
- Daily rates average $285
Shoulder Season
- Revenue averages $3,056 per month
- Occupancy maintains around 38.0%
- Daily rates hold near $273
Low Season (February, March, May)
- Revenue drops to average $2,290 per month
- Occupancy decreases to average 33.9%
- Daily rates adjust to average $259
Seasonality Insights for Old Fort
- The Airbnb seasonality in Old Fort shows highly seasonal trends requiring careful strategy. While the sections above show seasonal averages, it's also insightful to look at the extremes:
- During the high season, the absolute peak month showcases Old Fort's highest earning potential, with monthly revenues capable of climbing to $4,650, occupancy reaching a high of 52.1%, and ADRs peaking at $290.
- Conversely, the slowest single month of the year, typically falling within the low season, marks the market's lowest point. In this month, revenue might dip to $2,104, occupancy could drop to 31.7%, and ADRs may adjust down to $252.
- Understanding both the seasonal averages and these monthly peaks and troughs in revenue, occupancy, and ADR is crucial for maximizing your Airbnb profit potential in Old Fort.
Seasonal Strategies for Maximizing Profit
- Peak Season: Maximize revenue through premium pricing and potentially longer minimum stays. Ensure high availability.
- Low Season: Offer competitive pricing, special promotions (e.g., extended stay discounts), and flexible cancellation policies. Target off-season travelers like remote workers or budget-conscious guests.
- Shoulder Seasons: Implement dynamic pricing that balances peak and low rates. Target weekend travelers or specific events. Offer slightly more flexible terms than peak season.
- Regularly analyze your own performance against these Old Fort seasonality benchmarks and adjust your pricing and availability strategy accordingly.
Best Areas for Airbnb Investment in Old Fort (2026)
Exploring the top neighborhoods for short-term rentals in Old Fort? This section highlights key areas, outlining why they are attractive for hosts and guests, along with notable local attractions. Consider these locations based on your target guest profile and investment strategy.
| Neighborhood / Area | Why Host Here? (Target Guests & Appeal) | Key Attractions & Landmarks |
|---|---|---|
| Lake Lure | A scenic lake resort area popular for its stunning mountain views and outdoor activities. Ideal for families and nature lovers looking for a peaceful retreat. | Lake Lure, Chimney Rock State Park, Lake Lure Flowering Bridge, Ziplining at Chimney Rock, Boating & Water Sports |
| Blue Ridge Parkway | A majestic scenic highway known for its breathtaking views, hiking trails, and vibrant fall foliage. Attracts tourists looking to experience the beauty of the Blue Ridge Mountains. | Blue Ridge Parkway, Hiking Trails, Picnic Areas, Waterfalls, Overlooks |
| Asheville | A vibrant city known for its arts scene and historic architecture. Popular with travelers seeking a blend of cultural attractions and natural beauty. | Biltmore Estate, Downtown Asheville, Blue Ridge Brewery, River Arts District, Western North Carolina Nature Center |
| Hot Springs | A unique destination known for its natural hot springs and outdoor recreational opportunities. Great for travelers looking for relaxation and adventure. | Hot Springs National Park, Appalachian Trail, Spa Treatments, Rafting, Fishing |
| Hendersonville | A charming small town with a rich apple-growing heritage. Ideal for visitors wanting a quaint shopping experience and local festivals. | Apple Orchards, Downtown Hendersonville, Dupont State Forest, Henderson County Heritage Museum, Flat Rock Playhouse |
| Pisgah National Forest | A beautiful forest area offering outdoor activities like hiking, biking, and camping. Perfect for nature enthusiasts and adventurers. | Hiking Trails, Waterfalls, Mountain Biking, Camping, Wildlife Watching |
| Black Mountain | A quaint town known for its art galleries and mountain views. Attracts visitors looking for a peaceful mountain getaway with local charm. | Downtown Black Mountain, Art Galleries, Lake Tomahawk, Blue Ridge Coffee, Hiking Trails |
| Burnsville | An artsy town located near the Appalachian Trail, known for its local arts and crafts scene. Popular with hikers and art enthusiasts alike. | Yancey History Association, Burnsville Town Center, Mount Mitchell State Park, Arts & Crafts Shops, Appalachian Trail |
Understanding Airbnb License Requirements & STR Laws in Old Fort (2026)
While Old Fort, North Carolina, United States currently shows low STR regulations, specific Airbnb license requirements might still exist or change. Always verify the latest short term rental regulations and Airbnb license requirements directly with local government authorities for Old Fort to ensure full compliance before hosting.
(Source: AirROI data, 2026, finding no licensed listings among those analyzed)
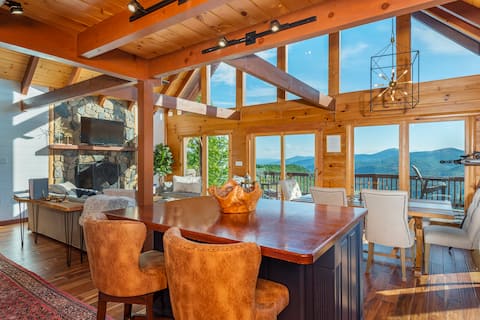
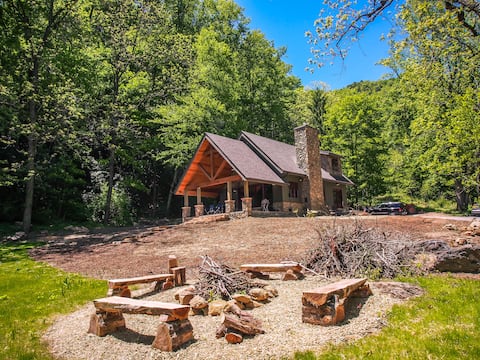
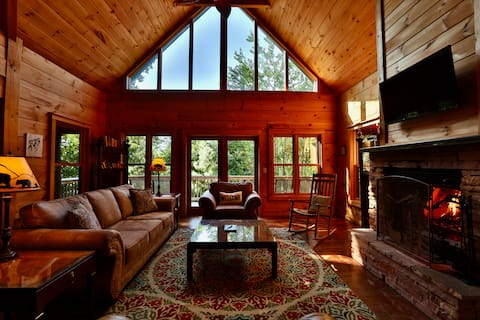
Top Performing Airbnb Properties in Old Fort (2026)
Benchmark your potential! Explore examples of top-performing Airbnb properties in Old Fortbased on Trailing Twelve Month (TTM) revenue. Analyze their characteristics, revenue, occupancy rate, and ADR to understand what drives success in this market.

cozy, private retreat w/ hot tub & fireplace
Entire Place • 2 bedrooms
A Celestial Chalet | Pets, Hot Tub & Mountain View
Entire Place • 3 bedrooms
Indigo Nature Retreat | Full Venue Rental
Entire Place • 8 bedrooms
Serene Retreat Cabin W/Hot Tub close to Asheville
Entire Place • 4 bedrooms
The Breakaway at Catawba Falls
Entire Place • 3 bedrooms
Log Cabin Hot Tub Starlink 25 Min to Asheville
Entire Place • 3 bedrooms
Note: Performance varies based on location, size, amenities, seasonality, and management quality. Data reflects the past 12 months.
Top Performing Airbnb Hosts in Old Fort (2026)
Learn from the best! This table showcases top-performing Airbnb hosts in Old Fort based on the number of properties managed and estimated total revenue over the past year. Analyze their scale and performance metrics.
| Host Name | Properties | Grossing Revenue | Stay Reviews | Avg Rating |
|---|---|---|---|---|
| Greybeard Rentals | 15 | $628,181 | 278 | 4.89/5.0 |
| Tonya | 3 | $233,240 | 1328 | 4.89/5.0 |
| Lisa | 11 | $212,156 | 456 | 4.98/5.0 |
| Shealy | 1 | $137,386 | 155 | 5.00/5.0 |
| Lexi | 1 | $92,377 | 58 | 4.97/5.0 |
| Melissa | 1 | $81,504 | 756 | 4.99/5.0 |
| Evolve | 3 | $79,629 | 69 | 4.89/5.0 |
| Elena | 1 | $79,580 | 108 | 4.92/5.0 |
| Candace | 2 | $75,435 | 217 | 4.96/5.0 |
| Patrick And Lisa | 3 | $74,933 | 296 | 4.99/5.0 |
Analyzing the strategies of top hosts, such as their property selection, pricing, and guest communication, can offer valuable lessons for optimizing your own Airbnb operations in Old Fort.
Dive Deeper: Advanced Old Fort STR Market Data (2026)
Ready to unlock more insights? AirROI provides access to advanced metrics and comprehensive Airbnb data for Old Fort. Explore detailed analytics beyond this report to refine your investment strategy, optimize pricing, and maximize your vacation rental profits.
Explore Advanced MetricsOld Fort Short-Term Rental Market Composition (2026): Property & Room Types
Room Type Distribution
Property Type Distribution
Market Composition Insights for Old Fort
- The Old Fort Airbnb market composition is heavily skewed towards Entire Home/Apt listings, which make up 95.5% of the 89 active rentals. This indicates strong guest preference for privacy and space.
- Looking at the property type distribution in Old Fort, House properties are the most common (52.8%), reflecting the local real estate landscape.
- Houses represent a significant 52.8% portion, catering likely to families or larger groups.
- Smaller segments like others, hotel/boutique, apartment/condo, unique stays (combined 10.1%) offer potential for unique stay experiences.
Old Fort Airbnb Room Capacity Analysis (2026): Bedroom Distribution
Distribution of Listings by Number of Bedrooms
Room Capacity Insights for Old Fort
- The dominant room capacity in Old Fort is 3 bedrooms listings, making up 31.5% of the market. This suggests a strong demand for properties suitable for families or small groups.
- Together, 3 bedrooms and 2 bedrooms properties represent 51.7% of the active Airbnb listings in Old Fort, indicating a high concentration in these sizes.
- A significant 47.3% of listings offer 3+ bedrooms, catering to larger groups and families seeking more space in Old Fort.
Old Fort Vacation Rental Guest Capacity Trends (2026)
Distribution of Listings by Guest Capacity
Guest Capacity Insights for Old Fort
- The most common guest capacity trend in Old Fort vacation rentals is listings accommodating 8+ guests (27%). This suggests the primary traveler segment is likely larger groups.
- Properties designed for 8+ guests and 6 guests dominate the Old Fort STR market, accounting for 51.7% of listings.
- 55.1% of properties accommodate 6+ guests, serving the market segment for larger families or group travel in Old Fort.
- On average, properties in Old Fort are equipped to host 5.1 guests.
Old Fort Airbnb Booking Patterns (2026): Available vs. Booked Days
Available Days Distribution
Booked Days Distribution
Booking Pattern Insights for Old Fort
- The most common availability pattern in Old Fort falls within the 271-366 days range, representing 48.3% of listings. This suggests many properties have significant open periods on their calendars.
- Approximately 80.9% of listings show high availability (181+ days open annually), indicating potential for increased bookings or specific owner usage patterns.
- For booked days, the 31-90 days range is most frequent in Old Fort (33.7%), reflecting common guest stay durations or potential owner blocking patterns.
- A notable 20.2% of properties secure long booking periods (181+ days booked per year), highlighting successful long-term rental strategies or significant owner usage.
Old Fort Airbnb Minimum Stay Requirements Analysis
Distribution of Listings by Minimum Night Requirement
1 Night
22 listings
24.7% of total
2 Nights
23 listings
25.8% of total
3 Nights
7 listings
7.9% of total
30+ Nights
37 listings
41.6% of total
Key Insights
- The most prevalent minimum stay requirement in Old Fort is 30+ Nights, adopted by 41.6% of listings. This highlights the market's preference for longer commitments.
- A significant segment (41.6%) caters to monthly stays (30+ nights) in Old Fort, pointing to opportunities in the extended-stay market.
Recommendations
- Align with the market by considering a 30+ Nights minimum stay, as 41.6% of Old Fort hosts use this setting.
- If feasible, allowing 1-night stays, especially midweek or during low season, could capture last-minute bookings, as only 24.7% currently do.
- Explore offering discounts for stays of 30+ nights to attract the 41.6% of the market seeking extended stays.
- Adjust minimum nights based on seasonality – potentially shorter during low season and longer during peak demand periods in Old Fort.
Old Fort Airbnb Cancellation Policy Trends Analysis (2026)
Super Strict 60 Days
2 listings
2.2% of total
Super Strict 30 Days
1 listings
1.1% of total
Limited
2 listings
2.2% of total
Flexible
10 listings
11.2% of total
Moderate
29 listings
32.6% of total
Firm
35 listings
39.3% of total
Strict
10 listings
11.2% of total
Cancellation Policy Insights for Old Fort
- The prevailing Airbnb cancellation policy trend in Old Fort is Firm, used by 39.3% of listings.
- A majority (50.5%) of hosts in Old Fort utilize Firm or Strict policies, indicating a market where hosts prioritize booking security.
Recommendations for Hosts
- Consider adopting a Firm policy to align with the 39.3% market standard in Old Fort.
- Using a Strict policy might deter some guests, as only 11.2% of listings use it. Evaluate if potential revenue protection outweighs possible lower booking rates.
- Regularly review your cancellation policy against competitors and market demand shifts in Old Fort.
Old Fort STR Booking Lead Time Analysis (2026)
Average Booking Lead Time by Month
Booking Lead Time Insights for Old Fort
- The overall average booking lead time for vacation rentals in Old Fort is 54 days.
- Guests book furthest in advance for stays during September (average 77 days), likely coinciding with peak travel demand or local events.
- The shortest booking windows occur for stays in February (average 24 days), indicating more last-minute travel plans during this time.
- Seasonally, Fall (67 days avg.) sees the longest lead times, while Winter (31 days avg.) has the shortest, reflecting typical travel planning cycles.
Recommendations for Hosts
- Use the overall average lead time (54 days) as a baseline for your pricing and availability strategy in Old Fort.
- For September stays, consider implementing length-of-stay discounts or slightly higher rates for bookings made less than 77 days out to capitalize on advance planning.
- Target marketing efforts for the Fall season well in advance (at least 67 days) to capture early planners.
- Monitor your own booking lead times against these Old Fort averages to identify opportunities for dynamic pricing adjustments.
Popular & Essential Airbnb Amenities in Old Fort (2026)
Amenity Prevalence
Amenity Insights for Old Fort
- Essential amenities in Old Fort that guests expect include: Air conditioning, Smoke alarm, Heating, Coffee maker, Hot water, Free parking on premises, Refrigerator, Wifi, Dishes and silverware, Kitchen. Lacking these (any) could significantly impact bookings.
Recommendations for Hosts
- Ensure your listing includes all essential amenities for Old Fort: Air conditioning, Smoke alarm, Heating, Coffee maker, Hot water, Free parking on premises, Refrigerator, Wifi, Dishes and silverware, Kitchen.
- Prioritize adding missing essentials: Coffee maker, Hot water, Free parking on premises, Refrigerator, Wifi, Dishes and silverware, Kitchen.
- Highlight unique or less common amenities you offer (e.g., hot tub, dedicated workspace, EV charger) in your listing description and photos.
- Regularly check competitor amenities in Old Fort to stay competitive.
Old Fort Airbnb Guest Demographics & Profile Analysis (2026)
Guest Profile Summary for Old Fort
- The typical guest profile for Airbnb in Old Fort consists of primarily domestic travelers (98%), often arriving from nearby Charlotte, typically belonging to the Post-2000s (Gen Z/Alpha) group (50%), primarily speaking English or Spanish.
- Domestic travelers account for 97.7% of guests.
- Key international markets include United States (97.7%) and DC (0.5%).
- Top languages spoken are English (73.3%) followed by Spanish (13%).
- A significant demographic segment is the Post-2000s (Gen Z/Alpha) group, representing 50% of guests.
Recommendations for Hosts
- Target domestic marketing efforts towards travelers from Charlotte and Raleigh.
- Tailor amenities and listing descriptions to appeal to the dominant Post-2000s (Gen Z/Alpha) demographic (e.g., highlight fast WiFi, smart home features, local guides).
- Highlight unique local experiences or amenities relevant to the primary guest profile.
- Consider seasonal promotions aligned with peak travel times for key origin markets.
Nearby Short-Term Rental Market Comparison
How does the Old Fort Airbnb market stack up against its neighbors? Compare key performance metrics like average monthly revenue, ADR, and occupancy rates in surrounding areas to understand the broader regional STR landscape.
| Market | Active Properties | Monthly Revenue | Daily Rate | Avg. Occupancy |
|---|---|---|---|---|
| Sevier County | 68 | $7,108 | $567.95 | 44% |
| Catawba | 16 | $6,093 | $582.49 | 38% |
| Union Mills | 15 | $4,938 | $442.76 | 41% |
| Sevierville | 6,269 | $4,747 | $370.20 | 46% |
| Six Mile | 57 | $4,396 | $449.78 | 42% |
| Gatlinburg | 3,565 | $4,385 | $353.70 | 45% |
| Commerce | 19 | $4,298 | $285.34 | 45% |
| Pigeon Forge | 2,938 | $4,158 | $337.10 | 45% |
| West Union | 30 | $4,126 | $564.92 | 32% |
| Sautee | 14 | $4,105 | $408.17 | 39% |