New Bern Airbnb Market Analysis 2026: Short Term Rental Data & Vacation Rental Statistics in North Carolina, United States
Is Airbnb profitable in New Bern in 2026? Explore comprehensive Airbnb analytics for New Bern, North Carolina, United States to uncover income potential. This 2026 STR market report for New Bern, based on AirROI data from February 2025 to January 2026, reveals key trends in the niche market of 188 active listings.
Whether you're considering an Airbnb investment in New Bern, optimizing your existing vacation rental, or exploring rental arbitrage opportunities, understanding the New Bern Airbnb data is crucial. Leveraging the low regulation environment is key to maximizing your short term rental income potential. Let's dive into the specifics.
Key New Bern Airbnb Performance Metrics Overview
Monthly Airbnb Revenue Variations & Income Potential in New Bern (2026)
Understanding the monthly revenue variations for Airbnb listings in New Bern is key to maximizing your short term rental income potential. Seasonality significantly impacts earnings. Our analysis, based on data from the past 12 months, shows that the peak revenue month for STRs in New Bern is typically June, while January often presents the lowest earnings, highlighting opportunities for strategic pricing adjustments during shoulder and low seasons. Explore the typical Airbnb income in New Bern across different performance tiers:
- Best-in-class properties (Top 10%) achieve $4,203+ monthly, often utilizing dynamic pricing and superior guest experiences.
- Strong performing properties (Top 25%) earn $3,037 or more, indicating effective management and desirable locations/amenities.
- Typical properties (Median) generate around $1,992 per month, representing the average market performance.
- Entry-level properties (Bottom 25%) see earnings around $1,153, often with potential for optimization.
Average Monthly Airbnb Earnings Trend in New Bern
New Bern Airbnb Occupancy Rate Trends (2026)
Maximize your bookings by understanding the New Bern STR occupancy trends. Seasonal demand shifts significantly influence how often properties are booked. Typically, Junesees the highest demand (peak season occupancy), while January experiences the lowest (low season). Effective strategies, like adjusting minimum stays or offering promotions, can boost occupancy during slower periods. Here's how different property tiers perform in New Bern:
- Best-in-class properties (Top 10%) achieve 77%+ occupancy, indicating high desirability and potentially optimized availability.
- Strong performing properties (Top 25%) maintain 62% or higher occupancy, suggesting good market fit and guest satisfaction.
- Typical properties (Median) have an occupancy rate around 42%.
- Entry-level properties (Bottom 25%) average 24% occupancy, potentially facing higher vacancy.
Average Monthly Occupancy Rate Trend in New Bern
Average Daily Rate (ADR) Airbnb Trends in New Bern (2026)
Effective short term rental pricing strategy in New Bern involves understanding monthly ADR fluctuations. The Average Daily Rate (ADR) for Airbnb in New Bern typically peaks in December and dips lowest during March. Leveraging Airbnb dynamic pricing tools or strategies based on this seasonality can significantly boost revenue. Here's a look at the typical nightly rates achieved:
- Best-in-class properties (Top 10%) command rates of $251+ per night, often due to premium features or locations.
- Strong performing properties (Top 25%) achieve nightly rates of $191 or more.
- Typical properties (Median) charge around $153 per night.
- Entry-level properties (Bottom 25%) earn around $121 per night.
Average Daily Rate (ADR) Trend by Month in New Bern
Get Live New Bern Market Intelligence 👇

Explore Real-time Analytics
Airbnb Seasonality Analysis & Trends in New Bern (2026)
Peak Season (June, July, October)
- Revenue averages $2,754 per month
- Occupancy rates average 50.0%
- Daily rates average $175
Shoulder Season
- Revenue averages $2,316 per month
- Occupancy maintains around 43.8%
- Daily rates hold near $169
Low Season (January, February, March)
- Revenue drops to average $1,777 per month
- Occupancy decreases to average 37.0%
- Daily rates adjust to average $160
Seasonality Insights for New Bern
- The Airbnb seasonality in New Bern shows moderate seasonality with distinct peak and low periods. While the sections above show seasonal averages, it's also insightful to look at the extremes:
- During the high season, the absolute peak month showcases New Bern's highest earning potential, with monthly revenues capable of climbing to $2,837, occupancy reaching a high of 52.4%, and ADRs peaking at $180.
- Conversely, the slowest single month of the year, typically falling within the low season, marks the market's lowest point. In this month, revenue might dip to $1,471, occupancy could drop to 26.4%, and ADRs may adjust down to $151.
- Understanding both the seasonal averages and these monthly peaks and troughs in revenue, occupancy, and ADR is crucial for maximizing your Airbnb profit potential in New Bern.
Seasonal Strategies for Maximizing Profit
- Peak Season: Maximize revenue through premium pricing and potentially longer minimum stays. Ensure high availability.
- Low Season: Offer competitive pricing, special promotions (e.g., extended stay discounts), and flexible cancellation policies. Target off-season travelers like remote workers or budget-conscious guests.
- Shoulder Seasons: Implement dynamic pricing that balances peak and low rates. Target weekend travelers or specific events. Offer slightly more flexible terms than peak season.
- Regularly analyze your own performance against these New Bern seasonality benchmarks and adjust your pricing and availability strategy accordingly.
Best Areas for Airbnb Investment in New Bern (2026)
Exploring the top neighborhoods for short-term rentals in New Bern? This section highlights key areas, outlining why they are attractive for hosts and guests, along with notable local attractions. Consider these locations based on your target guest profile and investment strategy.
| Neighborhood / Area | Why Host Here? (Target Guests & Appeal) | Key Attractions & Landmarks |
|---|---|---|
| Historic Downtown | The heart of New Bern, full of charm and history with beautiful architecture, shops, and restaurants. It's a prime location for tourists wanting to explore the city's history and culture. | Tryon Palace, New Bern Civic Theatre, Bear Plaza, Union Point Park, Craven County Historical Society Museum |
| Cove City | A quaint village close to New Bern, ideal for visitors looking for a rural getaway while still having access to city amenities. Offers a peaceful atmosphere and outdoor activities. | Cove City Park, Greenway Trails, local farms and markets |
| Riverfront | Scenic views of the Neuse River, perfect for those looking to enjoy waterfront activities. This area is popular for fishing, kayaking, and outdoor dining. | Neuse River Recreation Area, Riverfront Park, waterfront restaurants, kayak rentals |
| Brookstone | A residential area that is family-friendly and offers easy access to downtown New Bern. Great for families looking to rent space during local events. | local parks, shopping centers, easy access to downtown attractions |
| Bridgeton | A charming small town on the banks of the Neuse River, providing a serene environment that's appealing for nature lovers and fishing enthusiasts. | Bridgeton Riverwalk, Historic Bridgeton Cemetery, local marinas |
| New Bern Golf & Country Club | Ideal for golf enthusiasts, this area offers beautiful greens and a peaceful suburban feel, attracting visitors wanting leisure and relaxation. | New Bern Golf Course, swimming pool, community events |
| Trent Woods | An upscale residential community close to the city center with a serene atmosphere. Popular among travelers seeking quality accommodations and local charm. | Trent Woods Park, local shops, high-end dining options |
| Havelock | Just outside New Bern, Havelock is a growing city that draws visitors to the nearby Marine Corps Air Station. Offers a blend of city life and military history. | Havelock Tourist & Event Center, local museums, Cherry Point |
Understanding Airbnb License Requirements & STR Laws in New Bern (2026)
While New Bern, North Carolina, United States currently shows low STR regulations, specific Airbnb license requirements might still exist or change. Always verify the latest short term rental regulations and Airbnb license requirements directly with local government authorities for New Bern to ensure full compliance before hosting.
(Source: AirROI data, 2026, finding no licensed listings among those analyzed)
Top Performing Airbnb Properties in New Bern (2026)
Benchmark your potential! Explore examples of top-performing Airbnb properties in New Bernbased on Trailing Twelve Month (TTM) revenue. Analyze their characteristics, revenue, occupancy rate, and ADR to understand what drives success in this market.

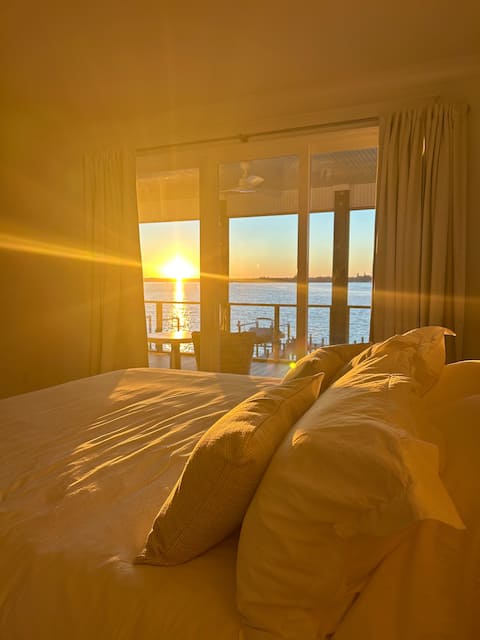
Little piece of heaven in your own back yard!
Entire Place • 4 bedrooms
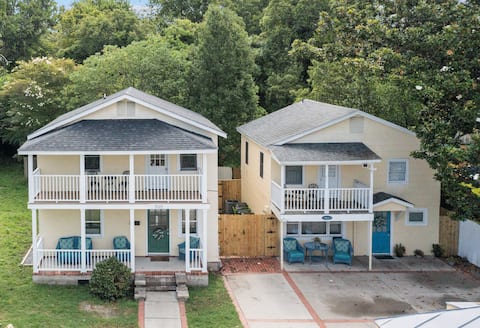
Crew Bern House
Entire Place • 3 bedrooms
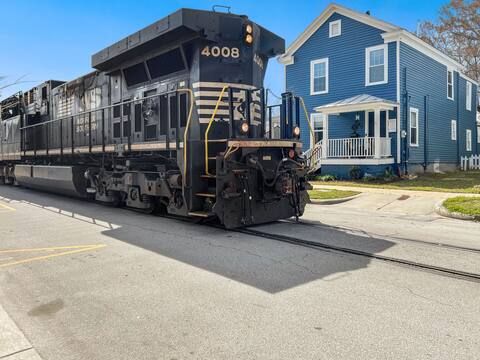
Double Up in Downtown
Entire Place • 5 bedrooms
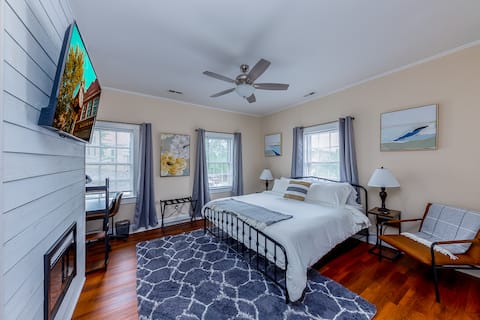
Downtown Gem | Walk Everywhere | FirePit & Bikes
Entire Place • 3 bedrooms
Amazing 3 BR House | Downtown New Bern | Sleeps 8
Entire Place • 3 bedrooms

Point on Pollock - Full House
Entire Place • 5 bedrooms
Note: Performance varies based on location, size, amenities, seasonality, and management quality. Data reflects the past 12 months.
Top Performing Airbnb Hosts in New Bern (2026)
Learn from the best! This table showcases top-performing Airbnb hosts in New Bern based on the number of properties managed and estimated total revenue over the past year. Analyze their scale and performance metrics.
| Host Name | Properties | Grossing Revenue | Stay Reviews | Avg Rating |
|---|---|---|---|---|
| Evolve | 22 | $458,456 | 653 | 4.85/5.0 |
| Results Property Management | 10 | $338,909 | 279 | 4.73/5.0 |
| Michael | 8 | $230,303 | 231 | 4.94/5.0 |
| Gretchen | 7 | $113,830 | 63 | 4.96/5.0 |
| Blake | 3 | $108,930 | 167 | 4.78/5.0 |
| David | 1 | $106,597 | 85 | 4.99/5.0 |
| David And Patricia | 3 | $103,101 | 248 | 4.94/5.0 |
| Sandy | 5 | $97,314 | 353 | 4.94/5.0 |
| Meadows Inn | 7 | $96,632 | 44 | 5.00/5.0 |
| David | 3 | $93,986 | 506 | 4.87/5.0 |
Analyzing the strategies of top hosts, such as their property selection, pricing, and guest communication, can offer valuable lessons for optimizing your own Airbnb operations in New Bern.
Dive Deeper: Advanced New Bern STR Market Data (2026)
Ready to unlock more insights? AirROI provides access to advanced metrics and comprehensive Airbnb data for New Bern. Explore detailed analytics beyond this report to refine your investment strategy, optimize pricing, and maximize your vacation rental profits.
Explore Advanced MetricsNew Bern Short-Term Rental Market Composition (2026): Property & Room Types
Room Type Distribution
Property Type Distribution
Market Composition Insights for New Bern
- The New Bern Airbnb market composition is heavily skewed towards Entire Home/Apt listings, which make up 78.7% of the 188 active rentals. This indicates strong guest preference for privacy and space.
- Looking at the property type distribution in New Bern, House properties are the most common (55.9%), reflecting the local real estate landscape.
- Houses represent a significant 55.9% portion, catering likely to families or larger groups.
- The presence of 19.1% Hotel/Boutique listings indicates integration with traditional hospitality.
- Smaller segments like outdoor/unique, unique stays, others (combined 3.1%) offer potential for unique stay experiences.
New Bern Airbnb Room Capacity Analysis (2026): Bedroom Distribution
Distribution of Listings by Number of Bedrooms
Room Capacity Insights for New Bern
- The dominant room capacity in New Bern is 3 bedrooms listings, making up 29.8% of the market. This suggests a strong demand for properties suitable for families or small groups.
- Together, 3 bedrooms and 1 bedroom properties represent 55.9% of the active Airbnb listings in New Bern, indicating a high concentration in these sizes.
- A significant 33.0% of listings offer 3+ bedrooms, catering to larger groups and families seeking more space in New Bern.
New Bern Vacation Rental Guest Capacity Trends (2026)
Distribution of Listings by Guest Capacity
Guest Capacity Insights for New Bern
- The most common guest capacity trend in New Bern vacation rentals is listings accommodating 4 guests (22.9%). This suggests the primary traveler segment is likely small families or groups.
- Properties designed for 4 guests and 2 guests dominate the New Bern STR market, accounting for 41.5% of listings.
- 31.4% of properties accommodate 6+ guests, serving the market segment for larger families or group travel in New Bern.
- On average, properties in New Bern are equipped to host 3.9 guests.
New Bern Airbnb Booking Patterns (2026): Available vs. Booked Days
Available Days Distribution
Booked Days Distribution
Booking Pattern Insights for New Bern
- The most common availability pattern in New Bern falls within the 271-366 days range, representing 38.3% of listings. This suggests many properties have significant open periods on their calendars.
- Approximately 73.4% of listings show high availability (181+ days open annually), indicating potential for increased bookings or specific owner usage patterns.
- For booked days, the 91-180 days range is most frequent in New Bern (36.2%), reflecting common guest stay durations or potential owner blocking patterns.
- A notable 27.7% of properties secure long booking periods (181+ days booked per year), highlighting successful long-term rental strategies or significant owner usage.
New Bern Airbnb Minimum Stay Requirements Analysis
Distribution of Listings by Minimum Night Requirement
1 Night
45 listings
23.9% of total
2 Nights
64 listings
34% of total
3 Nights
16 listings
8.5% of total
4-6 Nights
2 listings
1.1% of total
7-29 Nights
4 listings
2.1% of total
30+ Nights
57 listings
30.3% of total
Key Insights
- The most prevalent minimum stay requirement in New Bern is 2 Nights, adopted by 34% of listings. This highlights the market's preference for shorter, flexible bookings.
- A significant segment (30.3%) caters to monthly stays (30+ nights) in New Bern, pointing to opportunities in the extended-stay market.
Recommendations
- Align with the market by considering a 2 Nights minimum stay, as 34% of New Bern hosts use this setting.
- If feasible, allowing 1-night stays, especially midweek or during low season, could capture last-minute bookings, as only 23.9% currently do.
- Explore offering discounts for stays of 30+ nights to attract the 30.3% of the market seeking extended stays.
- Adjust minimum nights based on seasonality – potentially shorter during low season and longer during peak demand periods in New Bern.
New Bern Airbnb Cancellation Policy Trends Analysis (2026)
Super Strict 60 Days
7 listings
3.7% of total
Limited
6 listings
3.2% of total
Flexible
65 listings
34.6% of total
Moderate
44 listings
23.4% of total
Firm
35 listings
18.6% of total
Strict
31 listings
16.5% of total
Cancellation Policy Insights for New Bern
- The prevailing Airbnb cancellation policy trend in New Bern is Flexible, used by 34.6% of listings.
- There's a relatively balanced mix between guest-friendly (58.0%) and stricter (35.1%) policies, offering choices for different guest needs.
Recommendations for Hosts
- Consider adopting a Flexible policy to align with the 34.6% market standard in New Bern.
- Regularly review your cancellation policy against competitors and market demand shifts in New Bern.
New Bern STR Booking Lead Time Analysis (2026)
Average Booking Lead Time by Month
Booking Lead Time Insights for New Bern
- The overall average booking lead time for vacation rentals in New Bern is 46 days.
- Guests book furthest in advance for stays during October (average 70 days), likely coinciding with peak travel demand or local events.
- The shortest booking windows occur for stays in January (average 29 days), indicating more last-minute travel plans during this time.
- Seasonally, Fall (65 days avg.) sees the longest lead times, while Summer (35 days avg.) has the shortest, reflecting typical travel planning cycles.
Recommendations for Hosts
- Use the overall average lead time (46 days) as a baseline for your pricing and availability strategy in New Bern.
- For October stays, consider implementing length-of-stay discounts or slightly higher rates for bookings made less than 70 days out to capitalize on advance planning.
- Target marketing efforts for the Fall season well in advance (at least 65 days) to capture early planners.
- Monitor your own booking lead times against these New Bern averages to identify opportunities for dynamic pricing adjustments.
Popular & Essential Airbnb Amenities in New Bern (2026)
Amenity Prevalence
Amenity Insights for New Bern
- Essential amenities in New Bern that guests expect include: Air conditioning, Wifi, Smoke alarm. Lacking these (any) could significantly impact bookings.
- Popular amenities like TV, Heating, Free parking on premises are common but not universal. Offering these can provide a competitive edge.
Recommendations for Hosts
- Ensure your listing includes all essential amenities for New Bern: Air conditioning, Wifi, Smoke alarm.
- Prioritize adding missing essentials: Air conditioning, Wifi, Smoke alarm.
- Consider adding popular differentiators like TV or Heating to increase appeal.
- Highlight unique or less common amenities you offer (e.g., hot tub, dedicated workspace, EV charger) in your listing description and photos.
- Regularly check competitor amenities in New Bern to stay competitive.
New Bern Airbnb Guest Demographics & Profile Analysis (2026)
Guest Profile Summary for New Bern
- The typical guest profile for Airbnb in New Bern consists of primarily domestic travelers (97%), often arriving from nearby Raleigh, typically belonging to the Post-2000s (Gen Z/Alpha) group (50%), primarily speaking English or Spanish.
- Domestic travelers account for 97.3% of guests.
- Key international markets include United States (97.3%) and DC (1%).
- Top languages spoken are English (77.4%) followed by Spanish (10%).
- A significant demographic segment is the Post-2000s (Gen Z/Alpha) group, representing 50% of guests.
Recommendations for Hosts
- Target domestic marketing efforts towards travelers from Raleigh and New Bern.
- Tailor amenities and listing descriptions to appeal to the dominant Post-2000s (Gen Z/Alpha) demographic (e.g., highlight fast WiFi, smart home features, local guides).
- Highlight unique local experiences or amenities relevant to the primary guest profile.
- Consider seasonal promotions aligned with peak travel times for key origin markets.
Nearby Short-Term Rental Market Comparison
How does the New Bern Airbnb market stack up against its neighbors? Compare key performance metrics like average monthly revenue, ADR, and occupancy rates in surrounding areas to understand the broader regional STR landscape.
| Market | Active Properties | Monthly Revenue | Daily Rate | Avg. Occupancy |
|---|---|---|---|---|
| Wrightsville Beach | 497 | $4,620 | $531.11 | 39% |
| Littleton | 133 | $4,152 | $483.40 | 38% |
| Macon | 45 | $4,003 | $519.11 | 35% |
| Bracey | 51 | $3,814 | $470.46 | 35% |
| Cedar Point | 30 | $3,725 | $310.88 | 49% |
| Emerald Isle | 510 | $3,693 | $392.93 | 42% |
| Henrico | 78 | $3,576 | $472.35 | 38% |
| North Topsail Beach | 946 | $3,533 | $428.67 | 39% |
| Surf City | 737 | $3,518 | $389.38 | 39% |
| Indian Beach | 21 | $3,313 | $409.16 | 33% |