Murphy Airbnb Market Analysis 2026: Short Term Rental Data & Vacation Rental Statistics in North Carolina, United States
Is Airbnb profitable in Murphy in 2026? Explore comprehensive Airbnb analytics for Murphy, North Carolina, United States to uncover income potential. This 2026 STR market report for Murphy, based on AirROI data from February 2025 to January 2026, reveals key trends in the market of 371 active listings.
Whether you're considering an Airbnb investment in Murphy, optimizing your existing vacation rental, or exploring rental arbitrage opportunities, understanding the Murphy Airbnb data is crucial. Leveraging the low regulation environment is key to maximizing your short term rental income potential. Let's dive into the specifics.
Key Murphy Airbnb Performance Metrics Overview
Monthly Airbnb Revenue Variations & Income Potential in Murphy (2026)
Understanding the monthly revenue variations for Airbnb listings in Murphy is key to maximizing your short term rental income potential. Seasonality significantly impacts earnings. Our analysis, based on data from the past 12 months, shows that the peak revenue month for STRs in Murphy is typically October, while February often presents the lowest earnings, highlighting opportunities for strategic pricing adjustments during shoulder and low seasons. Explore the typical Airbnb income in Murphy across different performance tiers:
- Best-in-class properties (Top 10%) achieve $4,588+ monthly, often utilizing dynamic pricing and superior guest experiences.
- Strong performing properties (Top 25%) earn $3,189 or more, indicating effective management and desirable locations/amenities.
- Typical properties (Median) generate around $1,999 per month, representing the average market performance.
- Entry-level properties (Bottom 25%) see earnings around $1,148, often with potential for optimization.
Average Monthly Airbnb Earnings Trend in Murphy
Murphy Airbnb Occupancy Rate Trends (2026)
Maximize your bookings by understanding the Murphy STR occupancy trends. Seasonal demand shifts significantly influence how often properties are booked. Typically, Octobersees the highest demand (peak season occupancy), while January experiences the lowest (low season). Effective strategies, like adjusting minimum stays or offering promotions, can boost occupancy during slower periods. Here's how different property tiers perform in Murphy:
- Best-in-class properties (Top 10%) achieve 76%+ occupancy, indicating high desirability and potentially optimized availability.
- Strong performing properties (Top 25%) maintain 59% or higher occupancy, suggesting good market fit and guest satisfaction.
- Typical properties (Median) have an occupancy rate around 39%.
- Entry-level properties (Bottom 25%) average 21% occupancy, potentially facing higher vacancy.
Average Monthly Occupancy Rate Trend in Murphy
Average Daily Rate (ADR) Airbnb Trends in Murphy (2026)
Effective short term rental pricing strategy in Murphy involves understanding monthly ADR fluctuations. The Average Daily Rate (ADR) for Airbnb in Murphy typically peaks in December and dips lowest during February. Leveraging Airbnb dynamic pricing tools or strategies based on this seasonality can significantly boost revenue. Here's a look at the typical nightly rates achieved:
- Best-in-class properties (Top 10%) command rates of $286+ per night, often due to premium features or locations.
- Strong performing properties (Top 25%) achieve nightly rates of $219 or more.
- Typical properties (Median) charge around $170 per night.
- Entry-level properties (Bottom 25%) earn around $131 per night.
Average Daily Rate (ADR) Trend by Month in Murphy
Get Live Murphy Market Intelligence 👇

Explore Real-time Analytics
Airbnb Seasonality Analysis & Trends in Murphy (2026)
Peak Season (October, November, December)
- Revenue averages $3,349 per month
- Occupancy rates average 50.7%
- Daily rates average $212
Shoulder Season
- Revenue averages $2,321 per month
- Occupancy maintains around 40.4%
- Daily rates hold near $186
Low Season (February, April, May)
- Revenue drops to average $1,514 per month
- Occupancy decreases to average 33.2%
- Daily rates adjust to average $165
Seasonality Insights for Murphy
- The Airbnb seasonality in Murphy shows highly seasonal trends requiring careful strategy. While the sections above show seasonal averages, it's also insightful to look at the extremes:
- During the high season, the absolute peak month showcases Murphy's highest earning potential, with monthly revenues capable of climbing to $3,741, occupancy reaching a high of 56.9%, and ADRs peaking at $215.
- Conversely, the slowest single month of the year, typically falling within the low season, marks the market's lowest point. In this month, revenue might dip to $1,354, occupancy could drop to 28.9%, and ADRs may adjust down to $161.
- Understanding both the seasonal averages and these monthly peaks and troughs in revenue, occupancy, and ADR is crucial for maximizing your Airbnb profit potential in Murphy.
Seasonal Strategies for Maximizing Profit
- Peak Season: Maximize revenue through premium pricing and potentially longer minimum stays. Ensure high availability.
- Low Season: Offer competitive pricing, special promotions (e.g., extended stay discounts), and flexible cancellation policies. Target off-season travelers like remote workers or budget-conscious guests.
- Shoulder Seasons: Implement dynamic pricing that balances peak and low rates. Target weekend travelers or specific events. Offer slightly more flexible terms than peak season.
- Regularly analyze your own performance against these Murphy seasonality benchmarks and adjust your pricing and availability strategy accordingly.
Best Areas for Airbnb Investment in Murphy (2026)
Exploring the top neighborhoods for short-term rentals in Murphy? This section highlights key areas, outlining why they are attractive for hosts and guests, along with notable local attractions. Consider these locations based on your target guest profile and investment strategy.
| Neighborhood / Area | Why Host Here? (Target Guests & Appeal) | Key Attractions & Landmarks |
|---|---|---|
| Downtown Murphy | The heart of Murphy offers a charming small-town feel with local shops, restaurants, and cultural attractions. Ideal for visitors wanting to explore the local atmosphere and history. | Murphy River Walk, Murphy Art Center, Historic Courthouse, Cherokee County Historical Museum, local dining options |
| Lake Hiwassee | A stunning natural area perfect for water activities and outdoor adventures. Attracts nature lovers, anglers, and those looking to escape into the wilderness. | Hiwassee River, Lake Hiwassee Beach, Fishing spots, Kayaking and canoeing opportunities, Scenic hiking trails |
| Murphy Golf Club | Featuring beautiful greens and a relaxed atmosphere, this area is popular among golf enthusiasts and families looking to enjoy a leisurely stay. | Murphy Golf Club, Pro shop, Scenic views, Nearby picnic areas, Golf tournaments |
| John C. Campbell Folk School | A renowned school focused on traditional crafts and arts, drawing visitors interested in workshops and cultural experiences. | Craft workshops, Art exhibits, Live music events, Nature trails, Cultural events |
| Cherokee County | Surrounded by beautiful mountains and rich Native American history, this area attracts history buffs and outdoor lovers alike. | Blue Ridge Parkway, Historical sites, Hiking trails, Native American heritage sites, Scenic drives |
| Nantahala National Forest | A large forest area known for its breathtaking scenery and outdoor activities, such as hiking, rafting, and mountain biking. Ideal for adventurous travelers. | Nantahala River, Rafting and kayaking, Hiking trails, Scenic overlooks, Wildlife watching |
| Cultural Arts Center | A hub of arts and culture showcasing local talent and events. Great for guests interested in the local art scene and community activities. | Local art exhibits, Theater performances, Community events, Workshops, Art classes |
| Hiawassee Lake | A nearby lake offering picturesque views and recreational activities. Perfect for visitors looking for a relaxing getaway in nature. | Boating and fishing, Scenic picnic areas, Lakefront views, Wildlife spotting, Water sports |
Understanding Airbnb License Requirements & STR Laws in Murphy (2026)
While Murphy, North Carolina, United States currently shows low STR regulations, specific Airbnb license requirements might still exist or change. Always verify the latest short term rental regulations and Airbnb license requirements directly with local government authorities for Murphy to ensure full compliance before hosting.
(Source: AirROI data, 2026, based on 0% licensed listings)
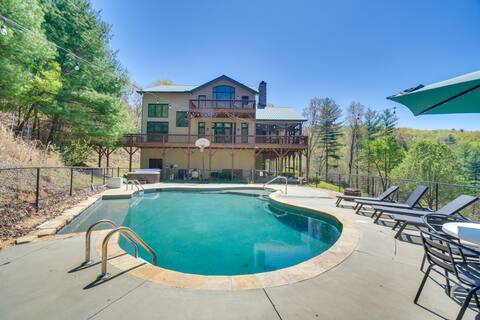
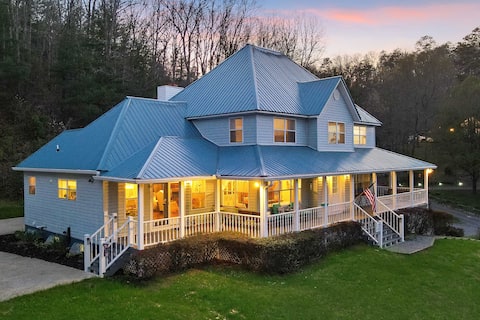
Top Performing Airbnb Properties in Murphy (2026)
Benchmark your potential! Explore examples of top-performing Airbnb properties in Murphybased on Trailing Twelve Month (TTM) revenue. Analyze their characteristics, revenue, occupancy rate, and ADR to understand what drives success in this market.
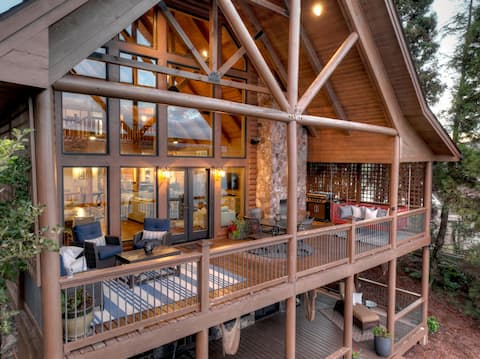
Amazing Sweetwater Lodge - custom lakefront home!
Entire Place • 5 bedrooms
Expansive Home on 16 Acres w/ Smoky Mountain Views
Entire Place • 5 bedrooms

Spectacular Mountain Views, Secluded, Luxury cabin
Entire Place • 3 bedrooms
Spacious Murphy Home w/ Game Room + Fire Pit!
Entire Place • 6 bedrooms

Tranquility Perch | Free Night Offer!
Entire Place • 4 bedrooms
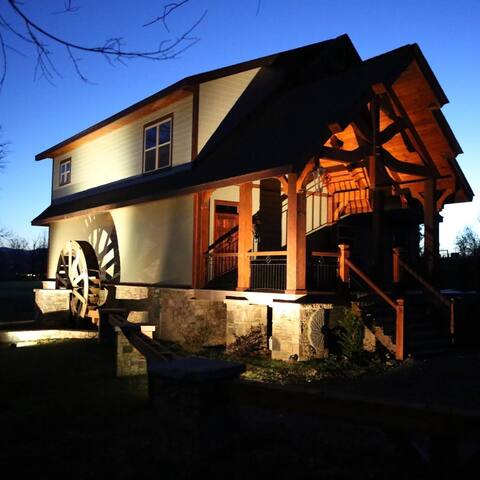
The Millhouse Lodge
Entire Place • 6 bedrooms
Note: Performance varies based on location, size, amenities, seasonality, and management quality. Data reflects the past 12 months.
Top Performing Airbnb Hosts in Murphy (2026)
Learn from the best! This table showcases top-performing Airbnb hosts in Murphy based on the number of properties managed and estimated total revenue over the past year. Analyze their scale and performance metrics.
| Host Name | Properties | Grossing Revenue | Stay Reviews | Avg Rating |
|---|---|---|---|---|
| Evolve | 53 | $1,122,457 | 1273 | 4.80/5.0 |
| Evolve | 6 | $189,431 | 545 | 4.91/5.0 |
| Great Mountain | 6 | $162,156 | 84 | 4.94/5.0 |
| Mountain Country Cabin Rentals | 17 | $122,675 | 429 | 4.70/5.0 |
| Zoe And Eric | 3 | $116,108 | 240 | 5.00/5.0 |
| Beats Working Vacations | 3 | $114,733 | 162 | 4.91/5.0 |
| Jo | 8 | $104,969 | 54 | 4.75/5.0 |
| Ryan | 2 | $104,057 | 300 | 4.97/5.0 |
| Wendi | 2 | $102,822 | 109 | 4.80/5.0 |
| Ashley | 1 | $92,505 | 6 | 4.50/5.0 |
Analyzing the strategies of top hosts, such as their property selection, pricing, and guest communication, can offer valuable lessons for optimizing your own Airbnb operations in Murphy.
Dive Deeper: Advanced Murphy STR Market Data (2026)
Ready to unlock more insights? AirROI provides access to advanced metrics and comprehensive Airbnb data for Murphy. Explore detailed analytics beyond this report to refine your investment strategy, optimize pricing, and maximize your vacation rental profits.
Explore Advanced MetricsMurphy Short-Term Rental Market Composition (2026): Property & Room Types
Room Type Distribution
Property Type Distribution
Market Composition Insights for Murphy
- The Murphy Airbnb market composition is heavily skewed towards Entire Home/Apt listings, which make up 99.7% of the 371 active rentals. This indicates strong guest preference for privacy and space.
- Looking at the property type distribution in Murphy, Outdoor/Unique properties are the most common (68.7%), reflecting the local real estate landscape.
- Houses represent a significant 24.5% portion, catering likely to families or larger groups.
- Smaller segments like apartment/condo, others, hotel/boutique, unique stays (combined 6.7%) offer potential for unique stay experiences.
Murphy Airbnb Room Capacity Analysis (2026): Bedroom Distribution
Distribution of Listings by Number of Bedrooms
Room Capacity Insights for Murphy
- The dominant room capacity in Murphy is 2 bedrooms listings, making up 45.6% of the market. This suggests a strong demand for properties suitable for couples or solo travelers.
- Together, 2 bedrooms and 3 bedrooms properties represent 71.2% of the active Airbnb listings in Murphy, indicating a high concentration in these sizes.
- A significant 35.3% of listings offer 3+ bedrooms, catering to larger groups and families seeking more space in Murphy.
Murphy Vacation Rental Guest Capacity Trends (2026)
Distribution of Listings by Guest Capacity
Guest Capacity Insights for Murphy
- The most common guest capacity trend in Murphy vacation rentals is listings accommodating 4 guests (28.3%). This suggests the primary traveler segment is likely small families or groups.
- Properties designed for 4 guests and 8+ guests dominate the Murphy STR market, accounting for 56.6% of listings.
- 55.3% of properties accommodate 6+ guests, serving the market segment for larger families or group travel in Murphy.
- On average, properties in Murphy are equipped to host 5.6 guests.
Murphy Airbnb Booking Patterns (2026): Available vs. Booked Days
Available Days Distribution
Booked Days Distribution
Booking Pattern Insights for Murphy
- The most common availability pattern in Murphy falls within the 271-366 days range, representing 44.7% of listings. This suggests many properties have significant open periods on their calendars.
- Approximately 78.7% of listings show high availability (181+ days open annually), indicating potential for increased bookings or specific owner usage patterns.
- For booked days, the 91-180 days range is most frequent in Murphy (34.8%), reflecting common guest stay durations or potential owner blocking patterns.
- A notable 21.6% of properties secure long booking periods (181+ days booked per year), highlighting successful long-term rental strategies or significant owner usage.
Murphy Airbnb Minimum Stay Requirements Analysis
Distribution of Listings by Minimum Night Requirement
1 Night
43 listings
11.6% of total
2 Nights
177 listings
47.7% of total
3 Nights
42 listings
11.3% of total
4-6 Nights
7 listings
1.9% of total
7-29 Nights
1 listings
0.3% of total
30+ Nights
101 listings
27.2% of total
Key Insights
- The most prevalent minimum stay requirement in Murphy is 2 Nights, adopted by 47.7% of listings. This highlights the market's preference for shorter, flexible bookings.
- A significant segment (27.2%) caters to monthly stays (30+ nights) in Murphy, pointing to opportunities in the extended-stay market.
Recommendations
- Align with the market by considering a 2 Nights minimum stay, as 47.7% of Murphy hosts use this setting.
- If feasible, allowing 1-night stays, especially midweek or during low season, could capture last-minute bookings, as only 11.6% currently do.
- A 2-night minimum appears standard (47.7%). Consider this for weekends or peak periods.
- Explore offering discounts for stays of 30+ nights to attract the 27.2% of the market seeking extended stays.
- Adjust minimum nights based on seasonality – potentially shorter during low season and longer during peak demand periods in Murphy.
Murphy Airbnb Cancellation Policy Trends Analysis (2026)
Super Strict 60 Days
1 listings
0.3% of total
Limited
6 listings
1.6% of total
Super Strict 30 Days
26 listings
7% of total
Flexible
61 listings
16.5% of total
Moderate
90 listings
24.3% of total
Firm
112 listings
30.3% of total
Strict
74 listings
20% of total
Cancellation Policy Insights for Murphy
- The prevailing Airbnb cancellation policy trend in Murphy is Firm, used by 30.3% of listings.
- A majority (50.3%) of hosts in Murphy utilize Firm or Strict policies, indicating a market where hosts prioritize booking security.
Recommendations for Hosts
- Consider adopting a Firm policy to align with the 30.3% market standard in Murphy.
- Regularly review your cancellation policy against competitors and market demand shifts in Murphy.
Murphy STR Booking Lead Time Analysis (2026)
Average Booking Lead Time by Month
Booking Lead Time Insights for Murphy
- The overall average booking lead time for vacation rentals in Murphy is 44 days.
- Guests book furthest in advance for stays during November (average 61 days), likely coinciding with peak travel demand or local events.
- The shortest booking windows occur for stays in February (average 26 days), indicating more last-minute travel plans during this time.
- Seasonally, Fall (55 days avg.) sees the longest lead times, while Winter (38 days avg.) has the shortest, reflecting typical travel planning cycles.
Recommendations for Hosts
- Use the overall average lead time (44 days) as a baseline for your pricing and availability strategy in Murphy.
- For November stays, consider implementing length-of-stay discounts or slightly higher rates for bookings made less than 61 days out to capitalize on advance planning.
- Target marketing efforts for the Fall season well in advance (at least 55 days) to capture early planners.
- Monitor your own booking lead times against these Murphy averages to identify opportunities for dynamic pricing adjustments.
Popular & Essential Airbnb Amenities in Murphy (2026)
Amenity Prevalence
Amenity Insights for Murphy
- Essential amenities in Murphy that guests expect include: Wifi, Air conditioning, Hot water, TV, Smoke alarm, Heating, Kitchen. Lacking these (any) could significantly impact bookings.
- Popular amenities like Coffee maker, Dishes and silverware, Free parking on premises are common but not universal. Offering these can provide a competitive edge.
Recommendations for Hosts
- Ensure your listing includes all essential amenities for Murphy: Wifi, Air conditioning, Hot water, TV, Smoke alarm, Heating, Kitchen.
- Prioritize adding missing essentials: Wifi, Air conditioning, Hot water, TV, Smoke alarm, Heating, Kitchen.
- Consider adding popular differentiators like Coffee maker or Dishes and silverware to increase appeal.
- Highlight unique or less common amenities you offer (e.g., hot tub, dedicated workspace, EV charger) in your listing description and photos.
- Regularly check competitor amenities in Murphy to stay competitive.
Murphy Airbnb Guest Demographics & Profile Analysis (2026)
Guest Profile Summary for Murphy
- The typical guest profile for Airbnb in Murphy consists of primarily domestic travelers (99%), often arriving from nearby Atlanta, typically belonging to the Post-2000s (Gen Z/Alpha) group (50%), primarily speaking English or Spanish.
- Domestic travelers account for 98.6% of guests.
- Key international markets include United States (98.6%) and United Kingdom (0.3%).
- Top languages spoken are English (79.9%) followed by Spanish (11.7%).
- A significant demographic segment is the Post-2000s (Gen Z/Alpha) group, representing 50% of guests.
Recommendations for Hosts
- Target domestic marketing efforts towards travelers from Atlanta and Tampa.
- Tailor amenities and listing descriptions to appeal to the dominant Post-2000s (Gen Z/Alpha) demographic (e.g., highlight fast WiFi, smart home features, local guides).
- Highlight unique local experiences or amenities relevant to the primary guest profile.
- Consider seasonal promotions aligned with peak travel times for key origin markets.
Nearby Short-Term Rental Market Comparison
How does the Murphy Airbnb market stack up against its neighbors? Compare key performance metrics like average monthly revenue, ADR, and occupancy rates in surrounding areas to understand the broader regional STR landscape.
| Market | Active Properties | Monthly Revenue | Daily Rate | Avg. Occupancy |
|---|---|---|---|---|
| Sevier County | 68 | $7,108 | $567.95 | 44% |
| Gilmer County | 26 | $5,298 | $459.59 | 40% |
| Sevierville | 6,269 | $4,747 | $370.20 | 46% |
| Fannin County | 42 | $4,574 | $435.93 | 38% |
| East Ellijay | 15 | $4,415 | $368.05 | 41% |
| Epworth | 79 | $4,411 | $406.97 | 40% |
| Gatlinburg | 3,565 | $4,385 | $353.70 | 45% |
| Commerce | 19 | $4,298 | $285.34 | 45% |
| Pigeon Forge | 2,938 | $4,158 | $337.10 | 45% |
| Sautee | 14 | $4,105 | $408.17 | 39% |