Morehead City Airbnb Market Analysis 2026: Short Term Rental Data & Vacation Rental Statistics in North Carolina, United States
Is Airbnb profitable in Morehead City in 2026? Explore comprehensive Airbnb analytics for Morehead City, North Carolina, United States to uncover income potential. This 2026 STR market report for Morehead City, based on AirROI data from February 2025 to January 2026, reveals key trends in the niche market of 160 active listings.
Whether you're considering an Airbnb investment in Morehead City, optimizing your existing vacation rental, or exploring rental arbitrage opportunities, understanding the Morehead City Airbnb data is crucial. Leveraging the low regulation environment is key to maximizing your short term rental income potential. Let's dive into the specifics.
Key Morehead City Airbnb Performance Metrics Overview
Monthly Airbnb Revenue Variations & Income Potential in Morehead City (2026)
Understanding the monthly revenue variations for Airbnb listings in Morehead City is key to maximizing your short term rental income potential. Seasonality significantly impacts earnings. Our analysis, based on data from the past 12 months, shows that the peak revenue month for STRs in Morehead City is typically July, while February often presents the lowest earnings, highlighting opportunities for strategic pricing adjustments during shoulder and low seasons. Explore the typical Airbnb income in Morehead City across different performance tiers:
- Best-in-class properties (Top 10%) achieve $5,379+ monthly, often utilizing dynamic pricing and superior guest experiences.
- Strong performing properties (Top 25%) earn $3,727 or more, indicating effective management and desirable locations/amenities.
- Typical properties (Median) generate around $2,279 per month, representing the average market performance.
- Entry-level properties (Bottom 25%) see earnings around $1,198, often with potential for optimization.
Average Monthly Airbnb Earnings Trend in Morehead City
Morehead City Airbnb Occupancy Rate Trends (2026)
Maximize your bookings by understanding the Morehead City STR occupancy trends. Seasonal demand shifts significantly influence how often properties are booked. Typically, Julysees the highest demand (peak season occupancy), while January experiences the lowest (low season). Effective strategies, like adjusting minimum stays or offering promotions, can boost occupancy during slower periods. Here's how different property tiers perform in Morehead City:
- Best-in-class properties (Top 10%) achieve 76%+ occupancy, indicating high desirability and potentially optimized availability.
- Strong performing properties (Top 25%) maintain 56% or higher occupancy, suggesting good market fit and guest satisfaction.
- Typical properties (Median) have an occupancy rate around 36%.
- Entry-level properties (Bottom 25%) average 19% occupancy, potentially facing higher vacancy.
Average Monthly Occupancy Rate Trend in Morehead City
Average Daily Rate (ADR) Airbnb Trends in Morehead City (2026)
Effective short term rental pricing strategy in Morehead City involves understanding monthly ADR fluctuations. The Average Daily Rate (ADR) for Airbnb in Morehead City typically peaks in June and dips lowest during February. Leveraging Airbnb dynamic pricing tools or strategies based on this seasonality can significantly boost revenue. Here's a look at the typical nightly rates achieved:
- Best-in-class properties (Top 10%) command rates of $364+ per night, often due to premium features or locations.
- Strong performing properties (Top 25%) achieve nightly rates of $275 or more.
- Typical properties (Median) charge around $204 per night.
- Entry-level properties (Bottom 25%) earn around $149 per night.
Average Daily Rate (ADR) Trend by Month in Morehead City
Get Live Morehead City Market Intelligence 👇

Explore Real-time Analytics
Airbnb Seasonality Analysis & Trends in Morehead City (2026)
Peak Season (July, June, August)
- Revenue averages $4,618 per month
- Occupancy rates average 53.6%
- Daily rates average $254
Shoulder Season
- Revenue averages $2,422 per month
- Occupancy maintains around 36.7%
- Daily rates hold near $232
Low Season (January, February, March)
- Revenue drops to average $1,681 per month
- Occupancy decreases to average 29.2%
- Daily rates adjust to average $211
Seasonality Insights for Morehead City
- The Airbnb seasonality in Morehead City shows highly seasonal trends requiring careful strategy. While the sections above show seasonal averages, it's also insightful to look at the extremes:
- During the high season, the absolute peak month showcases Morehead City's highest earning potential, with monthly revenues capable of climbing to $5,197, occupancy reaching a high of 57.5%, and ADRs peaking at $261.
- Conversely, the slowest single month of the year, typically falling within the low season, marks the market's lowest point. In this month, revenue might dip to $1,386, occupancy could drop to 25.8%, and ADRs may adjust down to $196.
- Understanding both the seasonal averages and these monthly peaks and troughs in revenue, occupancy, and ADR is crucial for maximizing your Airbnb profit potential in Morehead City.
Seasonal Strategies for Maximizing Profit
- Peak Season: Maximize revenue through premium pricing and potentially longer minimum stays. Ensure high availability.
- Low Season: Offer competitive pricing, special promotions (e.g., extended stay discounts), and flexible cancellation policies. Target off-season travelers like remote workers or budget-conscious guests.
- Shoulder Seasons: Implement dynamic pricing that balances peak and low rates. Target weekend travelers or specific events. Offer slightly more flexible terms than peak season.
- Regularly analyze your own performance against these Morehead City seasonality benchmarks and adjust your pricing and availability strategy accordingly.
Best Areas for Airbnb Investment in Morehead City (2026)
Exploring the top neighborhoods for short-term rentals in Morehead City? This section highlights key areas, outlining why they are attractive for hosts and guests, along with notable local attractions. Consider these locations based on your target guest profile and investment strategy.
| Neighborhood / Area | Why Host Here? (Target Guests & Appeal) | Key Attractions & Landmarks |
|---|---|---|
| Bogue Banks | A barrier island renowned for its beautiful beaches and family-friendly atmosphere. Attracts beachgoers and water sports enthusiasts looking for a relaxing getaway. | Atlantic Beach, Emerald Isle, Bogue Inlet Fishing Pier, Water sports activities, Coastal Carolina Aquarium |
| Historic Downtown Morehead City | Charming downtown area with unique shops, restaurants, and waterfront views. Popular among tourists for its historic character and local dining options. | Morehead City Waterfront, Local restaurants, Marinas, Historic buildings, Arts and crafts shops |
| Beaufort | A nearby historic town known for its preserved 18th-century architecture and vibrant waterfront. It's a hit with history buffs and those looking for a quaint coastal experience. | Beaufort Historic Site, North Carolina Maritime Museum, Taylor's Creek, Shackleford Banks, Lovely shops and galleries |
| Carteret County | Diverse attractions ranging from parks to beaches make this county a great investment for various types of visitors, including nature lovers and adventure seekers. | Fort Macon State Park, Cape Lookout National Seashore, Shackleford Banks, Scuba diving and snorkeling spots, Hiking trails |
| Shackleford Banks | Uninhabited island known for its wild horses and pristine natural beauty. Attracts nature lovers and those seeking solitude and adventure. | Wild horses, Unspoiled beaches, Nature trails, Birdwatching, Camping opportunities |
| Emerald Isle | A popular beach destination known for its family-friendly atmosphere and recreational activities. Ideal for vacation rentals catering to families and groups. | Emerald Isle Beach, Water sports, Fishing spots, Parks and playgrounds, Nature reserves |
| Pine Knoll Shores | A smaller, quieter beach community perfect for those looking to escape the crowds. Great for visitors wanting a peaceful beach experience. | Pine Knoll Shores Aquarium, Beaches, Nature trails, Kayaking spots, Nearby golf courses |
| Atlantic Beach | Offers a more lively beach atmosphere with various events and activities throughout the year. Ideal for vacationers looking for leisure and recreation. | Atlantic Beach Boardwalk, Beachfront restaurants, Annual events and festivals, Water activities, Nearby nightlife options |
Understanding Airbnb License Requirements & STR Laws in Morehead City (2026)
While Morehead City, North Carolina, United States currently shows low STR regulations, specific Airbnb license requirements might still exist or change. Always verify the latest short term rental regulations and Airbnb license requirements directly with local government authorities for Morehead City to ensure full compliance before hosting.
(Source: AirROI data, 2026, based on 1% licensed listings)
Top Performing Airbnb Properties in Morehead City (2026)
Benchmark your potential! Explore examples of top-performing Airbnb properties in Morehead Citybased on Trailing Twelve Month (TTM) revenue. Analyze their characteristics, revenue, occupancy rate, and ADR to understand what drives success in this market.
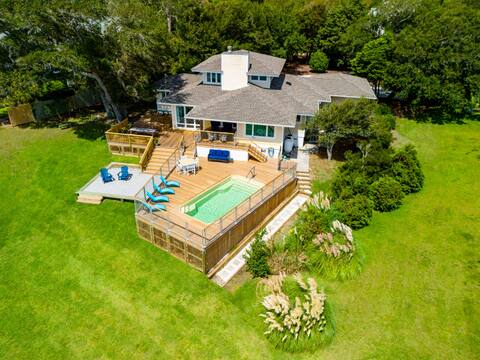
Waterfront w/ Heated Pool, Private Pier & Kayaks
Entire Place • 4 bedrooms
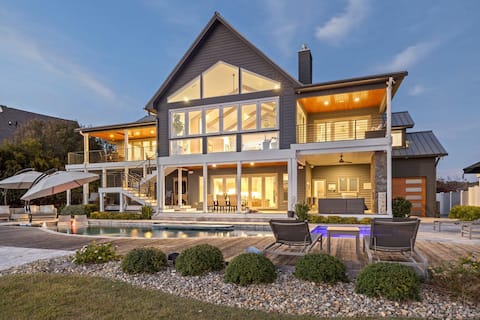
Villa Trevino - Luxury Accommodations With Deep Wa
Entire Place • 4 bedrooms
Beautiful 5 Bedroom Home-Cardinal Seas
Entire Place • 5 bedrooms
Book now 25% off 7-night's June, July, and August!
Entire Place • 3 bedrooms
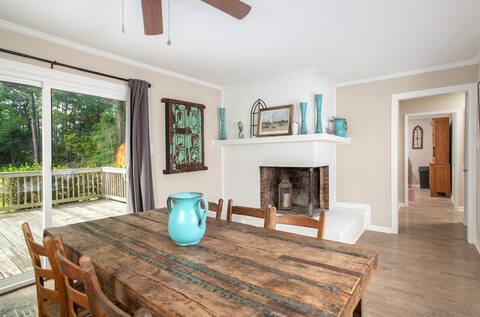
Lovely Morehead City Home w/ Fire Pit & Gas Grill
Entire Place • 3 bedrooms
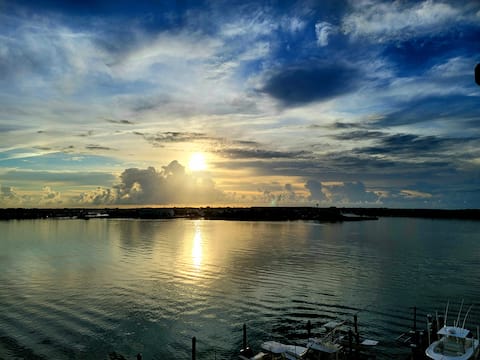
Seaside Serenity
Entire Place • 4 bedrooms
Note: Performance varies based on location, size, amenities, seasonality, and management quality. Data reflects the past 12 months.
Top Performing Airbnb Hosts in Morehead City (2026)
Learn from the best! This table showcases top-performing Airbnb hosts in Morehead City based on the number of properties managed and estimated total revenue over the past year. Analyze their scale and performance metrics.
| Host Name | Properties | Grossing Revenue | Stay Reviews | Avg Rating |
|---|---|---|---|---|
| Garet | 2 | $204,536 | 112 | 4.94/5.0 |
| Daniel | 6 | $194,825 | 261 | 4.79/5.0 |
| Nola | 6 | $148,172 | 513 | 4.84/5.0 |
| Tracy | 1 | $134,663 | 2 | Not Rated |
| Claudia | 3 | $123,346 | 19 | 4.21/5.0 |
| Haylee | 3 | $122,336 | 86 | 4.95/5.0 |
| Evolve | 3 | $114,564 | 84 | 4.68/5.0 |
| Stacie | 3 | $107,644 | 296 | 4.93/5.0 |
| Crystal | 3 | $99,362 | 219 | 4.89/5.0 |
| Mindy | 4 | $90,197 | 112 | 4.97/5.0 |
Analyzing the strategies of top hosts, such as their property selection, pricing, and guest communication, can offer valuable lessons for optimizing your own Airbnb operations in Morehead City.
Dive Deeper: Advanced Morehead City STR Market Data (2026)
Ready to unlock more insights? AirROI provides access to advanced metrics and comprehensive Airbnb data for Morehead City. Explore detailed analytics beyond this report to refine your investment strategy, optimize pricing, and maximize your vacation rental profits.
Explore Advanced MetricsMorehead City Short-Term Rental Market Composition (2026): Property & Room Types
Room Type Distribution
Property Type Distribution
Market Composition Insights for Morehead City
- The Morehead City Airbnb market composition is heavily skewed towards Entire Home/Apt listings, which make up 93.8% of the 160 active rentals. This indicates strong guest preference for privacy and space.
- Looking at the property type distribution in Morehead City, House properties are the most common (75.6%), reflecting the local real estate landscape.
- Houses represent a significant 75.6% portion, catering likely to families or larger groups.
- Smaller segments like outdoor/unique, others, hotel/boutique, unique stays (combined 8.7%) offer potential for unique stay experiences.
Morehead City Airbnb Room Capacity Analysis (2026): Bedroom Distribution
Distribution of Listings by Number of Bedrooms
Room Capacity Insights for Morehead City
- The dominant room capacity in Morehead City is 3 bedrooms listings, making up 37.5% of the market. This suggests a strong demand for properties suitable for families or small groups.
- Together, 3 bedrooms and 2 bedrooms properties represent 64.4% of the active Airbnb listings in Morehead City, indicating a high concentration in these sizes.
- A significant 50.7% of listings offer 3+ bedrooms, catering to larger groups and families seeking more space in Morehead City.
Morehead City Vacation Rental Guest Capacity Trends (2026)
Distribution of Listings by Guest Capacity
Guest Capacity Insights for Morehead City
- The most common guest capacity trend in Morehead City vacation rentals is listings accommodating 6 guests (28.7%). This suggests the primary traveler segment is likely larger groups.
- Properties designed for 6 guests and 8+ guests dominate the Morehead City STR market, accounting for 50.0% of listings.
- 55.0% of properties accommodate 6+ guests, serving the market segment for larger families or group travel in Morehead City.
- On average, properties in Morehead City are equipped to host 5.3 guests.
Morehead City Airbnb Booking Patterns (2026): Available vs. Booked Days
Available Days Distribution
Booked Days Distribution
Booking Pattern Insights for Morehead City
- The most common availability pattern in Morehead City falls within the 271-366 days range, representing 51.9% of listings. This suggests many properties have significant open periods on their calendars.
- Approximately 85.7% of listings show high availability (181+ days open annually), indicating potential for increased bookings or specific owner usage patterns.
- For booked days, the 31-90 days range is most frequent in Morehead City (34.4%), reflecting common guest stay durations or potential owner blocking patterns.
- A notable 15.6% of properties secure long booking periods (181+ days booked per year), highlighting successful long-term rental strategies or significant owner usage.
Morehead City Airbnb Minimum Stay Requirements Analysis
Distribution of Listings by Minimum Night Requirement
1 Night
32 listings
20% of total
2 Nights
44 listings
27.5% of total
3 Nights
17 listings
10.6% of total
4-6 Nights
7 listings
4.4% of total
7-29 Nights
2 listings
1.3% of total
30+ Nights
58 listings
36.3% of total
Key Insights
- The most prevalent minimum stay requirement in Morehead City is 30+ Nights, adopted by 36.3% of listings. This highlights the market's preference for longer commitments.
- A significant segment (36.3%) caters to monthly stays (30+ nights) in Morehead City, pointing to opportunities in the extended-stay market.
Recommendations
- Align with the market by considering a 30+ Nights minimum stay, as 36.3% of Morehead City hosts use this setting.
- If feasible, allowing 1-night stays, especially midweek or during low season, could capture last-minute bookings, as only 20% currently do.
- Explore offering discounts for stays of 30+ nights to attract the 36.3% of the market seeking extended stays.
- Adjust minimum nights based on seasonality – potentially shorter during low season and longer during peak demand periods in Morehead City.
Morehead City Airbnb Cancellation Policy Trends Analysis (2026)
Limited
3 listings
1.9% of total
Super Strict 30 Days
1 listings
0.6% of total
Flexible
21 listings
13.1% of total
Moderate
46 listings
28.7% of total
Firm
74 listings
46.3% of total
Strict
15 listings
9.4% of total
Cancellation Policy Insights for Morehead City
- The prevailing Airbnb cancellation policy trend in Morehead City is Firm, used by 46.3% of listings.
- A majority (55.7%) of hosts in Morehead City utilize Firm or Strict policies, indicating a market where hosts prioritize booking security.
- Strict cancellation policies are quite rare (9.4%), potentially making listings with this policy less competitive unless justified by high demand or property type.
Recommendations for Hosts
- Consider adopting a Firm policy to align with the 46.3% market standard in Morehead City.
- Using a Strict policy might deter some guests, as only 9.4% of listings use it. Evaluate if potential revenue protection outweighs possible lower booking rates.
- Regularly review your cancellation policy against competitors and market demand shifts in Morehead City.
Morehead City STR Booking Lead Time Analysis (2026)
Average Booking Lead Time by Month
Booking Lead Time Insights for Morehead City
- The overall average booking lead time for vacation rentals in Morehead City is 42 days.
- Guests book furthest in advance for stays during June (average 72 days), likely coinciding with peak travel demand or local events.
- The shortest booking windows occur for stays in February (average 20 days), indicating more last-minute travel plans during this time.
- Seasonally, Summer (51 days avg.) sees the longest lead times, while Winter (27 days avg.) has the shortest, reflecting typical travel planning cycles.
Recommendations for Hosts
- Use the overall average lead time (42 days) as a baseline for your pricing and availability strategy in Morehead City.
- For June stays, consider implementing length-of-stay discounts or slightly higher rates for bookings made less than 72 days out to capitalize on advance planning.
- Target marketing efforts for the Summer season well in advance (at least 51 days) to capture early planners.
- Monitor your own booking lead times against these Morehead City averages to identify opportunities for dynamic pricing adjustments.
Popular & Essential Airbnb Amenities in Morehead City (2026)
Amenity Prevalence
Amenity Insights for Morehead City
- Essential amenities in Morehead City that guests expect include: Wifi, Air conditioning, TV, Smoke alarm, Free parking on premises. Lacking these (any) could significantly impact bookings.
- Popular amenities like Coffee maker, Dishes and silverware, Heating are common but not universal. Offering these can provide a competitive edge.
Recommendations for Hosts
- Ensure your listing includes all essential amenities for Morehead City: Wifi, Air conditioning, TV, Smoke alarm, Free parking on premises.
- Prioritize adding missing essentials: Air conditioning, TV, Smoke alarm, Free parking on premises.
- Consider adding popular differentiators like Coffee maker or Dishes and silverware to increase appeal.
- Highlight unique or less common amenities you offer (e.g., hot tub, dedicated workspace, EV charger) in your listing description and photos.
- Regularly check competitor amenities in Morehead City to stay competitive.
Morehead City Airbnb Guest Demographics & Profile Analysis (2026)
Guest Profile Summary for Morehead City
- The typical guest profile for Airbnb in Morehead City consists of primarily domestic travelers (98%), often arriving from nearby Raleigh, typically belonging to the Post-2000s (Gen Z/Alpha) group (50%), primarily speaking English or Spanish.
- Domestic travelers account for 98.1% of guests.
- Key international markets include United States (98.1%) and United Kingdom (0.3%).
- Top languages spoken are English (79.5%) followed by Spanish (12.5%).
- A significant demographic segment is the Post-2000s (Gen Z/Alpha) group, representing 50% of guests.
Recommendations for Hosts
- Target domestic marketing efforts towards travelers from Raleigh and Durham.
- Tailor amenities and listing descriptions to appeal to the dominant Post-2000s (Gen Z/Alpha) demographic (e.g., highlight fast WiFi, smart home features, local guides).
- Highlight unique local experiences or amenities relevant to the primary guest profile.
- Consider seasonal promotions aligned with peak travel times for key origin markets.
Nearby Short-Term Rental Market Comparison
How does the Morehead City Airbnb market stack up against its neighbors? Compare key performance metrics like average monthly revenue, ADR, and occupancy rates in surrounding areas to understand the broader regional STR landscape.
| Market | Active Properties | Monthly Revenue | Daily Rate | Avg. Occupancy |
|---|---|---|---|---|
| Wrightsville Beach | 497 | $4,620 | $531.11 | 39% |
| Salvo | 86 | $4,421 | $483.32 | 41% |
| Nags Head | 835 | $4,193 | $436.54 | 42% |
| Bald Head Island | 207 | $4,127 | $601.50 | 33% |
| Rodanthe | 150 | $4,053 | $422.32 | 39% |
| Kure Beach | 502 | $3,804 | $427.64 | 42% |
| Cedar Point | 30 | $3,725 | $310.88 | 49% |
| Emerald Isle | 510 | $3,693 | $392.93 | 42% |
| North Topsail Beach | 946 | $3,533 | $428.67 | 39% |
| Surf City | 737 | $3,518 | $389.38 | 39% |