Matthews Airbnb Market Analysis 2026: Short Term Rental Data & Vacation Rental Statistics in North Carolina, United States
Is Airbnb profitable in Matthews in 2026? Explore comprehensive Airbnb analytics for Matthews, North Carolina, United States to uncover income potential. This 2026 STR market report for Matthews, based on AirROI data from February 2025 to January 2026, reveals key trends in the niche market of 50 active listings.
Whether you're considering an Airbnb investment in Matthews, optimizing your existing vacation rental, or exploring rental arbitrage opportunities, understanding the Matthews Airbnb data is crucial. Leveraging the low regulation environment is key to maximizing your short term rental income potential. Let's dive into the specifics.
Key Matthews Airbnb Performance Metrics Overview
Monthly Airbnb Revenue Variations & Income Potential in Matthews (2026)
Understanding the monthly revenue variations for Airbnb listings in Matthews is key to maximizing your short term rental income potential. Seasonality significantly impacts earnings. Our analysis, based on data from the past 12 months, shows that the peak revenue month for STRs in Matthews is typically October, while February often presents the lowest earnings, highlighting opportunities for strategic pricing adjustments during shoulder and low seasons. Explore the typical Airbnb income in Matthews across different performance tiers:
- Best-in-class properties (Top 10%) achieve $5,798+ monthly, often utilizing dynamic pricing and superior guest experiences.
- Strong performing properties (Top 25%) earn $4,066 or more, indicating effective management and desirable locations/amenities.
- Typical properties (Median) generate around $2,618 per month, representing the average market performance.
- Entry-level properties (Bottom 25%) see earnings around $1,274, often with potential for optimization.
Average Monthly Airbnb Earnings Trend in Matthews
Matthews Airbnb Occupancy Rate Trends (2026)
Maximize your bookings by understanding the Matthews STR occupancy trends. Seasonal demand shifts significantly influence how often properties are booked. Typically, Marchsees the highest demand (peak season occupancy), while January experiences the lowest (low season). Effective strategies, like adjusting minimum stays or offering promotions, can boost occupancy during slower periods. Here's how different property tiers perform in Matthews:
- Best-in-class properties (Top 10%) achieve 85%+ occupancy, indicating high desirability and potentially optimized availability.
- Strong performing properties (Top 25%) maintain 69% or higher occupancy, suggesting good market fit and guest satisfaction.
- Typical properties (Median) have an occupancy rate around 48%.
- Entry-level properties (Bottom 25%) average 27% occupancy, potentially facing higher vacancy.
Average Monthly Occupancy Rate Trend in Matthews
Average Daily Rate (ADR) Airbnb Trends in Matthews (2026)
Effective short term rental pricing strategy in Matthews involves understanding monthly ADR fluctuations. The Average Daily Rate (ADR) for Airbnb in Matthews typically peaks in December and dips lowest during February. Leveraging Airbnb dynamic pricing tools or strategies based on this seasonality can significantly boost revenue. Here's a look at the typical nightly rates achieved:
- Best-in-class properties (Top 10%) command rates of $348+ per night, often due to premium features or locations.
- Strong performing properties (Top 25%) achieve nightly rates of $248 or more.
- Typical properties (Median) charge around $177 per night.
- Entry-level properties (Bottom 25%) earn around $108 per night.
Average Daily Rate (ADR) Trend by Month in Matthews
Get Live Matthews Market Intelligence 👇

Explore Real-time Analytics
Airbnb Seasonality Analysis & Trends in Matthews (2026)
Peak Season (October, December, November)
- Revenue averages $3,511 per month
- Occupancy rates average 50.1%
- Daily rates average $207
Shoulder Season
- Revenue averages $3,055 per month
- Occupancy maintains around 51.6%
- Daily rates hold near $193
Low Season (January, February, September)
- Revenue drops to average $2,224 per month
- Occupancy decreases to average 38.4%
- Daily rates adjust to average $191
Seasonality Insights for Matthews
- The Airbnb seasonality in Matthews shows moderate seasonality with distinct peak and low periods. While the sections above show seasonal averages, it's also insightful to look at the extremes:
- During the high season, the absolute peak month showcases Matthews's highest earning potential, with monthly revenues capable of climbing to $3,707, occupancy reaching a high of 54.3%, and ADRs peaking at $210.
- Conversely, the slowest single month of the year, typically falling within the low season, marks the market's lowest point. In this month, revenue might dip to $1,971, occupancy could drop to 34.2%, and ADRs may adjust down to $178.
- Understanding both the seasonal averages and these monthly peaks and troughs in revenue, occupancy, and ADR is crucial for maximizing your Airbnb profit potential in Matthews.
Seasonal Strategies for Maximizing Profit
- Peak Season: Maximize revenue through premium pricing and potentially longer minimum stays. Ensure high availability.
- Low Season: Offer competitive pricing, special promotions (e.g., extended stay discounts), and flexible cancellation policies. Target off-season travelers like remote workers or budget-conscious guests.
- Shoulder Seasons: Implement dynamic pricing that balances peak and low rates. Target weekend travelers or specific events. Offer slightly more flexible terms than peak season.
- Regularly analyze your own performance against these Matthews seasonality benchmarks and adjust your pricing and availability strategy accordingly.
Best Areas for Airbnb Investment in Matthews (2026)
Exploring the top neighborhoods for short-term rentals in Matthews? This section highlights key areas, outlining why they are attractive for hosts and guests, along with notable local attractions. Consider these locations based on your target guest profile and investment strategy.
| Neighborhood / Area | Why Host Here? (Target Guests & Appeal) | Key Attractions & Landmarks |
|---|---|---|
| Downtown Matthews | The heart of Matthews, featuring charming shops, restaurants, and a vibrant community atmosphere. It attracts visitors for its quaint downtown feel and easy access to local amenities. | Matthews Community Center, Matthews Historical Museum, Local restaurants and cafes, Matthews Farmers Market, Greenway trails |
| Industry Hills | A suburban area that has seen rapid growth and development, making it attractive for families and longer-term stays. It's close to commercial hubs and recreational facilities. | Matthews Sportsplex, Parks, Shopping centers, Bus service to Uptown Charlotte |
| Wesley Chapel | Just outside Matthews, this area is popular for its family-friendly environment and abundant green spaces. Appeals to visitors looking for a quiet stay that's still close to urban amenities. | Wesley Chapel Park, Reedy Creek Nature Center, Shopping areas, Local restaurants |
| Sardis Forest | A comfortable and safe neighborhood known for its spacious homes and access to good schools, appealing to families and longer-term stays. | Sardis Forest Park, Nearby golf courses, Shopping centers, Family-friendly community events |
| Mint Hill | Nearby Mint Hill is gaining popularity due to its suburban feel and community spirit, with a variety of parks and organized events. | Mint Hill Veterans Memorial, Parks and recreation areas, Local shops and dining, Mint Hill Farmers Market |
| Huntersville | Located just a short drive away from Matthews, it's a growing area with lake access and outdoor activities, appealing to a broad range of tourists. | Lake Norman, Birkdale Village, Outdoor parks, Golf courses |
| Ballantyne | Famous for its upscale residential areas and corporate offices, Ballantyne attracts business travelers and visitors seeking luxury and convenience. | Ballantyne Village, Golf clubs, Fine dining, Nature trails |
| Southwest Charlotte | A developing area with attractive housing and accessibility to major highways, making it a convenient base for travelers visiting the surrounding regions. | Shopping centers, Local parks, Proximity to major highways, Sports complexes |
Understanding Airbnb License Requirements & STR Laws in Matthews (2026)
While Matthews, North Carolina, United States currently shows low STR regulations, specific Airbnb license requirements might still exist or change. Always verify the latest short term rental regulations and Airbnb license requirements directly with local government authorities for Matthews to ensure full compliance before hosting.
(Source: AirROI data, 2026, finding no licensed listings among those analyzed)
Top Performing Airbnb Properties in Matthews (2026)
Benchmark your potential! Explore examples of top-performing Airbnb properties in Matthewsbased on Trailing Twelve Month (TTM) revenue. Analyze their characteristics, revenue, occupancy rate, and ADR to understand what drives success in this market.
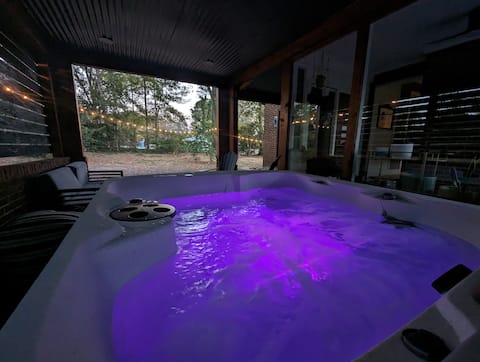
Luxe | Hot Tub | Firepit | Heat Floors | EV | Walk
Entire Place • 2 bedrooms
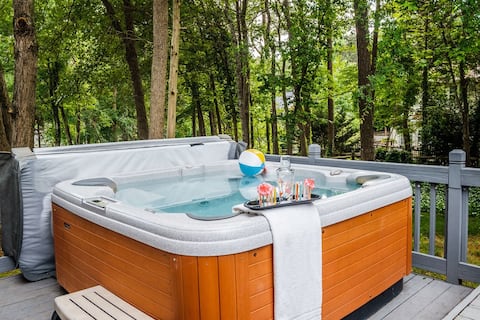
Hot Tub - Suburban - Comfy
Entire Place • 3 bedrooms
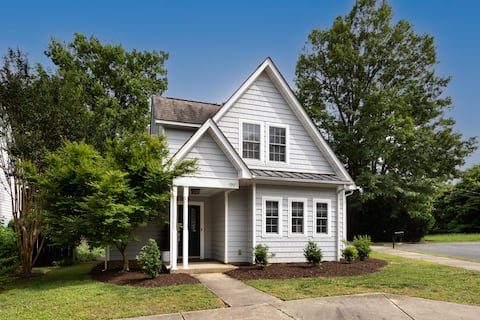
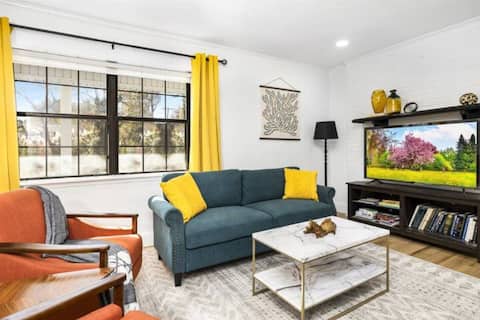
South CLT/Walk to Restaurants/HOT TUB/ Quiet/Clean
Entire Place • 4 bedrooms
6 BD Roomy Duplex | Perfect for Families | Pets OK
Entire Place • 6 bedrooms

NEW! Luxe/Upscale Mountain style-5 Kings-South CLT
Entire Place • 6 bedrooms

WoodrowHaus Large House Sleeps 6
Entire Place • 3 bedrooms
Note: Performance varies based on location, size, amenities, seasonality, and management quality. Data reflects the past 12 months.
Top Performing Airbnb Hosts in Matthews (2026)
Learn from the best! This table showcases top-performing Airbnb hosts in Matthews based on the number of properties managed and estimated total revenue over the past year. Analyze their scale and performance metrics.
| Host Name | Properties | Grossing Revenue | Stay Reviews | Avg Rating |
|---|---|---|---|---|
| Sky Haus - Elevate BNB | 3 | $110,963 | 43 | 4.88/5.0 |
| Mike | 3 | $100,431 | 284 | 4.96/5.0 |
| Katy | 2 | $94,675 | 119 | 5.00/5.0 |
| Ashley | 2 | $92,817 | 48 | 4.93/5.0 |
| Colleen | 1 | $74,529 | 165 | 4.98/5.0 |
| Tamara | 2 | $62,275 | 68 | 4.96/5.0 |
| Ken | 2 | $60,579 | 122 | 4.94/5.0 |
| Sarah Lane | 1 | $58,662 | 40 | 4.85/5.0 |
| William | 1 | $57,254 | 14 | 4.86/5.0 |
| Peter | 1 | $53,070 | 28 | 4.96/5.0 |
Analyzing the strategies of top hosts, such as their property selection, pricing, and guest communication, can offer valuable lessons for optimizing your own Airbnb operations in Matthews.
Dive Deeper: Advanced Matthews STR Market Data (2026)
Ready to unlock more insights? AirROI provides access to advanced metrics and comprehensive Airbnb data for Matthews. Explore detailed analytics beyond this report to refine your investment strategy, optimize pricing, and maximize your vacation rental profits.
Explore Advanced MetricsMatthews Short-Term Rental Market Composition (2026): Property & Room Types
Room Type Distribution
Property Type Distribution
Market Composition Insights for Matthews
- The Matthews Airbnb market composition is heavily skewed towards Entire Home/Apt listings, which make up 82% of the 50 active rentals. This indicates strong guest preference for privacy and space.
- Looking at the property type distribution in Matthews, House properties are the most common (82%), reflecting the local real estate landscape.
- Houses represent a significant 82% portion, catering likely to families or larger groups.
- Smaller segments like others, hotel/boutique, outdoor/unique (combined 12.0%) offer potential for unique stay experiences.
Matthews Airbnb Room Capacity Analysis (2026): Bedroom Distribution
Distribution of Listings by Number of Bedrooms
Room Capacity Insights for Matthews
- The dominant room capacity in Matthews is 3 bedrooms listings, making up 28% of the market. This suggests a strong demand for properties suitable for families or small groups.
- Together, 3 bedrooms and 1 bedroom properties represent 48.0% of the active Airbnb listings in Matthews, indicating a high concentration in these sizes.
- A significant 50.0% of listings offer 3+ bedrooms, catering to larger groups and families seeking more space in Matthews.
Matthews Vacation Rental Guest Capacity Trends (2026)
Distribution of Listings by Guest Capacity
Guest Capacity Insights for Matthews
- The most common guest capacity trend in Matthews vacation rentals is listings accommodating 6 guests (30%). This suggests the primary traveler segment is likely larger groups.
- Properties designed for 6 guests and 8+ guests dominate the Matthews STR market, accounting for 54.0% of listings.
- 58.0% of properties accommodate 6+ guests, serving the market segment for larger families or group travel in Matthews.
- On average, properties in Matthews are equipped to host 4.8 guests.
Matthews Airbnb Booking Patterns (2026): Available vs. Booked Days
Available Days Distribution
Booked Days Distribution
Booking Pattern Insights for Matthews
- The most common availability pattern in Matthews falls within the 271-366 days range, representing 36% of listings. This suggests many properties have significant open periods on their calendars.
- Approximately 66.0% of listings show high availability (181+ days open annually), indicating potential for increased bookings or specific owner usage patterns.
- For booked days, the 181-270 days range is most frequent in Matthews (30%), reflecting common guest stay durations or potential owner blocking patterns.
- A notable 34.0% of properties secure long booking periods (181+ days booked per year), highlighting successful long-term rental strategies or significant owner usage.
Matthews Airbnb Minimum Stay Requirements Analysis
Distribution of Listings by Minimum Night Requirement
1 Night
11 listings
22% of total
2 Nights
9 listings
18% of total
3 Nights
2 listings
4% of total
4-6 Nights
4 listings
8% of total
7-29 Nights
3 listings
6% of total
30+ Nights
21 listings
42% of total
Key Insights
- The most prevalent minimum stay requirement in Matthews is 30+ Nights, adopted by 42% of listings. This highlights the market's preference for longer commitments.
- A significant segment (42%) caters to monthly stays (30+ nights) in Matthews, pointing to opportunities in the extended-stay market.
Recommendations
- Align with the market by considering a 30+ Nights minimum stay, as 42% of Matthews hosts use this setting.
- If feasible, allowing 1-night stays, especially midweek or during low season, could capture last-minute bookings, as only 22% currently do.
- Explore offering discounts for stays of 30+ nights to attract the 42% of the market seeking extended stays.
- Adjust minimum nights based on seasonality – potentially shorter during low season and longer during peak demand periods in Matthews.
Matthews Airbnb Cancellation Policy Trends Analysis (2026)
Limited
2 listings
4% of total
Super Strict 60 Days
1 listings
2% of total
Flexible
9 listings
18% of total
Moderate
5 listings
10% of total
Firm
19 listings
38% of total
Strict
14 listings
28% of total
Cancellation Policy Insights for Matthews
- The prevailing Airbnb cancellation policy trend in Matthews is Firm, used by 38% of listings.
- A majority (66.0%) of hosts in Matthews utilize Firm or Strict policies, indicating a market where hosts prioritize booking security.
Recommendations for Hosts
- Consider adopting a Firm policy to align with the 38% market standard in Matthews.
- Regularly review your cancellation policy against competitors and market demand shifts in Matthews.
Matthews STR Booking Lead Time Analysis (2026)
Average Booking Lead Time by Month
Booking Lead Time Insights for Matthews
- The overall average booking lead time for vacation rentals in Matthews is 34 days.
- Guests book furthest in advance for stays during May (average 49 days), likely coinciding with peak travel demand or local events.
- The shortest booking windows occur for stays in February (average 17 days), indicating more last-minute travel plans during this time.
- Seasonally, Fall (37 days avg.) sees the longest lead times, while Winter (23 days avg.) has the shortest, reflecting typical travel planning cycles.
Recommendations for Hosts
- Use the overall average lead time (34 days) as a baseline for your pricing and availability strategy in Matthews.
- For May stays, consider implementing length-of-stay discounts or slightly higher rates for bookings made less than 49 days out to capitalize on advance planning.
- Target marketing efforts for the Fall season well in advance (at least 37 days) to capture early planners.
- Monitor your own booking lead times against these Matthews averages to identify opportunities for dynamic pricing adjustments.
Popular & Essential Airbnb Amenities in Matthews (2026)
Amenity Prevalence
Amenity Insights for Matthews
- Essential amenities in Matthews that guests expect include: Air conditioning, Smoke alarm, Wifi, Hot water, Heating. Lacking these (any) could significantly impact bookings.
- Popular amenities like Free parking on premises, Coffee maker, Dishes and silverware are common but not universal. Offering these can provide a competitive edge.
Recommendations for Hosts
- Ensure your listing includes all essential amenities for Matthews: Air conditioning, Smoke alarm, Wifi, Hot water, Heating.
- Prioritize adding missing essentials: Hot water, Heating.
- Consider adding popular differentiators like Free parking on premises or Coffee maker to increase appeal.
- Highlight unique or less common amenities you offer (e.g., hot tub, dedicated workspace, EV charger) in your listing description and photos.
- Regularly check competitor amenities in Matthews to stay competitive.
Matthews Airbnb Guest Demographics & Profile Analysis (2026)
Guest Profile Summary for Matthews
- The typical guest profile for Airbnb in Matthews consists of primarily domestic travelers (95%), often arriving from nearby Charlotte, typically belonging to the Post-2000s (Gen Z/Alpha) group (50%), primarily speaking English or Spanish.
- Domestic travelers account for 94.6% of guests.
- Key international markets include United States (94.6%) and DC (0.7%).
- Top languages spoken are English (70.5%) followed by Spanish (14.5%).
- A significant demographic segment is the Post-2000s (Gen Z/Alpha) group, representing 50% of guests.
Recommendations for Hosts
- Target domestic marketing efforts towards travelers from Charlotte and New York.
- Tailor amenities and listing descriptions to appeal to the dominant Post-2000s (Gen Z/Alpha) demographic (e.g., highlight fast WiFi, smart home features, local guides).
- Highlight unique local experiences or amenities relevant to the primary guest profile.
- Consider seasonal promotions aligned with peak travel times for key origin markets.
Nearby Short-Term Rental Market Comparison
How does the Matthews Airbnb market stack up against its neighbors? Compare key performance metrics like average monthly revenue, ADR, and occupancy rates in surrounding areas to understand the broader regional STR landscape.
| Market | Active Properties | Monthly Revenue | Daily Rate | Avg. Occupancy |
|---|---|---|---|---|
| Denver | 109 | $6,309 | $590.96 | 45% |
| Catawba | 16 | $6,093 | $582.49 | 38% |
| Mooresville | 369 | $5,702 | $559.93 | 42% |
| Sherrills Ford | 107 | $5,615 | $547.26 | 41% |
| Troutman | 49 | $5,587 | $467.90 | 42% |
| Lake Norman of Catawba | 51 | $4,972 | $513.30 | 43% |
| Chapin | 93 | $3,971 | $386.37 | 43% |
| Semora | 50 | $3,408 | $377.45 | 38% |
| Watauga County | 47 | $3,370 | $314.71 | 39% |
| Nebo | 88 | $3,330 | $381.79 | 34% |