Marble Airbnb Market Analysis 2026: Short Term Rental Data & Vacation Rental Statistics in North Carolina, United States
Is Airbnb profitable in Marble in 2026? Explore comprehensive Airbnb analytics for Marble, North Carolina, United States to uncover income potential. This 2026 STR market report for Marble, based on AirROI data from February 2025 to January 2026, reveals key trends in the niche market of 32 active listings.
Whether you're considering an Airbnb investment in Marble, optimizing your existing vacation rental, or exploring rental arbitrage opportunities, understanding the Marble Airbnb data is crucial. Leveraging the low regulation environment is key to maximizing your short term rental income potential. Let's dive into the specifics.
Key Marble Airbnb Performance Metrics Overview
Monthly Airbnb Revenue Variations & Income Potential in Marble (2026)
Understanding the monthly revenue variations for Airbnb listings in Marble is key to maximizing your short term rental income potential. Seasonality significantly impacts earnings. Our analysis, based on data from the past 12 months, shows that the peak revenue month for STRs in Marble is typically October, while March often presents the lowest earnings, highlighting opportunities for strategic pricing adjustments during shoulder and low seasons. Explore the typical Airbnb income in Marble across different performance tiers:
- Best-in-class properties (Top 10%) achieve $4,854+ monthly, often utilizing dynamic pricing and superior guest experiences.
- Strong performing properties (Top 25%) earn $3,509 or more, indicating effective management and desirable locations/amenities.
- Typical properties (Median) generate around $2,252 per month, representing the average market performance.
- Entry-level properties (Bottom 25%) see earnings around $1,327, often with potential for optimization.
Average Monthly Airbnb Earnings Trend in Marble
Marble Airbnb Occupancy Rate Trends (2026)
Maximize your bookings by understanding the Marble STR occupancy trends. Seasonal demand shifts significantly influence how often properties are booked. Typically, Octobersees the highest demand (peak season occupancy), while March experiences the lowest (low season). Effective strategies, like adjusting minimum stays or offering promotions, can boost occupancy during slower periods. Here's how different property tiers perform in Marble:
- Best-in-class properties (Top 10%) achieve 78%+ occupancy, indicating high desirability and potentially optimized availability.
- Strong performing properties (Top 25%) maintain 63% or higher occupancy, suggesting good market fit and guest satisfaction.
- Typical properties (Median) have an occupancy rate around 48%.
- Entry-level properties (Bottom 25%) average 30% occupancy, potentially facing higher vacancy.
Average Monthly Occupancy Rate Trend in Marble
Average Daily Rate (ADR) Airbnb Trends in Marble (2026)
Effective short term rental pricing strategy in Marble involves understanding monthly ADR fluctuations. The Average Daily Rate (ADR) for Airbnb in Marble typically peaks in December and dips lowest during April. Leveraging Airbnb dynamic pricing tools or strategies based on this seasonality can significantly boost revenue. Here's a look at the typical nightly rates achieved:
- Best-in-class properties (Top 10%) command rates of $272+ per night, often due to premium features or locations.
- Strong performing properties (Top 25%) achieve nightly rates of $225 or more.
- Typical properties (Median) charge around $174 per night.
- Entry-level properties (Bottom 25%) earn around $120 per night.
Average Daily Rate (ADR) Trend by Month in Marble
Get Live Marble Market Intelligence 👇

Explore Real-time Analytics
Airbnb Seasonality Analysis & Trends in Marble (2026)
Peak Season (October, November, July)
- Revenue averages $3,752 per month
- Occupancy rates average 63.9%
- Daily rates average $193
Shoulder Season
- Revenue averages $2,611 per month
- Occupancy maintains around 48.4%
- Daily rates hold near $184
Low Season (February, March, April)
- Revenue drops to average $1,321 per month
- Occupancy decreases to average 30.6%
- Daily rates adjust to average $156
Seasonality Insights for Marble
- The Airbnb seasonality in Marble shows highly seasonal trends requiring careful strategy. While the sections above show seasonal averages, it's also insightful to look at the extremes:
- During the high season, the absolute peak month showcases Marble's highest earning potential, with monthly revenues capable of climbing to $4,106, occupancy reaching a high of 68.8%, and ADRs peaking at $205.
- Conversely, the slowest single month of the year, typically falling within the low season, marks the market's lowest point. In this month, revenue might dip to $1,210, occupancy could drop to 29.5%, and ADRs may adjust down to $154.
- Understanding both the seasonal averages and these monthly peaks and troughs in revenue, occupancy, and ADR is crucial for maximizing your Airbnb profit potential in Marble.
Seasonal Strategies for Maximizing Profit
- Peak Season: Maximize revenue through premium pricing and potentially longer minimum stays. Ensure high availability.
- Low Season: Offer competitive pricing, special promotions (e.g., extended stay discounts), and flexible cancellation policies. Target off-season travelers like remote workers or budget-conscious guests.
- Shoulder Seasons: Implement dynamic pricing that balances peak and low rates. Target weekend travelers or specific events. Offer slightly more flexible terms than peak season.
- Regularly analyze your own performance against these Marble seasonality benchmarks and adjust your pricing and availability strategy accordingly.
Best Areas for Airbnb Investment in Marble (2026)
Exploring the top neighborhoods for short-term rentals in Marble? This section highlights key areas, outlining why they are attractive for hosts and guests, along with notable local attractions. Consider these locations based on your target guest profile and investment strategy.
| Neighborhood / Area | Why Host Here? (Target Guests & Appeal) | Key Attractions & Landmarks |
|---|---|---|
| Nantahala National Forest | A stunning natural area perfect for outdoor enthusiasts, offering hiking, fishing, and beautiful views. Great for travelers seeking adventure and serenity in nature. | Nantahala River, Lake Nantahala, Tsali Recreation Area, Nantahala Outdoor Center, Joyce Kilmer Memorial Forest |
| Cherokee | A culturally rich area known for its Native American heritage and proximity to the Great Smoky Mountains National Park. Ideal for those interested in history and outdoor activities. | Museum of the Cherokee Indian, Oconaluftee Indian Village, Great Smoky Mountains National Park, Harrah's Cherokee Casino |
| Bryson City | A charming small town with access to the Great Smoky Mountains and the scenic Nantahala River. Perfect for families and couples looking for a getaway. | Great Smoky Mountains Railroad, Deep Creek, Nantahala Brewing Company, Fontana Lake |
| Sylva | A picturesque town with a vibrant arts scene and beautiful mountain views. Offers restaurants, shops, and opportunities for outdoor recreation. | Sylva Artisan Market, Judaculla Rock, Scott Creek, Poteet Park |
| Dillsboro | A quaint town with an artistic community, known for its pottery and art galleries. Great for travelers seeking a charming atmosphere and local craftsmanship. | Dillsboro River Company, Dogwood Crafters, Nantahala Brewing Company |
| Franklin | Renowned for its antique shops and outdoor activities, Franklin is perfect for those looking to explore the Southern Appalachian region. | Franklin Gem and Mineral Museum, Coweeta Hydrologic Laboratory, Cartoogechaye Creek, Macon County Historical Society |
| Waynesville | A vibrant mountain town near numerous hiking trails and outdoor activities. Popular with visitors seeking a blend of culture and nature. | Blue Ridge Parkway, Waynesville Art School & Gallery, Gay Street, Waterrock Knob |
| Cashiers | Nestled in the mountains, Cashiers is a peaceful retreat known for its lakes and stunning landscapes, attracting nature lovers and those looking to unwind. | Whiteside Mountain, Cashiers Farmers Market, Lake Glenville, Silver Run Falls |
Understanding Airbnb License Requirements & STR Laws in Marble (2026)
While Marble, North Carolina, United States currently shows low STR regulations, specific Airbnb license requirements might still exist or change. Always verify the latest short term rental regulations and Airbnb license requirements directly with local government authorities for Marble to ensure full compliance before hosting.
(Source: AirROI data, 2026, finding no licensed listings among those analyzed)
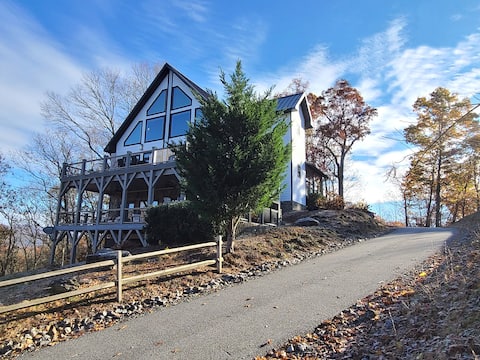
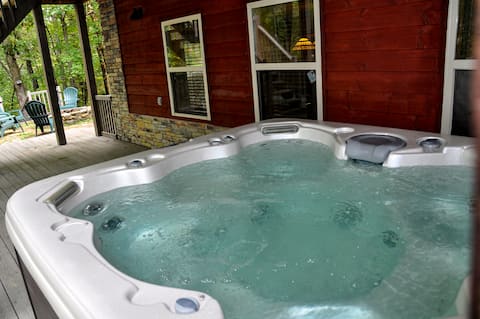
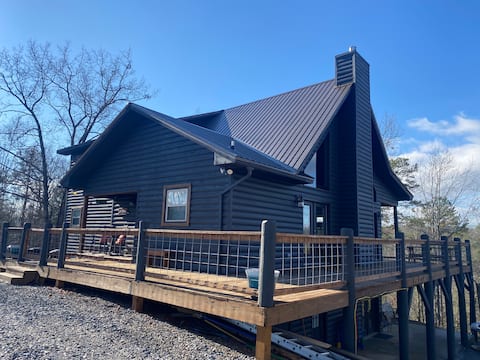
Top Performing Airbnb Properties in Marble (2026)
Benchmark your potential! Explore examples of top-performing Airbnb properties in Marblebased on Trailing Twelve Month (TTM) revenue. Analyze their characteristics, revenue, occupancy rate, and ADR to understand what drives success in this market.
The Cozzi Lodge
Entire Place • 5 bedrooms
Wild Wolf Lodge
Entire Place • 5 bedrooms
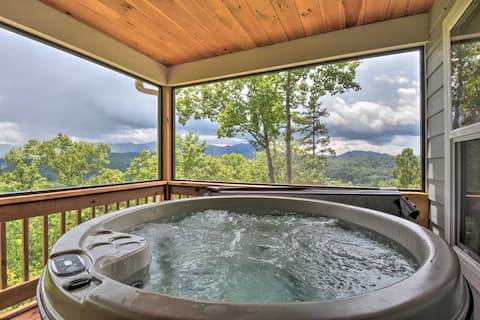
Hot Tub Relaxation & Mtn View: ‘Sky Blue Overlook’
Entire Place • 2 bedrooms

Red Hacienda ~ Mountain Retreat
Entire Place • 3 bedrooms
3 story/views/2 dens/huge porch/mins to casino
Entire Place • 4 bedrooms

Deck & Sauna: Avalon Woods Riverfront Retreat
Entire Place • 3 bedrooms
Note: Performance varies based on location, size, amenities, seasonality, and management quality. Data reflects the past 12 months.
Top Performing Airbnb Hosts in Marble (2026)
Learn from the best! This table showcases top-performing Airbnb hosts in Marble based on the number of properties managed and estimated total revenue over the past year. Analyze their scale and performance metrics.
| Host Name | Properties | Grossing Revenue | Stay Reviews | Avg Rating |
|---|---|---|---|---|
| Evolve | 5 | $93,909 | 189 | 4.56/5.0 |
| Great Mountain | 3 | $74,146 | 34 | 4.85/5.0 |
| Robert | 1 | $61,567 | 82 | 4.96/5.0 |
| Chrissy | 2 | $58,740 | 157 | 4.75/5.0 |
| Sandra | 1 | $44,460 | 132 | 4.94/5.0 |
| Courtney | 1 | $40,794 | 29 | 4.97/5.0 |
| Evolve | 1 | $40,490 | 162 | 4.80/5.0 |
| William | 1 | $40,344 | 30 | 5.00/5.0 |
| Dan And Michelle | 1 | $39,458 | 142 | 4.97/5.0 |
| Brian | 1 | $34,480 | 57 | 4.91/5.0 |
Analyzing the strategies of top hosts, such as their property selection, pricing, and guest communication, can offer valuable lessons for optimizing your own Airbnb operations in Marble.
Dive Deeper: Advanced Marble STR Market Data (2026)
Ready to unlock more insights? AirROI provides access to advanced metrics and comprehensive Airbnb data for Marble. Explore detailed analytics beyond this report to refine your investment strategy, optimize pricing, and maximize your vacation rental profits.
Explore Advanced MetricsMarble Short-Term Rental Market Composition (2026): Property & Room Types
Room Type Distribution
Property Type Distribution
Market Composition Insights for Marble
- The Marble Airbnb market composition is heavily skewed towards Entire Home/Apt listings, which make up 96.9% of the 32 active rentals. This indicates strong guest preference for privacy and space.
- Looking at the property type distribution in Marble, Outdoor/Unique properties are the most common (56.3%), reflecting the local real estate landscape.
- Houses represent a significant 34.4% portion, catering likely to families or larger groups.
- The presence of 6.3% Hotel/Boutique listings indicates integration with traditional hospitality.
- Smaller segments like unique stays (combined 3.1%) offer potential for unique stay experiences.
Marble Airbnb Room Capacity Analysis (2026): Bedroom Distribution
Distribution of Listings by Number of Bedrooms
Room Capacity Insights for Marble
- The dominant room capacity in Marble is 2 bedrooms listings, making up 40.6% of the market. This suggests a strong demand for properties suitable for couples or solo travelers.
- Together, 2 bedrooms and 1 bedroom properties represent 56.2% of the active Airbnb listings in Marble, indicating a high concentration in these sizes.
- A significant 37.5% of listings offer 3+ bedrooms, catering to larger groups and families seeking more space in Marble.
Marble Vacation Rental Guest Capacity Trends (2026)
Distribution of Listings by Guest Capacity
Guest Capacity Insights for Marble
- The most common guest capacity trend in Marble vacation rentals is listings accommodating 8+ guests (40.6%). This suggests the primary traveler segment is likely larger groups.
- Properties designed for 8+ guests and 4 guests dominate the Marble STR market, accounting for 65.6% of listings.
- 62.5% of properties accommodate 6+ guests, serving the market segment for larger families or group travel in Marble.
- On average, properties in Marble are equipped to host 6.0 guests.
Marble Airbnb Booking Patterns (2026): Available vs. Booked Days
Available Days Distribution
Booked Days Distribution
Booking Pattern Insights for Marble
- The most common availability pattern in Marble falls within the 181-270 days range, representing 46.9% of listings. This suggests many properties have significant open periods on their calendars.
- Approximately 71.9% of listings show high availability (181+ days open annually), indicating potential for increased bookings or specific owner usage patterns.
- For booked days, the 91-180 days range is most frequent in Marble (43.8%), reflecting common guest stay durations or potential owner blocking patterns.
- A notable 31.2% of properties secure long booking periods (181+ days booked per year), highlighting successful long-term rental strategies or significant owner usage.
Marble Airbnb Minimum Stay Requirements Analysis
Distribution of Listings by Minimum Night Requirement
1 Night
6 listings
18.8% of total
2 Nights
10 listings
31.3% of total
3 Nights
4 listings
12.5% of total
30+ Nights
12 listings
37.5% of total
Key Insights
- The most prevalent minimum stay requirement in Marble is 30+ Nights, adopted by 37.5% of listings. This highlights the market's preference for longer commitments.
- A significant segment (37.5%) caters to monthly stays (30+ nights) in Marble, pointing to opportunities in the extended-stay market.
Recommendations
- Align with the market by considering a 30+ Nights minimum stay, as 37.5% of Marble hosts use this setting.
- If feasible, allowing 1-night stays, especially midweek or during low season, could capture last-minute bookings, as only 18.8% currently do.
- A 2-night minimum appears standard (31.3%). Consider this for weekends or peak periods.
- Explore offering discounts for stays of 30+ nights to attract the 37.5% of the market seeking extended stays.
- Adjust minimum nights based on seasonality – potentially shorter during low season and longer during peak demand periods in Marble.
Marble Airbnb Cancellation Policy Trends Analysis (2026)
Super Strict 30 Days
1 listings
3.1% of total
Flexible
6 listings
18.8% of total
Moderate
10 listings
31.3% of total
Firm
8 listings
25% of total
Strict
7 listings
21.9% of total
Cancellation Policy Insights for Marble
- The prevailing Airbnb cancellation policy trend in Marble is Moderate, used by 31.3% of listings.
- There's a relatively balanced mix between guest-friendly (50.1%) and stricter (46.9%) policies, offering choices for different guest needs.
Recommendations for Hosts
- Consider adopting a Moderate policy to align with the 31.3% market standard in Marble.
- Regularly review your cancellation policy against competitors and market demand shifts in Marble.
Marble STR Booking Lead Time Analysis (2026)
Average Booking Lead Time by Month
Booking Lead Time Insights for Marble
- The overall average booking lead time for vacation rentals in Marble is 35 days.
- Guests book furthest in advance for stays during October (average 54 days), likely coinciding with peak travel demand or local events.
- The shortest booking windows occur for stays in February (average 18 days), indicating more last-minute travel plans during this time.
- Seasonally, Fall (47 days avg.) sees the longest lead times, while Winter (28 days avg.) has the shortest, reflecting typical travel planning cycles.
Recommendations for Hosts
- Use the overall average lead time (35 days) as a baseline for your pricing and availability strategy in Marble.
- For October stays, consider implementing length-of-stay discounts or slightly higher rates for bookings made less than 54 days out to capitalize on advance planning.
- Target marketing efforts for the Fall season well in advance (at least 47 days) to capture early planners.
- Monitor your own booking lead times against these Marble averages to identify opportunities for dynamic pricing adjustments.
Popular & Essential Airbnb Amenities in Marble (2026)
Amenity Prevalence
Amenity Insights for Marble
- Essential amenities in Marble that guests expect include: Air conditioning, Hot water, Heating, Smoke alarm, Free parking on premises. Lacking these (any) could significantly impact bookings.
- Popular amenities like Wifi, TV, Bed linens are common but not universal. Offering these can provide a competitive edge.
- Warning: Wifi is not universally provided but is considered essential globally. Ensure reliable Wifi is offered.
Recommendations for Hosts
- Ensure your listing includes all essential amenities for Marble: Air conditioning, Hot water, Heating, Smoke alarm, Free parking on premises.
- Prioritize adding missing essentials: Smoke alarm, Free parking on premises.
- Consider adding popular differentiators like Wifi or TV to increase appeal.
- Highlight unique or less common amenities you offer (e.g., hot tub, dedicated workspace, EV charger) in your listing description and photos.
- Regularly check competitor amenities in Marble to stay competitive.
Marble Airbnb Guest Demographics & Profile Analysis (2026)
Guest Profile Summary for Marble
- The typical guest profile for Airbnb in Marble consists of primarily domestic travelers (99%), often arriving from nearby Atlanta, typically belonging to the Post-2000s (Gen Z/Alpha) group (50%), primarily speaking English or Spanish.
- Domestic travelers account for 99.3% of guests.
- Key international markets include United States (99.3%) and Japan (0.4%).
- Top languages spoken are English (75.2%) followed by Spanish (9.9%).
- A significant demographic segment is the Post-2000s (Gen Z/Alpha) group, representing 50% of guests.
Recommendations for Hosts
- Target domestic marketing efforts towards travelers from Atlanta and Douglasville.
- Tailor amenities and listing descriptions to appeal to the dominant Post-2000s (Gen Z/Alpha) demographic (e.g., highlight fast WiFi, smart home features, local guides).
- Highlight unique local experiences or amenities relevant to the primary guest profile.
- Consider seasonal promotions aligned with peak travel times for key origin markets.
Nearby Short-Term Rental Market Comparison
How does the Marble Airbnb market stack up against its neighbors? Compare key performance metrics like average monthly revenue, ADR, and occupancy rates in surrounding areas to understand the broader regional STR landscape.
| Market | Active Properties | Monthly Revenue | Daily Rate | Avg. Occupancy |
|---|---|---|---|---|
| Sevier County | 68 | $7,108 | $567.95 | 44% |
| Gilmer County | 26 | $5,298 | $459.59 | 40% |
| Union Mills | 15 | $4,938 | $442.76 | 41% |
| Sevierville | 6,269 | $4,747 | $370.20 | 46% |
| Fannin County | 42 | $4,574 | $435.93 | 38% |
| East Ellijay | 15 | $4,415 | $368.05 | 41% |
| Epworth | 79 | $4,411 | $406.97 | 40% |
| Six Mile | 57 | $4,396 | $449.78 | 42% |
| Gatlinburg | 3,565 | $4,385 | $353.70 | 45% |
| Commerce | 19 | $4,298 | $285.34 | 45% |