Maggie Valley Airbnb Market Analysis 2026: Short Term Rental Data & Vacation Rental Statistics in North Carolina, United States
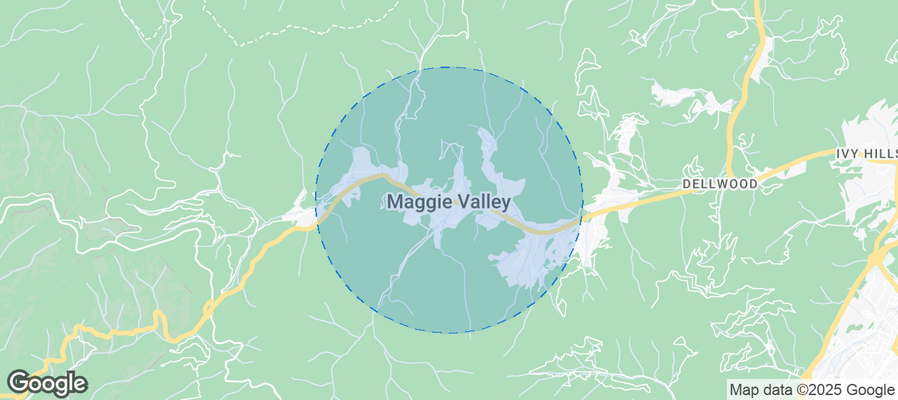
Is Airbnb profitable in Maggie Valley in 2026? Explore comprehensive Airbnb analytics for Maggie Valley, North Carolina, United States to uncover income potential. This 2026 STR market report for Maggie Valley, based on AirROI data from February 2025 to January 2026, reveals key trends in the market of 557 active listings.
Whether you're considering an Airbnb investment in Maggie Valley, optimizing your existing vacation rental, or exploring rental arbitrage opportunities, understanding the Maggie Valley Airbnb data is crucial. Leveraging the low regulation environment is key to maximizing your short term rental income potential. Let's dive into the specifics.
Key Maggie Valley Airbnb Performance Metrics Overview
Monthly Airbnb Revenue Variations & Income Potential in Maggie Valley (2026)
Understanding the monthly revenue variations for Airbnb listings in Maggie Valley is key to maximizing your short term rental income potential. Seasonality significantly impacts earnings. Our analysis, based on data from the past 12 months, shows that the peak revenue month for STRs in Maggie Valley is typically October, while April often presents the lowest earnings, highlighting opportunities for strategic pricing adjustments during shoulder and low seasons. Explore the typical Airbnb income in Maggie Valley across different performance tiers:
- Best-in-class properties (Top 10%) achieve $6,156+ monthly, often utilizing dynamic pricing and superior guest experiences.
- Strong performing properties (Top 25%) earn $4,092 or more, indicating effective management and desirable locations/amenities.
- Typical properties (Median) generate around $2,576 per month, representing the average market performance.
- Entry-level properties (Bottom 25%) see earnings around $1,454, often with potential for optimization.
Average Monthly Airbnb Earnings Trend in Maggie Valley
Maggie Valley Airbnb Occupancy Rate Trends (2026)
Maximize your bookings by understanding the Maggie Valley STR occupancy trends. Seasonal demand shifts significantly influence how often properties are booked. Typically, Octobersees the highest demand (peak season occupancy), while April experiences the lowest (low season). Effective strategies, like adjusting minimum stays or offering promotions, can boost occupancy during slower periods. Here's how different property tiers perform in Maggie Valley:
- Best-in-class properties (Top 10%) achieve 73%+ occupancy, indicating high desirability and potentially optimized availability.
- Strong performing properties (Top 25%) maintain 57% or higher occupancy, suggesting good market fit and guest satisfaction.
- Typical properties (Median) have an occupancy rate around 39%.
- Entry-level properties (Bottom 25%) average 22% occupancy, potentially facing higher vacancy.
Average Monthly Occupancy Rate Trend in Maggie Valley
Average Daily Rate (ADR) Airbnb Trends in Maggie Valley (2026)
Effective short term rental pricing strategy in Maggie Valley involves understanding monthly ADR fluctuations. The Average Daily Rate (ADR) for Airbnb in Maggie Valley typically peaks in December and dips lowest during February. Leveraging Airbnb dynamic pricing tools or strategies based on this seasonality can significantly boost revenue. Here's a look at the typical nightly rates achieved:
- Best-in-class properties (Top 10%) command rates of $386+ per night, often due to premium features or locations.
- Strong performing properties (Top 25%) achieve nightly rates of $289 or more.
- Typical properties (Median) charge around $216 per night.
- Entry-level properties (Bottom 25%) earn around $167 per night.
Average Daily Rate (ADR) Trend by Month in Maggie Valley
Get Live Maggie Valley Market Intelligence 👇
Explore Real-time Analytics
Airbnb Seasonality Analysis & Trends in Maggie Valley (2026)
Peak Season (October, July, December)
- Revenue averages $4,376 per month
- Occupancy rates average 50.6%
- Daily rates average $267
Shoulder Season
- Revenue averages $3,070 per month
- Occupancy maintains around 39.5%
- Daily rates hold near $248
Low Season (February, April, May)
- Revenue drops to average $2,127 per month
- Occupancy decreases to average 33.4%
- Daily rates adjust to average $219
Seasonality Insights for Maggie Valley
- The Airbnb seasonality in Maggie Valley shows highly seasonal trends requiring careful strategy. While the sections above show seasonal averages, it's also insightful to look at the extremes:
- During the high season, the absolute peak month showcases Maggie Valley's highest earning potential, with monthly revenues capable of climbing to $4,946, occupancy reaching a high of 57.1%, and ADRs peaking at $280.
- Conversely, the slowest single month of the year, typically falling within the low season, marks the market's lowest point. In this month, revenue might dip to $1,999, occupancy could drop to 30.9%, and ADRs may adjust down to $214.
- Understanding both the seasonal averages and these monthly peaks and troughs in revenue, occupancy, and ADR is crucial for maximizing your Airbnb profit potential in Maggie Valley.
Seasonal Strategies for Maximizing Profit
- Peak Season: Maximize revenue through premium pricing and potentially longer minimum stays. Ensure high availability.
- Low Season: Offer competitive pricing, special promotions (e.g., extended stay discounts), and flexible cancellation policies. Target off-season travelers like remote workers or budget-conscious guests.
- Shoulder Seasons: Implement dynamic pricing that balances peak and low rates. Target weekend travelers or specific events. Offer slightly more flexible terms than peak season.
- Regularly analyze your own performance against these Maggie Valley seasonality benchmarks and adjust your pricing and availability strategy accordingly.
Best Areas for Airbnb Investment in Maggie Valley (2026)
Exploring the top neighborhoods for short-term rentals in Maggie Valley? This section highlights key areas, outlining why they are attractive for hosts and guests, along with notable local attractions. Consider these locations based on your target guest profile and investment strategy.
| Neighborhood / Area | Why Host Here? (Target Guests & Appeal) | Key Attractions & Landmarks |
|---|---|---|
| Cataloochee Valley | Known for its beautiful landscapes, wildlife, and historic buildings. A popular spot for nature lovers and outdoor activities, making it ideal for Airbnb hosts catering to ecotourists and families. | Cataloochee Valley Historic District, Cataloochee Ski Area, Balsam Mountain Preserve, Great Smoky Mountains National Park, Wildlife Watching |
| Maggie Valley Village | The heart of Maggie Valley, featuring local shops and restaurants. It attracts visitors looking to experience the local culture and hospitality of the area. | Maggie Valley Opry House, Wheels Through Time Museum, Maggie Valley Festival Grounds, Ghost Town in the Sky, Maggie Valley Club and Resort |
| Lake Junaluska | A scenic area known for its tranquility and beautiful lake, popular with families and those looking for a peaceful getaway. | Lake Junaluska Conference and Retreat Center, Lake Junaluska Walking Trail, Memorial Chapel, Harrell Center, Summer Worship Events |
| Blue Ridge Parkway | Renowned for its stunning views and outdoor adventures, this area attracts travelers interested in hiking, camping, and picturesque scenery. | Blue Ridge Parkway, Waterrock Knob, Craggy Gardens, Mount Mitchell State Park, Hiking Trails |
| Smoky Mountains | Part of the Great Smoky Mountains National Park, this region draws many nature enthusiasts and hikers, making it a great spot for vacation rentals. | Clingmans Dome, Cades Cove, Roaring Fork Motor Nature Trail, Cataloochee Valley, Wildflower Viewing |
| Waynesville | A neighboring town with a charming downtown area, featuring arts, crafts, and dining options. It attracts visitors looking for local experiences. | Downtown Waynesville, Waynesville Art Museum, Haywood County Museum, Blue Ridge Parkway, Balsam Range |
| Cherokee | Nearby Cherokee is rich in Native American history and culture, making it attractive for tourists interested in heritage and exploration. | Oconaluftee Indian Village, Museum of the Cherokee Indian, Harrah's Cherokee Casino, Great Smoky Mountains National Park, Tsali Recreation Area |
| Fines Creek | A quieter area that offers a more serene mountain experience, perfect for visitors wanting respite from busier tourist spots. | Fines Creek Community Park, Haywood County Waterfalls, Scenic Drives, Local Wildlife Viewing, Hiking Trails |
Understanding Airbnb License Requirements & STR Laws in Maggie Valley (2026)
While Maggie Valley, North Carolina, United States currently shows low STR regulations, specific Airbnb license requirements might still exist or change. Always verify the latest short term rental regulations and Airbnb license requirements directly with local government authorities for Maggie Valley to ensure full compliance before hosting.
(Source: AirROI data, 2026, finding no licensed listings among those analyzed)
Top Performing Airbnb Properties in Maggie Valley (2026)
Benchmark your potential! Explore examples of top-performing Airbnb properties in Maggie Valleybased on Trailing Twelve Month (TTM) revenue. Analyze their characteristics, revenue, occupancy rate, and ADR to understand what drives success in this market.
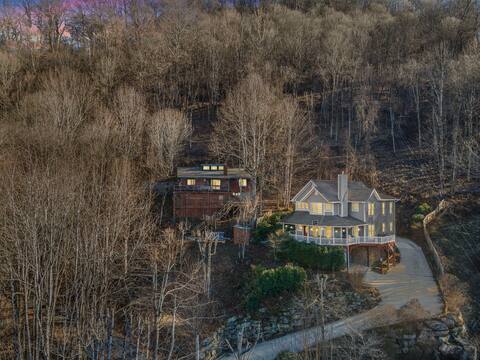
Majestic Mountaintop Estate
Entire Place • 8 bedrooms
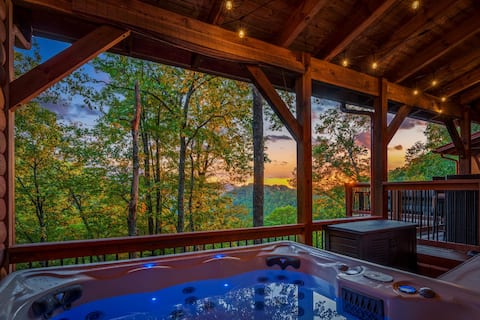
Sauna, Theater, Hot Tub, & Mtn View | Sleeps 23
Entire Place • 6 bedrooms
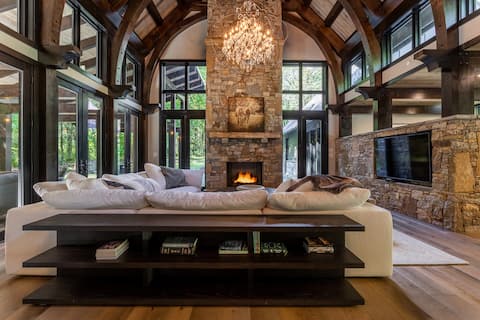
Stunning Private Home with Impeccable Architecture
Entire Place • 4 bedrooms
4 Loves Lodge
Entire Place • 6 bedrooms

Winter Fun Awaits! Chalet w/HotTub near Ski&Tubing
Entire Place • 4 bedrooms

Mountain PeakView - Breathtaking Views!
Entire Place • 3 bedrooms
Note: Performance varies based on location, size, amenities, seasonality, and management quality. Data reflects the past 12 months.
Top Performing Airbnb Hosts in Maggie Valley (2026)
Learn from the best! This table showcases top-performing Airbnb hosts in Maggie Valley based on the number of properties managed and estimated total revenue over the past year. Analyze their scale and performance metrics.
| Host Name | Properties | Grossing Revenue | Stay Reviews | Avg Rating |
|---|---|---|---|---|
| Loriel And Adam | 42 | $1,962,124 | 3108 | 4.94/5.0 |
| Eve | 30 | $962,533 | 923 | 4.92/5.0 |
| Evolve | 28 | $728,791 | 646 | 4.77/5.0 |
| Tom | 31 | $689,938 | 1157 | 4.89/5.0 |
| Ed | 4 | $441,465 | 508 | 4.89/5.0 |
| Maggie | 26 | $362,025 | 233 | 4.78/5.0 |
| Carolina Mornings | 5 | $306,289 | 137 | 4.77/5.0 |
| Nicole | 3 | $271,343 | 45 | 4.99/5.0 |
| Yonder | 3 | $240,141 | 108 | 4.76/5.0 |
| Racquel | 1 | $234,657 | 43 | 5.00/5.0 |
Analyzing the strategies of top hosts, such as their property selection, pricing, and guest communication, can offer valuable lessons for optimizing your own Airbnb operations in Maggie Valley.
Dive Deeper: Advanced Maggie Valley STR Market Data (2026)
Ready to unlock more insights? AirROI provides access to advanced metrics and comprehensive Airbnb data for Maggie Valley. Explore detailed analytics beyond this report to refine your investment strategy, optimize pricing, and maximize your vacation rental profits.
Explore Advanced MetricsMaggie Valley Short-Term Rental Market Composition (2026): Property & Room Types
Room Type Distribution
Property Type Distribution
Market Composition Insights for Maggie Valley
- The Maggie Valley Airbnb market composition is heavily skewed towards Entire Home/Apt listings, which make up 99.1% of the 557 active rentals. This indicates strong guest preference for privacy and space.
- Looking at the property type distribution in Maggie Valley, Outdoor/Unique properties are the most common (56.6%), reflecting the local real estate landscape.
- Houses represent a significant 36.6% portion, catering likely to families or larger groups.
- Smaller segments like apartment/condo, others, hotel/boutique, unique stays (combined 6.9%) offer potential for unique stay experiences.
Maggie Valley Airbnb Room Capacity Analysis (2026): Bedroom Distribution
Distribution of Listings by Number of Bedrooms
Room Capacity Insights for Maggie Valley
- The dominant room capacity in Maggie Valley is 3 bedrooms listings, making up 35.5% of the market. This suggests a strong demand for properties suitable for families or small groups.
- Together, 3 bedrooms and 2 bedrooms properties represent 70.1% of the active Airbnb listings in Maggie Valley, indicating a high concentration in these sizes.
- A significant 54.2% of listings offer 3+ bedrooms, catering to larger groups and families seeking more space in Maggie Valley.
Maggie Valley Vacation Rental Guest Capacity Trends (2026)
Distribution of Listings by Guest Capacity
Guest Capacity Insights for Maggie Valley
- The most common guest capacity trend in Maggie Valley vacation rentals is listings accommodating 8+ guests (39.3%). This suggests the primary traveler segment is likely larger groups.
- Properties designed for 8+ guests and 6 guests dominate the Maggie Valley STR market, accounting for 69.8% of listings.
- 74.1% of properties accommodate 6+ guests, serving the market segment for larger families or group travel in Maggie Valley.
- On average, properties in Maggie Valley are equipped to host 6.2 guests.
Maggie Valley Airbnb Booking Patterns (2026): Available vs. Booked Days
Available Days Distribution
Booked Days Distribution
Booking Pattern Insights for Maggie Valley
- The most common availability pattern in Maggie Valley falls within the 271-366 days range, representing 43.4% of listings. This suggests many properties have significant open periods on their calendars.
- Approximately 77.9% of listings show high availability (181+ days open annually), indicating potential for increased bookings or specific owner usage patterns.
- For booked days, the 91-180 days range is most frequent in Maggie Valley (36.3%), reflecting common guest stay durations or potential owner blocking patterns.
- A notable 22.8% of properties secure long booking periods (181+ days booked per year), highlighting successful long-term rental strategies or significant owner usage.
Maggie Valley Airbnb Minimum Stay Requirements Analysis
Distribution of Listings by Minimum Night Requirement
1 Night
43 listings
7.7% of total
2 Nights
252 listings
45.3% of total
3 Nights
43 listings
7.7% of total
4-6 Nights
22 listings
4% of total
7-29 Nights
7 listings
1.3% of total
30+ Nights
189 listings
34% of total
Key Insights
- The most prevalent minimum stay requirement in Maggie Valley is 2 Nights, adopted by 45.3% of listings. This highlights the market's preference for shorter, flexible bookings.
- A significant segment (34%) caters to monthly stays (30+ nights) in Maggie Valley, pointing to opportunities in the extended-stay market.
Recommendations
- Align with the market by considering a 2 Nights minimum stay, as 45.3% of Maggie Valley hosts use this setting.
- If feasible, allowing 1-night stays, especially midweek or during low season, could capture last-minute bookings, as only 7.7% currently do.
- A 2-night minimum appears standard (45.3%). Consider this for weekends or peak periods.
- Explore offering discounts for stays of 30+ nights to attract the 34% of the market seeking extended stays.
- Adjust minimum nights based on seasonality – potentially shorter during low season and longer during peak demand periods in Maggie Valley.
Maggie Valley Airbnb Cancellation Policy Trends Analysis (2026)
Limited
20 listings
3.6% of total
Super Strict 30 Days
15 listings
2.7% of total
Super Strict 60 Days
33 listings
5.9% of total
Flexible
62 listings
11.2% of total
Moderate
129 listings
23.2% of total
Firm
213 listings
38.4% of total
Strict
83 listings
15% of total
Cancellation Policy Insights for Maggie Valley
- The prevailing Airbnb cancellation policy trend in Maggie Valley is Firm, used by 38.4% of listings.
- A majority (53.4%) of hosts in Maggie Valley utilize Firm or Strict policies, indicating a market where hosts prioritize booking security.
Recommendations for Hosts
- Consider adopting a Firm policy to align with the 38.4% market standard in Maggie Valley.
- Regularly review your cancellation policy against competitors and market demand shifts in Maggie Valley.
Maggie Valley STR Booking Lead Time Analysis (2026)
Average Booking Lead Time by Month
Booking Lead Time Insights for Maggie Valley
- The overall average booking lead time for vacation rentals in Maggie Valley is 60 days.
- Guests book furthest in advance for stays during April (average 98 days), likely coinciding with peak travel demand or local events.
- The shortest booking windows occur for stays in February (average 33 days), indicating more last-minute travel plans during this time.
- Seasonally, Fall (69 days avg.) sees the longest lead times, while Winter (44 days avg.) has the shortest, reflecting typical travel planning cycles.
Recommendations for Hosts
- Use the overall average lead time (60 days) as a baseline for your pricing and availability strategy in Maggie Valley.
- For April stays, consider implementing length-of-stay discounts or slightly higher rates for bookings made less than 98 days out to capitalize on advance planning.
- Target marketing efforts for the Fall season well in advance (at least 69 days) to capture early planners.
- Monitor your own booking lead times against these Maggie Valley averages to identify opportunities for dynamic pricing adjustments.
Popular & Essential Airbnb Amenities in Maggie Valley (2026)
Amenity Prevalence
Amenity Insights for Maggie Valley
- Essential amenities in Maggie Valley that guests expect include: TV, Wifi, Smoke alarm, Heating, Kitchen, Free parking on premises. Lacking these (any) could significantly impact bookings.
- Popular amenities like Hot water, Air conditioning, Coffee maker are common but not universal. Offering these can provide a competitive edge.
Recommendations for Hosts
- Ensure your listing includes all essential amenities for Maggie Valley: TV, Wifi, Smoke alarm, Heating, Kitchen, Free parking on premises.
- Prioritize adding missing essentials: TV, Wifi, Smoke alarm, Heating, Kitchen, Free parking on premises.
- Consider adding popular differentiators like Hot water or Air conditioning to increase appeal.
- Highlight unique or less common amenities you offer (e.g., hot tub, dedicated workspace, EV charger) in your listing description and photos.
- Regularly check competitor amenities in Maggie Valley to stay competitive.
Maggie Valley Airbnb Guest Demographics & Profile Analysis (2026)
Guest Profile Summary for Maggie Valley
- The typical guest profile for Airbnb in Maggie Valley consists of primarily domestic travelers (98%), often arriving from nearby Charlotte, typically belonging to the Post-2000s (Gen Z/Alpha) group (50%), primarily speaking English or Spanish.
- Domestic travelers account for 98.2% of guests.
- Key international markets include United States (98.2%) and United Kingdom (0.3%).
- Top languages spoken are English (78.8%) followed by Spanish (9.9%).
- A significant demographic segment is the Post-2000s (Gen Z/Alpha) group, representing 50% of guests.
Recommendations for Hosts
- Target domestic marketing efforts towards travelers from Charlotte and Atlanta.
- Tailor amenities and listing descriptions to appeal to the dominant Post-2000s (Gen Z/Alpha) demographic (e.g., highlight fast WiFi, smart home features, local guides).
- Highlight unique local experiences or amenities relevant to the primary guest profile.
- Consider seasonal promotions aligned with peak travel times for key origin markets.
Nearby Short-Term Rental Market Comparison
How does the Maggie Valley Airbnb market stack up against its neighbors? Compare key performance metrics like average monthly revenue, ADR, and occupancy rates in surrounding areas to understand the broader regional STR landscape.
| Market | Active Properties | Monthly Revenue | Daily Rate | Avg. Occupancy |
|---|---|---|---|---|
| Sevier County | 68 | $7,108 | $567.95 | 44% |
| Gilmer County | 26 | $5,298 | $459.59 | 40% |
| Union Mills | 15 | $4,938 | $442.76 | 41% |
| Sevierville | 6,269 | $4,747 | $370.20 | 46% |
| Fannin County | 42 | $4,574 | $435.93 | 38% |
| East Ellijay | 15 | $4,415 | $368.05 | 41% |
| Epworth | 79 | $4,411 | $406.97 | 40% |
| Six Mile | 57 | $4,396 | $449.78 | 42% |
| Gatlinburg | 3,565 | $4,385 | $353.70 | 45% |
| Commerce | 19 | $4,298 | $285.34 | 45% |