Kings Landing Airbnb Market Analysis 2025: Short Term Rental Data & Vacation Rental Statistics in North Carolina, United States
Is Airbnb profitable in Kings Landing in 2025? Explore comprehensive Airbnb analytics for Kings Landing, North Carolina, United States to uncover income potential. This 2025 STR market report for Kings Landing, based on AirROI data from August 2024 to July 2025, reveals key trends in the niche market of 19 active listings.
Whether you're considering an Airbnb investment in Kings Landing, optimizing your existing vacation rental, or exploring rental arbitrage opportunities, understanding the Kings Landing Airbnb data is crucial. Leveraging the low regulation environment is key to maximizing your short term rental income potential. Let's dive into the specifics.
Key Kings Landing Airbnb Performance Metrics Overview
Monthly Airbnb Revenue Variations & Income Potential in Kings Landing (2025)
Understanding the monthly revenue variations for Airbnb listings in Kings Landing is key to maximizing your short term rental income potential. Seasonality significantly impacts earnings. Our analysis, based on data from the past 12 months, shows that the peak revenue month for STRs in Kings Landing is typically July, while February often presents the lowest earnings, highlighting opportunities for strategic pricing adjustments during shoulder and low seasons. Explore the typical Airbnb income in Kings Landing across different performance tiers:
- Best-in-class properties (Top 10%) achieve $3,509+ monthly, often utilizing dynamic pricing and superior guest experiences.
- Strong performing properties (Top 25%) earn $2,633 or more, indicating effective management and desirable locations/amenities.
- Typical properties (Median) generate around $1,833 per month, representing the average market performance.
- Entry-level properties (Bottom 25%) see earnings around $1,090, often with potential for optimization.
Average Monthly Airbnb Earnings Trend in Kings Landing
Kings Landing Airbnb Occupancy Rate Trends (2025)
Maximize your bookings by understanding the Kings Landing STR occupancy trends. Seasonal demand shifts significantly influence how often properties are booked. Typically, Julysees the highest demand (peak season occupancy), while January experiences the lowest (low season). Effective strategies, like adjusting minimum stays or offering promotions, can boost occupancy during slower periods. Here's how different property tiers perform in Kings Landing:
- Best-in-class properties (Top 10%) achieve 74%+ occupancy, indicating high desirability and potentially optimized availability.
- Strong performing properties (Top 25%) maintain 58% or higher occupancy, suggesting good market fit and guest satisfaction.
- Typical properties (Median) have an occupancy rate around 38%.
- Entry-level properties (Bottom 25%) average 21% occupancy, potentially facing higher vacancy.
Average Monthly Occupancy Rate Trend in Kings Landing
Average Daily Rate (ADR) Airbnb Trends in Kings Landing (2025)
Effective short term rental pricing strategy in Kings Landing involves understanding monthly ADR fluctuations. The Average Daily Rate (ADR) for Airbnb in Kings Landing typically peaks in June and dips lowest during February. Leveraging Airbnb dynamic pricing tools or strategies based on this seasonality can significantly boost revenue. Here's a look at the typical nightly rates achieved:
- Best-in-class properties (Top 10%) command rates of $229+ per night, often due to premium features or locations.
- Strong performing properties (Top 25%) achieve nightly rates of $164 or more.
- Typical properties (Median) charge around $130 per night.
- Entry-level properties (Bottom 25%) earn around $105 per night.
Average Daily Rate (ADR) Trend by Month in Kings Landing
Get Live Kings Landing Market Intelligence 👇

Explore Real-time Analytics
Airbnb Seasonality Analysis & Trends in Kings Landing (2025)
Peak Season (July, June, May)
- Revenue averages $3,022 per month
- Occupancy rates average 51.3%
- Daily rates average $174
Shoulder Season
- Revenue averages $2,031 per month
- Occupancy maintains around 43.4%
- Daily rates hold near $145
Low Season (January, February, November)
- Revenue drops to average $1,122 per month
- Occupancy decreases to average 29.3%
- Daily rates adjust to average $131
Seasonality Insights for Kings Landing
- The Airbnb seasonality in Kings Landing shows highly seasonal trends requiring careful strategy. While the sections above show seasonal averages, it's also insightful to look at the extremes:
- During the high season, the absolute peak month showcases Kings Landing's highest earning potential, with monthly revenues capable of climbing to $3,441, occupancy reaching a high of 58.9%, and ADRs peaking at $183.
- Conversely, the slowest single month of the year, typically falling within the low season, marks the market's lowest point. In this month, revenue might dip to $760, occupancy could drop to 23.4%, and ADRs may adjust down to $127.
- Understanding both the seasonal averages and these monthly peaks and troughs in revenue, occupancy, and ADR is crucial for maximizing your Airbnb profit potential in Kings Landing.
Seasonal Strategies for Maximizing Profit
- Peak Season: Maximize revenue through premium pricing and potentially longer minimum stays. Ensure high availability.
- Low Season: Offer competitive pricing, special promotions (e.g., extended stay discounts), and flexible cancellation policies. Target off-season travelers like remote workers or budget-conscious guests.
- Shoulder Seasons: Implement dynamic pricing that balances peak and low rates. Target weekend travelers or specific events. Offer slightly more flexible terms than peak season.
- Regularly analyze your own performance against these Kings Landing seasonality benchmarks and adjust your pricing and availability strategy accordingly.
Best Areas for Airbnb Investment in Kings Landing (2025)
Exploring the top neighborhoods for short-term rentals in Kings Landing? This section highlights key areas, outlining why they are attractive for hosts and guests, along with notable local attractions. Consider these locations based on your target guest profile and investment strategy.
| Neighborhood / Area | Why Host Here? (Target Guests & Appeal) | Key Attractions & Landmarks |
|---|---|---|
| Downtown Wilmington | A vibrant area with a strong arts scene, historic architecture, and proximity to the riverfront. Popular among tourists and business travelers looking for entertainment and dining options. | Battleship North Carolina, Wilmington Riverwalk, Thalian Hall, Bellamy Mansion, Front Street Brewery |
| Carolina Beach | Known for its beautiful sandy beaches and family-friendly atmosphere. Ideal for those seeking a beach vacation with plenty of outdoor activities. | Carolina Beach Boardwalk, Kure Beach, Fort Fisher State Recreation Area, Carolina Beach State Park, North Carolina Aquarium at Fort Fisher |
| Wrightsville Beach | A prime beach destination known for its crystal-clear waters and excellent surfing conditions. Attracts both tourists and locals looking for beach activities. | Wrightsville Beach, Johnnie Mercer's Pier, Wrightsville Beach Museum, Shell Island |
| Southport | A charming coastal town known for its quaint shops and scenic waterfront. Popular for those looking for a relaxed, small-town atmosphere near the beach. | Southport Waterfront Park, Old Brunswick County Jail, Fort Johnson, Southport Marina |
| Oak Island | Famous for its beautiful beaches and family-friendly environment. Great for vacationers looking for a quiet beach retreat. | Oak Island Beach, Odyssey Marine Exploration, Oak Island Lighthouse |
| Leland | A rapidly growing area near Wilmington, offering access to nature parks and shopping. Ideal for those seeking a suburban vibe with urban conveniences. | Leland Community Park, Cape Fear National, Leland Cultural Arts Center |
| Kure Beach | A quieter beach town with a laid-back atmosphere, attracting families and nature enthusiasts. Ideal for beach lovers. | Kure Beach Pier, Fort Fisher State Recreation Area, North Carolina Aquarium at Fort Fisher |
| Topsail Beach | Known for its stunning beaches and peaceful environment, Topsail Beach attracts vacationers looking for a serene getaway. | Topsail Beach, Missiles and More Museum, Surf City Pier |
Understanding Airbnb License Requirements & STR Laws in Kings Landing (2025)
While Kings Landing, North Carolina, United States currently shows low STR regulations, specific Airbnb license requirements might still exist or change. Always verify the latest short term rental regulations and Airbnb license requirements directly with local government authorities for Kings Landing to ensure full compliance before hosting.
(Source: AirROI data, 2025, finding no licensed listings among those analyzed)
Top Performing Airbnb Properties in Kings Landing (2025)
Benchmark your potential! Explore examples of top-performing Airbnb properties in Kings Landingbased on Trailing Twelve Month (TTM) revenue. Analyze their characteristics, revenue, occupancy rate, and ADR to understand what drives success in this market.
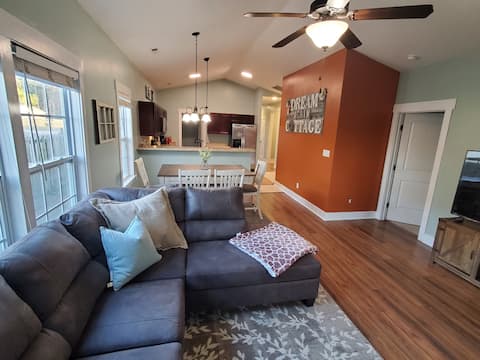
Dream Again Cottage • Golfers Paradise
Entire Place • 4 bedrooms

Welcome to Casa de la Palma! Beach, Golf & More!
Entire Place • 2 bedrooms
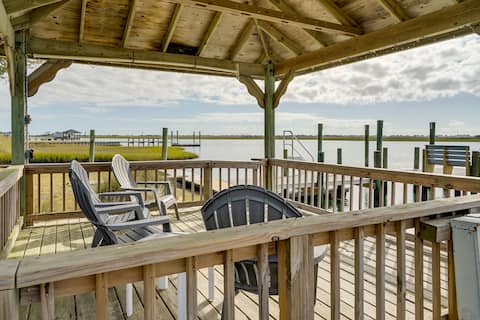
Waterfront Hampstead Home: Dock & Waterway Access!
Entire Place • 3 bedrooms
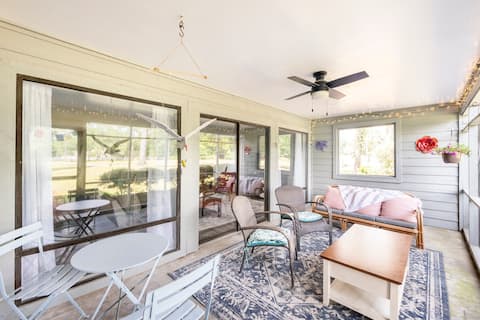
Magical Little Hampstead Home
Entire Place • 2 bedrooms

Cozy and Close to 2 Beaches
Entire Place • 2 bedrooms

Isle Be Back
Entire Place • 2 bedrooms
Note: Performance varies based on location, size, amenities, seasonality, and management quality. Data reflects the past 12 months.
Top Performing Airbnb Hosts in Kings Landing (2025)
Learn from the best! This table showcases top-performing Airbnb hosts in Kings Landing based on the number of properties managed and estimated total revenue over the past year. Analyze their scale and performance metrics.
| Host Name | Properties | Grossing Revenue | Stay Reviews | Avg Rating |
|---|---|---|---|---|
| Marla | 1 | $44,079 | 37 | 4.86/5.0 |
| Glenn | 1 | $39,944 | 85 | 4.87/5.0 |
| Evolve | 1 | $32,891 | 14 | 5.00/5.0 |
| Cameron | 1 | $26,082 | 64 | 4.94/5.0 |
| Austin | 1 | $25,598 | 20 | 4.90/5.0 |
| Jennifer | 1 | $24,854 | 85 | 4.98/5.0 |
| Gwendolyn | 1 | $23,452 | 746 | 4.94/5.0 |
| Anthony | 1 | $22,569 | 22 | 5.00/5.0 |
| Ross | 1 | $17,862 | 30 | 4.97/5.0 |
| Charles | 1 | $16,761 | 145 | 4.99/5.0 |
Analyzing the strategies of top hosts, such as their property selection, pricing, and guest communication, can offer valuable lessons for optimizing your own Airbnb operations in Kings Landing.
Dive Deeper: Advanced Kings Landing STR Market Data (2025)
Ready to unlock more insights? AirROI provides access to advanced metrics and comprehensive Airbnb data for Kings Landing. Explore detailed analytics beyond this report to refine your investment strategy, optimize pricing, and maximize your vacation rental profits.
Explore Advanced MetricsKings Landing Short-Term Rental Market Composition (2025): Property & Room Types
Room Type Distribution
Property Type Distribution
Market Composition Insights for Kings Landing
- The Kings Landing Airbnb market composition is heavily skewed towards Entire Home/Apt listings, which make up 68.4% of the 19 active rentals. This indicates strong guest preference for privacy and space.
- However, a notable 31.6% share for Private Rooms suggests opportunities for budget-conscious travelers or hosts renting out spare rooms.
- Looking at the property type distribution in Kings Landing, House properties are the most common (68.4%), reflecting the local real estate landscape.
- Houses represent a significant 68.4% portion, catering likely to families or larger groups.
- The presence of 10.5% Hotel/Boutique listings indicates integration with traditional hospitality.
Kings Landing Airbnb Room Capacity Analysis (2025): Bedroom Distribution
Distribution of Listings by Number of Bedrooms
Room Capacity Insights for Kings Landing
- The dominant room capacity in Kings Landing is 2 bedrooms listings, making up 36.8% of the market. This suggests a strong demand for properties suitable for couples or solo travelers.
- Together, 2 bedrooms and 3 bedrooms properties represent 57.9% of the active Airbnb listings in Kings Landing, indicating a high concentration in these sizes.
- A significant 26.4% of listings offer 3+ bedrooms, catering to larger groups and families seeking more space in Kings Landing.
Kings Landing Vacation Rental Guest Capacity Trends (2025)
Distribution of Listings by Guest Capacity
Guest Capacity Insights for Kings Landing
- The most common guest capacity trend in Kings Landing vacation rentals is listings accommodating 4 guests (26.3%). This suggests the primary traveler segment is likely small families or groups.
- Properties designed for 4 guests and 6 guests dominate the Kings Landing STR market, accounting for 47.4% of listings.
- 36.9% of properties accommodate 6+ guests, serving the market segment for larger families or group travel in Kings Landing.
- On average, properties in Kings Landing are equipped to host 3.7 guests.
Kings Landing Airbnb Booking Patterns (2025): Available vs. Booked Days
Available Days Distribution
Booked Days Distribution
Booking Pattern Insights for Kings Landing
- The most common availability pattern in Kings Landing falls within the 271-366 days range, representing 57.9% of listings. This suggests many properties have significant open periods on their calendars.
- Approximately 79.0% of listings show high availability (181+ days open annually), indicating potential for increased bookings or specific owner usage patterns.
- For booked days, the 31-90 days range is most frequent in Kings Landing (31.6%), reflecting common guest stay durations or potential owner blocking patterns.
- A notable 21.1% of properties secure long booking periods (181+ days booked per year), highlighting successful long-term rental strategies or significant owner usage.
Kings Landing Airbnb Minimum Stay Requirements Analysis
Distribution of Listings by Minimum Night Requirement
1 Night
8 listings
42.1% of total
2 Nights
5 listings
26.3% of total
3 Nights
1 listings
5.3% of total
7-29 Nights
2 listings
10.5% of total
30+ Nights
3 listings
15.8% of total
Key Insights
- The most prevalent minimum stay requirement in Kings Landing is 1 Night, adopted by 42.1% of listings. This highlights the market's preference for shorter, flexible bookings.
- A strong majority (68.4%) of the Kings Landing Airbnb data shows acceptance of very short stays (1-2 nights), indicating a dynamic, high-turnover market.
- A significant segment (15.8%) caters to monthly stays (30+ nights) in Kings Landing, pointing to opportunities in the extended-stay market.
Recommendations
- Align with the market by considering a 1 Night minimum stay, as 42.1% of Kings Landing hosts use this setting.
- Explore offering discounts for stays of 30+ nights to attract the 15.8% of the market seeking extended stays.
- Adjust minimum nights based on seasonality – potentially shorter during low season and longer during peak demand periods in Kings Landing.
Kings Landing Airbnb Cancellation Policy Trends Analysis (2025)
Flexible
2 listings
10.5% of total
Moderate
9 listings
47.4% of total
Firm
3 listings
15.8% of total
Strict
5 listings
26.3% of total
Cancellation Policy Insights for Kings Landing
- The prevailing Airbnb cancellation policy trend in Kings Landing is Moderate, used by 47.4% of listings.
- There's a relatively balanced mix between guest-friendly (57.9%) and stricter (42.1%) policies, offering choices for different guest needs.
Recommendations for Hosts
- Consider adopting a Moderate policy to align with the 47.4% market standard in Kings Landing.
- Regularly review your cancellation policy against competitors and market demand shifts in Kings Landing.
Kings Landing STR Booking Lead Time Analysis (2025)
Average Booking Lead Time by Month
Booking Lead Time Insights for Kings Landing
- The overall average booking lead time for vacation rentals in Kings Landing is 28 days.
- Guests book furthest in advance for stays during May (average 53 days), likely coinciding with peak travel demand or local events.
- The shortest booking windows occur for stays in January (average 13 days), indicating more last-minute travel plans during this time.
- Seasonally, Fall (37 days avg.) sees the longest lead times, while Winter (26 days avg.) has the shortest, reflecting typical travel planning cycles.
Recommendations for Hosts
- Use the overall average lead time (28 days) as a baseline for your pricing and availability strategy in Kings Landing.
- For May stays, consider implementing length-of-stay discounts or slightly higher rates for bookings made less than 53 days out to capitalize on advance planning.
- During January, focus on last-minute booking availability and promotions, as guests book with very short notice (13 days avg.).
- Target marketing efforts for the Fall season well in advance (at least 37 days) to capture early planners.
- Monitor your own booking lead times against these Kings Landing averages to identify opportunities for dynamic pricing adjustments.
Popular & Essential Airbnb Amenities in Kings Landing (2025)
Amenity Prevalence
Amenity Insights for Kings Landing
- Essential amenities in Kings Landing that guests expect include: Coffee maker, Heating, Air conditioning, Hot water, Smoke alarm, Free parking on premises, Wifi. Lacking these (any) could significantly impact bookings.
- Popular amenities like Refrigerator, Hangers, Fire extinguisher are common but not universal. Offering these can provide a competitive edge.
Recommendations for Hosts
- Ensure your listing includes all essential amenities for Kings Landing: Coffee maker, Heating, Air conditioning, Hot water, Smoke alarm, Free parking on premises, Wifi.
- Consider adding popular differentiators like Refrigerator or Hangers to increase appeal.
- Highlight unique or less common amenities you offer (e.g., hot tub, dedicated workspace, EV charger) in your listing description and photos.
- Regularly check competitor amenities in Kings Landing to stay competitive.
Kings Landing Airbnb Guest Demographics & Profile Analysis (2025)
Guest Profile Summary for Kings Landing
- The typical guest profile for Airbnb in Kings Landing consists of primarily domestic travelers (97%), often arriving from nearby Raleigh, typically belonging to the Post-2000s (Gen Z/Alpha) group (50%), primarily speaking English or Spanish.
- Domestic travelers account for 97.3% of guests.
- Key international markets include United States (97.3%) and Germany (1.1%).
- Top languages spoken are English (72.2%) followed by Spanish (14.8%).
- A significant demographic segment is the Post-2000s (Gen Z/Alpha) group, representing 50% of guests.
Recommendations for Hosts
- Target domestic marketing efforts towards travelers from Raleigh and Charlotte.
- Tailor amenities and listing descriptions to appeal to the dominant Post-2000s (Gen Z/Alpha) demographic (e.g., highlight fast WiFi, smart home features, local guides).
- Highlight unique local experiences or amenities relevant to the primary guest profile.
- Consider seasonal promotions aligned with peak travel times for key origin markets.
Nearby Short-Term Rental Market Comparison
How does the Kings Landing Airbnb market stack up against its neighbors? Compare key performance metrics like average monthly revenue, ADR, and occupancy rates in surrounding areas to understand the broader regional STR landscape.
| Market | Active Properties | Monthly Revenue | Daily Rate | Avg. Occupancy |
|---|---|---|---|---|
| Ocean Isle Beach | 461 | $4,761 | $620.04 | 37% |
| Wrightsville Beach | 477 | $4,213 | $513.67 | 37% |
| Bald Head Island | 197 | $3,746 | $556.93 | 34% |
| Cedar Point | 26 | $3,656 | $278.70 | 51% |
| Emerald Isle | 463 | $3,389 | $356.40 | 41% |
| Kure Beach | 484 | $3,246 | $390.60 | 39% |
| Surf City | 678 | $3,171 | $342.96 | 39% |
| Salter Path | 19 | $3,141 | $283.60 | 48% |
| Caswell Beach | 46 | $3,140 | $407.84 | 36% |
| North Topsail Beach | 859 | $3,127 | $379.18 | 38% |