Kannapolis Airbnb Market Analysis 2026: Short Term Rental Data & Vacation Rental Statistics in North Carolina, United States
Is Airbnb profitable in Kannapolis in 2026? Explore comprehensive Airbnb analytics for Kannapolis, North Carolina, United States to uncover income potential. This 2026 STR market report for Kannapolis, based on AirROI data from February 2025 to January 2026, reveals key trends in the niche market of 78 active listings.
Whether you're considering an Airbnb investment in Kannapolis, optimizing your existing vacation rental, or exploring rental arbitrage opportunities, understanding the Kannapolis Airbnb data is crucial. Leveraging the low regulation environment is key to maximizing your short term rental income potential. Let's dive into the specifics.
Key Kannapolis Airbnb Performance Metrics Overview
Monthly Airbnb Revenue Variations & Income Potential in Kannapolis (2026)
Understanding the monthly revenue variations for Airbnb listings in Kannapolis is key to maximizing your short term rental income potential. Seasonality significantly impacts earnings. Our analysis, based on data from the past 12 months, shows that the peak revenue month for STRs in Kannapolis is typically October, while January often presents the lowest earnings, highlighting opportunities for strategic pricing adjustments during shoulder and low seasons. Explore the typical Airbnb income in Kannapolis across different performance tiers:
- Best-in-class properties (Top 10%) achieve $4,440+ monthly, often utilizing dynamic pricing and superior guest experiences.
- Strong performing properties (Top 25%) earn $3,181 or more, indicating effective management and desirable locations/amenities.
- Typical properties (Median) generate around $2,076 per month, representing the average market performance.
- Entry-level properties (Bottom 25%) see earnings around $1,355, often with potential for optimization.
Average Monthly Airbnb Earnings Trend in Kannapolis
Kannapolis Airbnb Occupancy Rate Trends (2026)
Maximize your bookings by understanding the Kannapolis STR occupancy trends. Seasonal demand shifts significantly influence how often properties are booked. Typically, Junesees the highest demand (peak season occupancy), while January experiences the lowest (low season). Effective strategies, like adjusting minimum stays or offering promotions, can boost occupancy during slower periods. Here's how different property tiers perform in Kannapolis:
- Best-in-class properties (Top 10%) achieve 80%+ occupancy, indicating high desirability and potentially optimized availability.
- Strong performing properties (Top 25%) maintain 65% or higher occupancy, suggesting good market fit and guest satisfaction.
- Typical properties (Median) have an occupancy rate around 48%.
- Entry-level properties (Bottom 25%) average 29% occupancy, potentially facing higher vacancy.
Average Monthly Occupancy Rate Trend in Kannapolis
Average Daily Rate (ADR) Airbnb Trends in Kannapolis (2026)
Effective short term rental pricing strategy in Kannapolis involves understanding monthly ADR fluctuations. The Average Daily Rate (ADR) for Airbnb in Kannapolis typically peaks in October and dips lowest during March. Leveraging Airbnb dynamic pricing tools or strategies based on this seasonality can significantly boost revenue. Here's a look at the typical nightly rates achieved:
- Best-in-class properties (Top 10%) command rates of $261+ per night, often due to premium features or locations.
- Strong performing properties (Top 25%) achieve nightly rates of $189 or more.
- Typical properties (Median) charge around $141 per night.
- Entry-level properties (Bottom 25%) earn around $112 per night.
Average Daily Rate (ADR) Trend by Month in Kannapolis
Get Live Kannapolis Market Intelligence 👇

Explore Real-time Analytics
Airbnb Seasonality Analysis & Trends in Kannapolis (2026)
Peak Season (October, September, June)
- Revenue averages $2,861 per month
- Occupancy rates average 51.7%
- Daily rates average $172
Shoulder Season
- Revenue averages $2,565 per month
- Occupancy maintains around 48.8%
- Daily rates hold near $163
Low Season (January, February, April)
- Revenue drops to average $1,931 per month
- Occupancy decreases to average 43.0%
- Daily rates adjust to average $152
Seasonality Insights for Kannapolis
- The Airbnb seasonality in Kannapolis shows moderate seasonality with distinct peak and low periods. While the sections above show seasonal averages, it's also insightful to look at the extremes:
- During the high season, the absolute peak month showcases Kannapolis's highest earning potential, with monthly revenues capable of climbing to $2,889, occupancy reaching a high of 57.5%, and ADRs peaking at $188.
- Conversely, the slowest single month of the year, typically falling within the low season, marks the market's lowest point. In this month, revenue might dip to $1,644, occupancy could drop to 29.7%, and ADRs may adjust down to $141.
- Understanding both the seasonal averages and these monthly peaks and troughs in revenue, occupancy, and ADR is crucial for maximizing your Airbnb profit potential in Kannapolis.
Seasonal Strategies for Maximizing Profit
- Peak Season: Maximize revenue through premium pricing and potentially longer minimum stays. Ensure high availability.
- Low Season: Offer competitive pricing, special promotions (e.g., extended stay discounts), and flexible cancellation policies. Target off-season travelers like remote workers or budget-conscious guests.
- Shoulder Seasons: Implement dynamic pricing that balances peak and low rates. Target weekend travelers or specific events. Offer slightly more flexible terms than peak season.
- Regularly analyze your own performance against these Kannapolis seasonality benchmarks and adjust your pricing and availability strategy accordingly.
Best Areas for Airbnb Investment in Kannapolis (2026)
Exploring the top neighborhoods for short-term rentals in Kannapolis? This section highlights key areas, outlining why they are attractive for hosts and guests, along with notable local attractions. Consider these locations based on your target guest profile and investment strategy.
| Neighborhood / Area | Why Host Here? (Target Guests & Appeal) | Key Attractions & Landmarks |
|---|---|---|
| Downtown Kannapolis | The heart of Kannapolis with easy access to shops, restaurants, and events. Ideal for guests who want to experience the local culture and community. | Kannapolis City Hall, Caboose Park, The Gem Theatre, Village Park, Carolinas Healthcare System |
| North Carolina Research Campus | This area attracts professionals and academics, making it ideal for short-term rentals for visitors to the research facilities and nearby attractions. | North Carolina Research Campus, Cabarrus Arena, Kannapolis Intimidators Stadium |
| Cannon Village | A charming, historic area with a mix of shops and eateries. Popular with families and visitors looking for a quaint stay. | Cannon Village shops, Cannon Memorial YMCA, local art shows |
| Lake Fisher | A serene location for those who enjoy outdoor activities. Suitable for nature lovers and families looking for a peaceful retreat. | Lake Fisher Park, kayaking and fishing, walking trails |
| Kannapolis Sports Complex | Attracts sports enthusiasts and families attending games and events, perfect for short-term stays during busy seasons. | Kannapolis Sports Complex, Local Baseball games, Community events |
| Historic Downtown | Rich in history with preservation of old architecture. Provides a unique stay experience for history buffs and tourists. | Historic homes, Local museums, Historical walking tours |
| Nearby Concord | Just a short drive away, Concord offers shopping and entertainment options, appealing for guests looking for a variety of attractions nearby. | Concord Mills, Carowinds Amusement Park, Charlotte Motor Speedway |
| Cabarrus County Fairgrounds | A hub for various events throughout the year, making it attractive for visitors looking to attend fairs, festivals, and exhibitions. | Cabarrus County Fair, Exhibitions and local events, Food festivals |
Understanding Airbnb License Requirements & STR Laws in Kannapolis (2026)
While Kannapolis, North Carolina, United States currently shows low STR regulations, specific Airbnb license requirements might still exist or change. Always verify the latest short term rental regulations and Airbnb license requirements directly with local government authorities for Kannapolis to ensure full compliance before hosting.
(Source: AirROI data, 2026, finding no licensed listings among those analyzed)
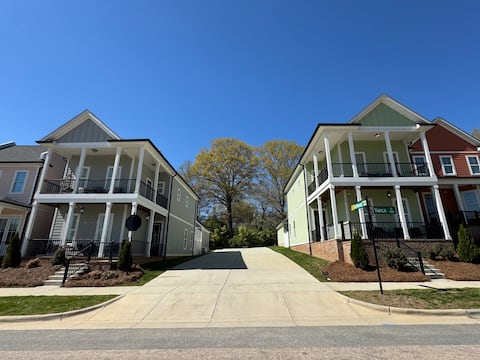
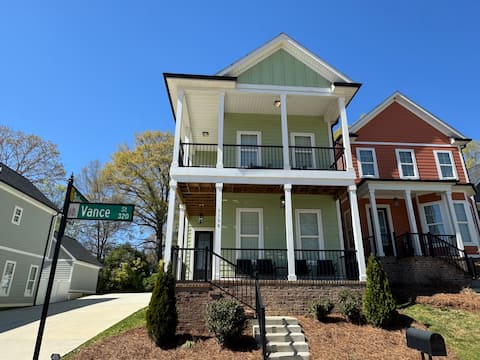
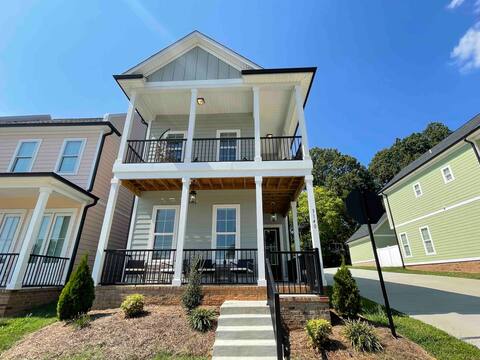
Top Performing Airbnb Properties in Kannapolis (2026)
Benchmark your potential! Explore examples of top-performing Airbnb properties in Kannapolisbased on Trailing Twelve Month (TTM) revenue. Analyze their characteristics, revenue, occupancy rate, and ADR to understand what drives success in this market.
Mill Ridge Estate ~Sleeps 17~ Steps From Downtown
Entire Place • 6 bedrooms
The Sage~Steps to DT Kannapolis, Ballpark & Dining
Entire Place • 3 bedrooms

Cozy 2b/2b Spa 2 Steam Saunas Home Theater Gym
Entire Place • 2 bedrooms
The Gray~Steps to DT Kannapolis Ballpark & Dining
Entire Place • 3 bedrooms

University Mill House- Relax & Explore/King Bed
Entire Place • 2 bedrooms

Betty The Bungalow ~ 1.5mi to DT Ktown
Entire Place • 3 bedrooms
Note: Performance varies based on location, size, amenities, seasonality, and management quality. Data reflects the past 12 months.
Top Performing Airbnb Hosts in Kannapolis (2026)
Learn from the best! This table showcases top-performing Airbnb hosts in Kannapolis based on the number of properties managed and estimated total revenue over the past year. Analyze their scale and performance metrics.
| Host Name | Properties | Grossing Revenue | Stay Reviews | Avg Rating |
|---|---|---|---|---|
| Hunter | 3 | $193,094 | 235 | 4.99/5.0 |
| Jeremy | 4 | $100,754 | 562 | 4.80/5.0 |
| David | 3 | $71,475 | 132 | 4.85/5.0 |
| Darryl | 2 | $67,322 | 431 | 4.94/5.0 |
| Kirschan | 1 | $61,777 | 232 | 4.81/5.0 |
| Lan | 2 | $59,565 | 116 | 4.81/5.0 |
| Kimberly | 2 | $59,174 | 52 | 4.53/5.0 |
| Michelle | 3 | $58,304 | 67 | 4.88/5.0 |
| Stephenie | 3 | $51,723 | 283 | 4.66/5.0 |
| Jeffrey | 2 | $50,242 | 204 | 4.91/5.0 |
Analyzing the strategies of top hosts, such as their property selection, pricing, and guest communication, can offer valuable lessons for optimizing your own Airbnb operations in Kannapolis.
Dive Deeper: Advanced Kannapolis STR Market Data (2026)
Ready to unlock more insights? AirROI provides access to advanced metrics and comprehensive Airbnb data for Kannapolis. Explore detailed analytics beyond this report to refine your investment strategy, optimize pricing, and maximize your vacation rental profits.
Explore Advanced MetricsKannapolis Short-Term Rental Market Composition (2026): Property & Room Types
Room Type Distribution
Property Type Distribution
Market Composition Insights for Kannapolis
- The Kannapolis Airbnb market composition is heavily skewed towards Entire Home/Apt listings, which make up 96.2% of the 78 active rentals. This indicates strong guest preference for privacy and space.
- Looking at the property type distribution in Kannapolis, House properties are the most common (79.5%), reflecting the local real estate landscape.
- Houses represent a significant 79.5% portion, catering likely to families or larger groups.
- Smaller segments like unique stays, hotel/boutique, outdoor/unique (combined 3.9%) offer potential for unique stay experiences.
Kannapolis Airbnb Room Capacity Analysis (2026): Bedroom Distribution
Distribution of Listings by Number of Bedrooms
Room Capacity Insights for Kannapolis
- The dominant room capacity in Kannapolis is 2 bedrooms listings, making up 38.5% of the market. This suggests a strong demand for properties suitable for couples or solo travelers.
- Together, 2 bedrooms and 3 bedrooms properties represent 71.8% of the active Airbnb listings in Kannapolis, indicating a high concentration in these sizes.
- A significant 42.2% of listings offer 3+ bedrooms, catering to larger groups and families seeking more space in Kannapolis.
Kannapolis Vacation Rental Guest Capacity Trends (2026)
Distribution of Listings by Guest Capacity
Guest Capacity Insights for Kannapolis
- The most common guest capacity trend in Kannapolis vacation rentals is listings accommodating 6 guests (25.6%). This suggests the primary traveler segment is likely larger groups.
- Properties designed for 6 guests and 4 guests dominate the Kannapolis STR market, accounting for 48.7% of listings.
- 51.2% of properties accommodate 6+ guests, serving the market segment for larger families or group travel in Kannapolis.
- On average, properties in Kannapolis are equipped to host 5.2 guests.
Kannapolis Airbnb Booking Patterns (2026): Available vs. Booked Days
Available Days Distribution
Booked Days Distribution
Booking Pattern Insights for Kannapolis
- The most common availability pattern in Kannapolis falls within the 181-270 days range, representing 38.5% of listings. This suggests many properties have significant open periods on their calendars.
- Approximately 66.7% of listings show high availability (181+ days open annually), indicating potential for increased bookings or specific owner usage patterns.
- For booked days, the 91-180 days range is most frequent in Kannapolis (38.5%), reflecting common guest stay durations or potential owner blocking patterns.
- A notable 35.9% of properties secure long booking periods (181+ days booked per year), highlighting successful long-term rental strategies or significant owner usage.
Kannapolis Airbnb Minimum Stay Requirements Analysis
Distribution of Listings by Minimum Night Requirement
1 Night
27 listings
34.6% of total
2 Nights
21 listings
26.9% of total
3 Nights
5 listings
6.4% of total
4-6 Nights
2 listings
2.6% of total
7-29 Nights
7 listings
9% of total
30+ Nights
16 listings
20.5% of total
Key Insights
- The most prevalent minimum stay requirement in Kannapolis is 1 Night, adopted by 34.6% of listings. This highlights the market's preference for shorter, flexible bookings.
- A strong majority (61.5%) of the Kannapolis Airbnb data shows acceptance of very short stays (1-2 nights), indicating a dynamic, high-turnover market.
- A significant segment (20.5%) caters to monthly stays (30+ nights) in Kannapolis, pointing to opportunities in the extended-stay market.
Recommendations
- Align with the market by considering a 1 Night minimum stay, as 34.6% of Kannapolis hosts use this setting.
- Explore offering discounts for stays of 30+ nights to attract the 20.5% of the market seeking extended stays.
- Adjust minimum nights based on seasonality – potentially shorter during low season and longer during peak demand periods in Kannapolis.
Kannapolis Airbnb Cancellation Policy Trends Analysis (2026)
Limited
3 listings
3.8% of total
Flexible
39 listings
50% of total
Moderate
18 listings
23.1% of total
Firm
12 listings
15.4% of total
Strict
6 listings
7.7% of total
Cancellation Policy Insights for Kannapolis
- The prevailing Airbnb cancellation policy trend in Kannapolis is Flexible, used by 50% of listings.
- The market strongly favors guest-friendly terms, with 73.1% of listings offering Flexible or Moderate policies. This suggests guests in Kannapolis may expect booking flexibility.
- Strict cancellation policies are quite rare (7.7%), potentially making listings with this policy less competitive unless justified by high demand or property type.
Recommendations for Hosts
- Consider adopting a Flexible policy to align with the 50% market standard in Kannapolis.
- Using a Strict policy might deter some guests, as only 7.7% of listings use it. Evaluate if potential revenue protection outweighs possible lower booking rates.
- Regularly review your cancellation policy against competitors and market demand shifts in Kannapolis.
Kannapolis STR Booking Lead Time Analysis (2026)
Average Booking Lead Time by Month
Booking Lead Time Insights for Kannapolis
- The overall average booking lead time for vacation rentals in Kannapolis is 32 days.
- Guests book furthest in advance for stays during November (average 52 days), likely coinciding with peak travel demand or local events.
- The shortest booking windows occur for stays in February (average 21 days), indicating more last-minute travel plans during this time.
- Seasonally, Fall (43 days avg.) sees the longest lead times, while Summer (27 days avg.) has the shortest, reflecting typical travel planning cycles.
Recommendations for Hosts
- Use the overall average lead time (32 days) as a baseline for your pricing and availability strategy in Kannapolis.
- For November stays, consider implementing length-of-stay discounts or slightly higher rates for bookings made less than 52 days out to capitalize on advance planning.
- Target marketing efforts for the Fall season well in advance (at least 43 days) to capture early planners.
- Monitor your own booking lead times against these Kannapolis averages to identify opportunities for dynamic pricing adjustments.
Popular & Essential Airbnb Amenities in Kannapolis (2026)
Amenity Prevalence
Amenity Insights for Kannapolis
- Essential amenities in Kannapolis that guests expect include: Air conditioning, Smoke alarm, Wifi, Free parking on premises, Kitchen, TV, Heating. Lacking these (any) could significantly impact bookings.
- Popular amenities like Hot water, Refrigerator, Washer are common but not universal. Offering these can provide a competitive edge.
Recommendations for Hosts
- Ensure your listing includes all essential amenities for Kannapolis: Air conditioning, Smoke alarm, Wifi, Free parking on premises, Kitchen, TV, Heating.
- Prioritize adding missing essentials: Wifi, Free parking on premises, Kitchen, TV, Heating.
- Consider adding popular differentiators like Hot water or Refrigerator to increase appeal.
- Highlight unique or less common amenities you offer (e.g., hot tub, dedicated workspace, EV charger) in your listing description and photos.
- Regularly check competitor amenities in Kannapolis to stay competitive.
Kannapolis Airbnb Guest Demographics & Profile Analysis (2026)
Guest Profile Summary for Kannapolis
- The typical guest profile for Airbnb in Kannapolis consists of primarily domestic travelers (97%), often arriving from nearby Charlotte, typically belonging to the Post-2000s (Gen Z/Alpha) group (50%), primarily speaking English or Spanish.
- Domestic travelers account for 97.3% of guests.
- Key international markets include United States (97.3%) and DC (0.7%).
- Top languages spoken are English (78.6%) followed by Spanish (8.7%).
- A significant demographic segment is the Post-2000s (Gen Z/Alpha) group, representing 50% of guests.
Recommendations for Hosts
- Target domestic marketing efforts towards travelers from Charlotte and Raleigh.
- Tailor amenities and listing descriptions to appeal to the dominant Post-2000s (Gen Z/Alpha) demographic (e.g., highlight fast WiFi, smart home features, local guides).
- Highlight unique local experiences or amenities relevant to the primary guest profile.
- Consider seasonal promotions aligned with peak travel times for key origin markets.
Nearby Short-Term Rental Market Comparison
How does the Kannapolis Airbnb market stack up against its neighbors? Compare key performance metrics like average monthly revenue, ADR, and occupancy rates in surrounding areas to understand the broader regional STR landscape.
| Market | Active Properties | Monthly Revenue | Daily Rate | Avg. Occupancy |
|---|---|---|---|---|
| Denver | 109 | $6,309 | $590.96 | 45% |
| Catawba | 16 | $6,093 | $582.49 | 38% |
| Mooresville | 369 | $5,702 | $559.93 | 42% |
| Sherrills Ford | 107 | $5,615 | $547.26 | 41% |
| Troutman | 49 | $5,587 | $467.90 | 42% |
| Lake Norman of Catawba | 51 | $4,972 | $513.30 | 43% |
| Chapin | 93 | $3,971 | $386.37 | 43% |
| Semora | 50 | $3,408 | $377.45 | 38% |
| Watauga County | 47 | $3,370 | $314.71 | 39% |
| Nebo | 88 | $3,330 | $381.79 | 34% |