Holden Beach Airbnb Market Analysis 2026: Short Term Rental Data & Vacation Rental Statistics in North Carolina, United States
Is Airbnb profitable in Holden Beach in 2026? Explore comprehensive Airbnb analytics for Holden Beach, North Carolina, United States to uncover income potential. This 2026 STR market report for Holden Beach, based on AirROI data from February 2025 to January 2026, reveals key trends in the market of 297 active listings.
Whether you're considering an Airbnb investment in Holden Beach, optimizing your existing vacation rental, or exploring rental arbitrage opportunities, understanding the Holden Beach Airbnb data is crucial. Leveraging the low regulation environment is key to maximizing your short term rental income potential. Let's dive into the specifics.
Key Holden Beach Airbnb Performance Metrics Overview
Monthly Airbnb Revenue Variations & Income Potential in Holden Beach (2026)
Understanding the monthly revenue variations for Airbnb listings in Holden Beach is key to maximizing your short term rental income potential. Seasonality significantly impacts earnings. Our analysis, based on data from the past 12 months, shows that the peak revenue month for STRs in Holden Beach is typically July, while February often presents the lowest earnings, highlighting opportunities for strategic pricing adjustments during shoulder and low seasons. Explore the typical Airbnb income in Holden Beach across different performance tiers:
- Best-in-class properties (Top 10%) achieve $11,166+ monthly, often utilizing dynamic pricing and superior guest experiences.
- Strong performing properties (Top 25%) earn $6,768 or more, indicating effective management and desirable locations/amenities.
- Typical properties (Median) generate around $3,865 per month, representing the average market performance.
- Entry-level properties (Bottom 25%) see earnings around $1,925, often with potential for optimization.
Average Monthly Airbnb Earnings Trend in Holden Beach
Holden Beach Airbnb Occupancy Rate Trends (2026)
Maximize your bookings by understanding the Holden Beach STR occupancy trends. Seasonal demand shifts significantly influence how often properties are booked. Typically, Julysees the highest demand (peak season occupancy), while January experiences the lowest (low season). Effective strategies, like adjusting minimum stays or offering promotions, can boost occupancy during slower periods. Here's how different property tiers perform in Holden Beach:
- Best-in-class properties (Top 10%) achieve 70%+ occupancy, indicating high desirability and potentially optimized availability.
- Strong performing properties (Top 25%) maintain 52% or higher occupancy, suggesting good market fit and guest satisfaction.
- Typical properties (Median) have an occupancy rate around 31%.
- Entry-level properties (Bottom 25%) average 15% occupancy, potentially facing higher vacancy.
Average Monthly Occupancy Rate Trend in Holden Beach
Average Daily Rate (ADR) Airbnb Trends in Holden Beach (2026)
Effective short term rental pricing strategy in Holden Beach involves understanding monthly ADR fluctuations. The Average Daily Rate (ADR) for Airbnb in Holden Beach typically peaks in July and dips lowest during February. Leveraging Airbnb dynamic pricing tools or strategies based on this seasonality can significantly boost revenue. Here's a look at the typical nightly rates achieved:
- Best-in-class properties (Top 10%) command rates of $757+ per night, often due to premium features or locations.
- Strong performing properties (Top 25%) achieve nightly rates of $535 or more.
- Typical properties (Median) charge around $363 per night.
- Entry-level properties (Bottom 25%) earn around $267 per night.
Average Daily Rate (ADR) Trend by Month in Holden Beach
Get Live Holden Beach Market Intelligence 👇

Explore Real-time Analytics
Airbnb Seasonality Analysis & Trends in Holden Beach (2026)
Peak Season (July, June, August)
- Revenue averages $10,293 per month
- Occupancy rates average 53.1%
- Daily rates average $507
Shoulder Season
- Revenue averages $4,284 per month
- Occupancy maintains around 32.7%
- Daily rates hold near $444
Low Season (January, February, November)
- Revenue drops to average $2,597 per month
- Occupancy decreases to average 25.1%
- Daily rates adjust to average $432
Seasonality Insights for Holden Beach
- The Airbnb seasonality in Holden Beach shows highly seasonal trends requiring careful strategy. While the sections above show seasonal averages, it's also insightful to look at the extremes:
- During the high season, the absolute peak month showcases Holden Beach's highest earning potential, with monthly revenues capable of climbing to $12,110, occupancy reaching a high of 57.1%, and ADRs peaking at $509.
- Conversely, the slowest single month of the year, typically falling within the low season, marks the market's lowest point. In this month, revenue might dip to $2,307, occupancy could drop to 20.0%, and ADRs may adjust down to $395.
- Understanding both the seasonal averages and these monthly peaks and troughs in revenue, occupancy, and ADR is crucial for maximizing your Airbnb profit potential in Holden Beach.
Seasonal Strategies for Maximizing Profit
- Peak Season: Maximize revenue through premium pricing and potentially longer minimum stays. Ensure high availability.
- Low Season: Offer competitive pricing, special promotions (e.g., extended stay discounts), and flexible cancellation policies. Target off-season travelers like remote workers or budget-conscious guests.
- Shoulder Seasons: Implement dynamic pricing that balances peak and low rates. Target weekend travelers or specific events. Offer slightly more flexible terms than peak season.
- Regularly analyze your own performance against these Holden Beach seasonality benchmarks and adjust your pricing and availability strategy accordingly.
Best Areas for Airbnb Investment in Holden Beach (2026)
Exploring the top neighborhoods for short-term rentals in Holden Beach? This section highlights key areas, outlining why they are attractive for hosts and guests, along with notable local attractions. Consider these locations based on your target guest profile and investment strategy.
| Neighborhood / Area | Why Host Here? (Target Guests & Appeal) | Key Attractions & Landmarks |
|---|---|---|
| Holden Beach | A serene coastal town known for its family-friendly atmosphere and beautiful, quiet beaches. The area attracts vacationers looking for relaxation and outdoor activities such as fishing, boating, and beachcombing. | Holden Beach Fishing Pier, Museum of Coastal Carolina, Shallotte River Swamp Park, Ocean Isle Beach, Sunset Beach |
| Ocean Isle Beach | A neighboring beach community offering a similar vibe to Holden Beach, with great beachfront properties and attractions. It's popular for water sports and has a relaxed, laid-back feel. | Ocean Isle Beach Pier, Museum of Coastal Carolina, Ingram Planetarium, Putters Paradise, Ocean Isle Beach Park |
| Sunset Beach | Known for its stunning sunsets and tranquil surroundings, Sunset Beach is a nearby beach destination favored by families and those looking to enjoy nature. | Sunset Beach Fishing Pier, Bird Island Reserve, The Kindred Spirit Mailbox, Sunset Beach Park, Calabash River |
| Brunswick Islands | A collection of beautiful coastal towns including Holden Beach, this area is ideal for investing in vacation rentals due to its beachfront properties and vacation appeal. | Brunswick Islands Beaches, Shallotte River, Calabash Seafood, Golf courses, Outdoor recreational options |
| Oak Island | A family-oriented beach destination known for its wide sandy beaches and outdoor activities, making it a great spot for vacation rentals. | Oak Island Lighthouse, Long Beach, The Point, Golfing at Oak Island Golf Club, Fishing and water sports |
| Supply | A short drive from Holden Beach, Supply offers a more inland experience with proximity to the coast and connection to outdoor activities and local attractions. | Riverside Park, Fishing on the Shallotte River, Local shops and eateries, Birdwatching and nature trails, Close access to nearby beaches |
| Calabash | Famous for its seafood, Calabash is a charming town near the coast that attracts visitors for its dining and waterfront experiences, making it an attractive area for Airbnb hosts. | Calabash River, Dining at local seafood restaurants, Shopping for souvenirs, Golfing nearby, Nature trails |
| Little River | Just over the border in South Carolina, Little River is known for its historical significance and access to the beach, appealing to those looking for a quieter retreat close to Holden Beach. | Little River Waterfront, Marine History Museum, Fishing charters, Casino boats, Calabash River |
Understanding Airbnb License Requirements & STR Laws in Holden Beach (2026)
While Holden Beach, North Carolina, United States currently shows low STR regulations, specific Airbnb license requirements might still exist or change. Always verify the latest short term rental regulations and Airbnb license requirements directly with local government authorities for Holden Beach to ensure full compliance before hosting.
(Source: AirROI data, 2026, finding no licensed listings among those analyzed)
Top Performing Airbnb Properties in Holden Beach (2026)
Benchmark your potential! Explore examples of top-performing Airbnb properties in Holden Beachbased on Trailing Twelve Month (TTM) revenue. Analyze their characteristics, revenue, occupancy rate, and ADR to understand what drives success in this market.
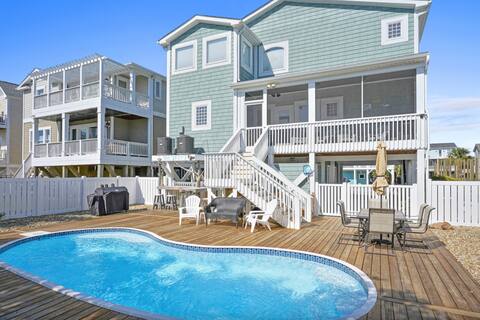
Pool, Spa, Direct ocean Views and access
Entire Place • 5 bedrooms
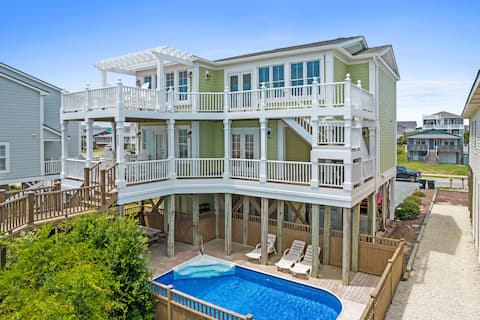
Private Heated Pool, Beach and Peir Access
Entire Place • 4 bedrooms
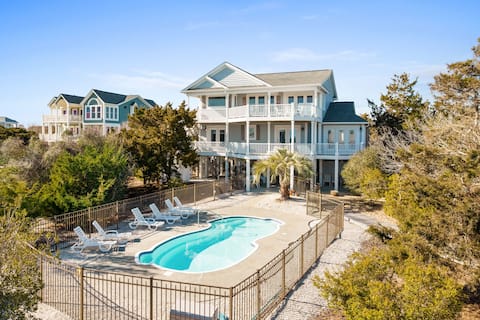
6 Bedroom Ocean front Private Heated Pool Elevator
Entire Place • 6 bedrooms

6 Bedroom Ocean Front, Heated Pool, Views
Entire Place • 6 bedrooms
6-Bedroom Ocean View with Private Heated Pool
Entire Place • 6 bedrooms

Isle Oasis. Oceanfront, Elevator, Heatable Pool
Entire Place • 8 bedrooms
Note: Performance varies based on location, size, amenities, seasonality, and management quality. Data reflects the past 12 months.
Top Performing Airbnb Hosts in Holden Beach (2026)
Learn from the best! This table showcases top-performing Airbnb hosts in Holden Beach based on the number of properties managed and estimated total revenue over the past year. Analyze their scale and performance metrics.
| Host Name | Properties | Grossing Revenue | Stay Reviews | Avg Rating |
|---|---|---|---|---|
| Brunswick Vacation Rentals | 10 | $1,478,681 | 131 | 4.80/5.0 |
| Coastal Vacation | 41 | $502,490 | 108 | 4.68/5.0 |
| Evolve | 9 | $438,205 | 201 | 4.65/5.0 |
| Vacasa North Carolina | 59 | $375,122 | 716 | 4.58/5.0 |
| Julie | 4 | $221,832 | 16 | 4.54/5.0 |
| CoastAway | 2 | $218,778 | 15 | 4.80/5.0 |
| Jandy | 2 | $209,608 | 135 | 4.96/5.0 |
| Regina | 4 | $209,418 | 25 | 5.00/5.0 |
| Vacasa North Carolina | 19 | $205,936 | 82 | 4.59/5.0 |
| Brad | 1 | $180,470 | 14 | 5.00/5.0 |
Analyzing the strategies of top hosts, such as their property selection, pricing, and guest communication, can offer valuable lessons for optimizing your own Airbnb operations in Holden Beach.
Dive Deeper: Advanced Holden Beach STR Market Data (2026)
Ready to unlock more insights? AirROI provides access to advanced metrics and comprehensive Airbnb data for Holden Beach. Explore detailed analytics beyond this report to refine your investment strategy, optimize pricing, and maximize your vacation rental profits.
Explore Advanced MetricsHolden Beach Short-Term Rental Market Composition (2026): Property & Room Types
Room Type Distribution
Property Type Distribution
Market Composition Insights for Holden Beach
- The Holden Beach Airbnb market composition is heavily skewed towards Entire Home/Apt listings, which make up 99.7% of the 297 active rentals. This indicates strong guest preference for privacy and space.
- Looking at the property type distribution in Holden Beach, House properties are the most common (97.3%), reflecting the local real estate landscape.
- Houses represent a significant 97.3% portion, catering likely to families or larger groups.
- Smaller segments like apartment/condo (combined 2.7%) offer potential for unique stay experiences.
Holden Beach Airbnb Room Capacity Analysis (2026): Bedroom Distribution
Distribution of Listings by Number of Bedrooms
Room Capacity Insights for Holden Beach
- The dominant room capacity in Holden Beach is 4 bedrooms listings, making up 42.4% of the market. This suggests a strong demand for properties suitable for families or small groups.
- Together, 4 bedrooms and 3 bedrooms properties represent 70.3% of the active Airbnb listings in Holden Beach, indicating a high concentration in these sizes.
- A significant 89.2% of listings offer 3+ bedrooms, catering to larger groups and families seeking more space in Holden Beach.
Holden Beach Vacation Rental Guest Capacity Trends (2026)
Distribution of Listings by Guest Capacity
Guest Capacity Insights for Holden Beach
- The most common guest capacity trend in Holden Beach vacation rentals is listings accommodating 8+ guests (75.8%). This suggests the primary traveler segment is likely larger groups.
- Properties designed for 8+ guests and 6 guests dominate the Holden Beach STR market, accounting for 89.9% of listings.
- 93.9% of properties accommodate 6+ guests, serving the market segment for larger families or group travel in Holden Beach.
- On average, properties in Holden Beach are equipped to host 7.4 guests.
Holden Beach Airbnb Booking Patterns (2026): Available vs. Booked Days
Available Days Distribution
Booked Days Distribution
Booking Pattern Insights for Holden Beach
- The most common availability pattern in Holden Beach falls within the 271-366 days range, representing 64.6% of listings. This suggests many properties have significant open periods on their calendars.
- Approximately 92.5% of listings show high availability (181+ days open annually), indicating potential for increased bookings or specific owner usage patterns.
- For booked days, the 1-30 days range is most frequent in Holden Beach (38.4%), reflecting common guest stay durations or potential owner blocking patterns.
- A notable 7.8% of properties secure long booking periods (181+ days booked per year), highlighting successful long-term rental strategies or significant owner usage.
Holden Beach Airbnb Minimum Stay Requirements Analysis
Distribution of Listings by Minimum Night Requirement
1 Night
10 listings
3.4% of total
2 Nights
52 listings
17.5% of total
3 Nights
31 listings
10.4% of total
4-6 Nights
27 listings
9.1% of total
7-29 Nights
17 listings
5.7% of total
30+ Nights
160 listings
53.9% of total
Key Insights
- The most prevalent minimum stay requirement in Holden Beach is 30+ Nights, adopted by 53.9% of listings. This highlights the market's preference for longer commitments.
- A significant segment (53.9%) caters to monthly stays (30+ nights) in Holden Beach, pointing to opportunities in the extended-stay market.
Recommendations
- Align with the market by considering a 30+ Nights minimum stay, as 53.9% of Holden Beach hosts use this setting.
- If feasible, allowing 1-night stays, especially midweek or during low season, could capture last-minute bookings, as only 3.4% currently do.
- Explore offering discounts for stays of 30+ nights to attract the 53.9% of the market seeking extended stays.
- Adjust minimum nights based on seasonality – potentially shorter during low season and longer during peak demand periods in Holden Beach.
Holden Beach Airbnb Cancellation Policy Trends Analysis (2026)
Super Strict 30 Days
12 listings
4% of total
Super Strict 60 Days
112 listings
37.7% of total
Limited
1 listings
0.3% of total
Flexible
11 listings
3.7% of total
Moderate
14 listings
4.7% of total
Firm
107 listings
36% of total
Strict
40 listings
13.5% of total
Cancellation Policy Insights for Holden Beach
- The prevailing Airbnb cancellation policy trend in Holden Beach is Super Strict 60 Days, used by 37.7% of listings.
- There's a relatively balanced mix between guest-friendly (8.4%) and stricter (49.5%) policies, offering choices for different guest needs.
Recommendations for Hosts
- Consider adopting a Super Strict 60 Days policy to align with the 37.7% market standard in Holden Beach.
- Using a Strict policy might deter some guests, as only 13.5% of listings use it. Evaluate if potential revenue protection outweighs possible lower booking rates.
- Regularly review your cancellation policy against competitors and market demand shifts in Holden Beach.
Holden Beach STR Booking Lead Time Analysis (2026)
Average Booking Lead Time by Month
Booking Lead Time Insights for Holden Beach
- The overall average booking lead time for vacation rentals in Holden Beach is 86 days.
- Guests book furthest in advance for stays during July (average 134 days), likely coinciding with peak travel demand or local events.
- The shortest booking windows occur for stays in February (average 33 days), indicating more last-minute travel plans during this time.
- Seasonally, Summer (120 days avg.) sees the longest lead times, while Winter (43 days avg.) has the shortest, reflecting typical travel planning cycles.
Recommendations for Hosts
- Use the overall average lead time (86 days) as a baseline for your pricing and availability strategy in Holden Beach.
- For July stays, consider implementing length-of-stay discounts or slightly higher rates for bookings made less than 134 days out to capitalize on advance planning.
- Target marketing efforts for the Summer season well in advance (at least 120 days) to capture early planners.
- Monitor your own booking lead times against these Holden Beach averages to identify opportunities for dynamic pricing adjustments.
Popular & Essential Airbnb Amenities in Holden Beach (2026)
Amenity Prevalence
Amenity Insights for Holden Beach
- Essential amenities in Holden Beach that guests expect include: Air conditioning, TV, Wifi, Smoke alarm, Kitchen, Free parking on premises, Washer, Dryer, Refrigerator, Heating. Lacking these (any) could significantly impact bookings.
Recommendations for Hosts
- Ensure your listing includes all essential amenities for Holden Beach: Air conditioning, TV, Wifi, Smoke alarm, Kitchen, Free parking on premises, Washer, Dryer, Refrigerator, Heating.
- Prioritize adding missing essentials: Wifi, Smoke alarm, Kitchen, Free parking on premises, Washer, Dryer, Refrigerator, Heating.
- Highlight unique or less common amenities you offer (e.g., hot tub, dedicated workspace, EV charger) in your listing description and photos.
- Regularly check competitor amenities in Holden Beach to stay competitive.
Holden Beach Airbnb Guest Demographics & Profile Analysis (2026)
Guest Profile Summary for Holden Beach
- The typical guest profile for Airbnb in Holden Beach consists of primarily domestic travelers (99%), often arriving from nearby Charlotte, typically belonging to the Post-2000s (Gen Z/Alpha) group (50%), primarily speaking English or Spanish.
- Domestic travelers account for 98.9% of guests.
- Key international markets include United States (98.9%) and DC (0.7%).
- Top languages spoken are English (84.5%) followed by Spanish (7.9%).
- A significant demographic segment is the Post-2000s (Gen Z/Alpha) group, representing 50% of guests.
Recommendations for Hosts
- Target domestic marketing efforts towards travelers from Charlotte and Raleigh.
- Tailor amenities and listing descriptions to appeal to the dominant Post-2000s (Gen Z/Alpha) demographic (e.g., highlight fast WiFi, smart home features, local guides).
- Highlight unique local experiences or amenities relevant to the primary guest profile.
- Consider seasonal promotions aligned with peak travel times for key origin markets.
Nearby Short-Term Rental Market Comparison
How does the Holden Beach Airbnb market stack up against its neighbors? Compare key performance metrics like average monthly revenue, ADR, and occupancy rates in surrounding areas to understand the broader regional STR landscape.
| Market | Active Properties | Monthly Revenue | Daily Rate | Avg. Occupancy |
|---|---|---|---|---|
| Isle of Palms | 1,004 | $7,287 | $730.96 | 43% |
| Folly Beach | 904 | $7,160 | $572.70 | 47% |
| Sullivan's Island | 23 | $7,082 | $861.05 | 40% |
| Charleston | 1,843 | $5,599 | $389.09 | 53% |
| Ocean Isle Beach | 508 | $5,018 | $610.93 | 38% |
| Wrightsville Beach | 497 | $4,620 | $531.11 | 39% |
| Mount Pleasant | 448 | $4,561 | $303.21 | 54% |
| Bald Head Island | 207 | $4,127 | $601.50 | 33% |
| Kure Beach | 502 | $3,804 | $427.64 | 42% |
| Cedar Point | 30 | $3,725 | $310.88 | 49% |