Graham Airbnb Market Analysis 2026: Short Term Rental Data & Vacation Rental Statistics in North Carolina, United States
Is Airbnb profitable in Graham in 2026? Explore comprehensive Airbnb analytics for Graham, North Carolina, United States to uncover income potential. This 2026 STR market report for Graham, based on AirROI data from February 2025 to January 2026, reveals key trends in the niche market of 46 active listings.
Whether you're considering an Airbnb investment in Graham, optimizing your existing vacation rental, or exploring rental arbitrage opportunities, understanding the Graham Airbnb data is crucial. Leveraging the low regulation environment is key to maximizing your short term rental income potential. Let's dive into the specifics.
Key Graham Airbnb Performance Metrics Overview
Monthly Airbnb Revenue Variations & Income Potential in Graham (2026)
Understanding the monthly revenue variations for Airbnb listings in Graham is key to maximizing your short term rental income potential. Seasonality significantly impacts earnings. Our analysis, based on data from the past 12 months, shows that the peak revenue month for STRs in Graham is typically October, while January often presents the lowest earnings, highlighting opportunities for strategic pricing adjustments during shoulder and low seasons. Explore the typical Airbnb income in Graham across different performance tiers:
- Best-in-class properties (Top 10%) achieve $4,902+ monthly, often utilizing dynamic pricing and superior guest experiences.
- Strong performing properties (Top 25%) earn $3,382 or more, indicating effective management and desirable locations/amenities.
- Typical properties (Median) generate around $2,056 per month, representing the average market performance.
- Entry-level properties (Bottom 25%) see earnings around $718, often with potential for optimization.
Average Monthly Airbnb Earnings Trend in Graham
Graham Airbnb Occupancy Rate Trends (2026)
Maximize your bookings by understanding the Graham STR occupancy trends. Seasonal demand shifts significantly influence how often properties are booked. Typically, Februarysees the highest demand (peak season occupancy), while January experiences the lowest (low season). Effective strategies, like adjusting minimum stays or offering promotions, can boost occupancy during slower periods. Here's how different property tiers perform in Graham:
- Best-in-class properties (Top 10%) achieve 81%+ occupancy, indicating high desirability and potentially optimized availability.
- Strong performing properties (Top 25%) maintain 70% or higher occupancy, suggesting good market fit and guest satisfaction.
- Typical properties (Median) have an occupancy rate around 51%.
- Entry-level properties (Bottom 25%) average 26% occupancy, potentially facing higher vacancy.
Average Monthly Occupancy Rate Trend in Graham
Average Daily Rate (ADR) Airbnb Trends in Graham (2026)
Effective short term rental pricing strategy in Graham involves understanding monthly ADR fluctuations. The Average Daily Rate (ADR) for Airbnb in Graham typically peaks in October and dips lowest during February. Leveraging Airbnb dynamic pricing tools or strategies based on this seasonality can significantly boost revenue. Here's a look at the typical nightly rates achieved:
- Best-in-class properties (Top 10%) command rates of $235+ per night, often due to premium features or locations.
- Strong performing properties (Top 25%) achieve nightly rates of $184 or more.
- Typical properties (Median) charge around $111 per night.
- Entry-level properties (Bottom 25%) earn around $63 per night.
Average Daily Rate (ADR) Trend by Month in Graham
Get Live Graham Market Intelligence 👇

Explore Real-time Analytics
Airbnb Seasonality Analysis & Trends in Graham (2026)
Peak Season (October, May, November)
- Revenue averages $2,646 per month
- Occupancy rates average 49.8%
- Daily rates average $141
Shoulder Season
- Revenue averages $2,314 per month
- Occupancy maintains around 51.5%
- Daily rates hold near $129
Low Season (January, April, September)
- Revenue drops to average $1,916 per month
- Occupancy decreases to average 43.2%
- Daily rates adjust to average $130
Seasonality Insights for Graham
- The Airbnb seasonality in Graham shows moderate seasonality with distinct peak and low periods. While the sections above show seasonal averages, it's also insightful to look at the extremes:
- During the high season, the absolute peak month showcases Graham's highest earning potential, with monthly revenues capable of climbing to $2,848, occupancy reaching a high of 57.3%, and ADRs peaking at $146.
- Conversely, the slowest single month of the year, typically falling within the low season, marks the market's lowest point. In this month, revenue might dip to $1,699, occupancy could drop to 37.6%, and ADRs may adjust down to $116.
- Understanding both the seasonal averages and these monthly peaks and troughs in revenue, occupancy, and ADR is crucial for maximizing your Airbnb profit potential in Graham.
Seasonal Strategies for Maximizing Profit
- Peak Season: Maximize revenue through premium pricing and potentially longer minimum stays. Ensure high availability.
- Low Season: Offer competitive pricing, special promotions (e.g., extended stay discounts), and flexible cancellation policies. Target off-season travelers like remote workers or budget-conscious guests.
- Shoulder Seasons: Implement dynamic pricing that balances peak and low rates. Target weekend travelers or specific events. Offer slightly more flexible terms than peak season.
- Regularly analyze your own performance against these Graham seasonality benchmarks and adjust your pricing and availability strategy accordingly.
Best Areas for Airbnb Investment in Graham (2026)
Exploring the top neighborhoods for short-term rentals in Graham? This section highlights key areas, outlining why they are attractive for hosts and guests, along with notable local attractions. Consider these locations based on your target guest profile and investment strategy.
| Neighborhood / Area | Why Host Here? (Target Guests & Appeal) | Key Attractions & Landmarks |
|---|---|---|
| Downtown Graham | The vibrant heart of Graham, known for its historic charm and local businesses. Attracts visitors for its quaint shops and community events, making it a great location for a cozy Airbnb. | Graham Historic District, Burlington Graham Regional Airport, Local eateries and shops, Graham Recreation Park, Annual festivals and parades |
| Hawfields | A suburban area just outside of Graham, offering a mix of residential comfort and accessibility to larger attractions. Ideal for families and those seeking a quieter stay. | Hawfields Park, Hawfields Baptist Church, Access to nearby shopping centers, Nearby nature trails, Community events |
| Mebane | Located a short drive from Graham, Mebane is known for its shopping outlets and family-friendly environment, attracting visitors who prefer a suburban feel while being close to urban amenities. | The Tanger Outlets, Mebane Historic District, Local parks, Annual festivals, Craft breweries |
| Burlington | Just a short trip from Graham, Burlington provides access to larger city amenities while retaining a small-town charm. It is a strategic location for short-term rentals catering to both business and leisure travelers. | Burlington City Park, Piney Lake, The Burlington Outlet Village, Local dining options, Historical sites |
| Alamance County | An area that encompasses Graham and offers diverse attractions, making it ideal for a range of guests including business travelers and families looking for a getaway close to nature. | Hiking trails in the county, Visit local farms and vineyards, Historic battlefields, Nature preserves, Wildlife viewing opportunities |
| Graham Mill | A historic site and area around Sawtooth and textile history, attracting history buffs and those interested in local culture and heritage. A unique spot for themed stays. | Historic mills, Museums, Local artisan shops, Cultural events, Heritage tours |
| Swepsonville | A small community nearby with peaceful surroundings, ideal for retreats and relaxation. Great for visitors seeking a tranquil ambiance outside the city bustle. | Local parks, Fishing spots, Canoeing on the Haw River, Nearby natural reserves, Community gatherings |
| Elon | Home to Elon University, this area attracts students, families, and visitors attending school events, making it a prime location for short-term rentals. | Elon University campus, Local cafes and restaurants, Campus events, Community festivals, Historic sites in Elon |
Understanding Airbnb License Requirements & STR Laws in Graham (2026)
While Graham, North Carolina, United States currently shows low STR regulations, specific Airbnb license requirements might still exist or change. Always verify the latest short term rental regulations and Airbnb license requirements directly with local government authorities for Graham to ensure full compliance before hosting.
(Source: AirROI data, 2026, finding no licensed listings among those analyzed)
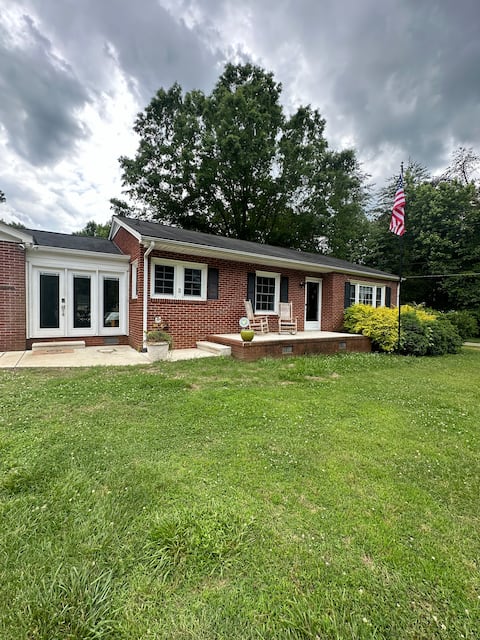
Top Performing Airbnb Properties in Graham (2026)
Benchmark your potential! Explore examples of top-performing Airbnb properties in Grahambased on Trailing Twelve Month (TTM) revenue. Analyze their characteristics, revenue, occupancy rate, and ADR to understand what drives success in this market.
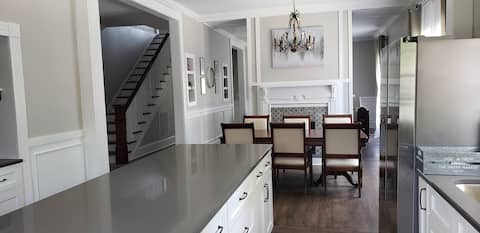
Historic Home in the Heart of Graham
Entire Place • 3 bedrooms
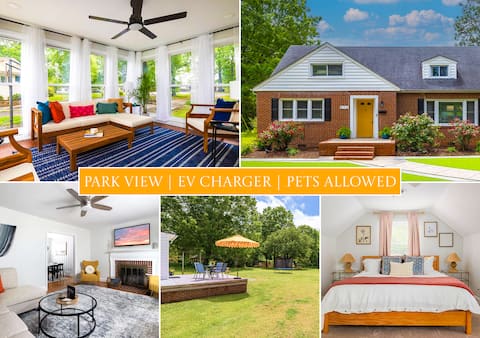
Sunlit Graham Escape | Huge Yard | BBQ
Entire Place • 4 bedrooms
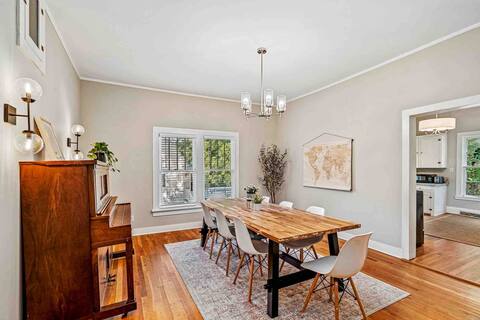
Bluebird Bungalow, walk to downtown
Entire Place • 5 bedrooms

Stylish Graham Retreat | Garden View | BBQ Grill
Entire Place • 3 bedrooms
Rest at Bee All Organic
Entire Place • 3 bedrooms
Cozy Home in Graham | Hot Tub | BBQ
Entire Place • 4 bedrooms
Note: Performance varies based on location, size, amenities, seasonality, and management quality. Data reflects the past 12 months.
Top Performing Airbnb Hosts in Graham (2026)
Learn from the best! This table showcases top-performing Airbnb hosts in Graham based on the number of properties managed and estimated total revenue over the past year. Analyze their scale and performance metrics.
| Host Name | Properties | Grossing Revenue | Stay Reviews | Avg Rating |
|---|---|---|---|---|
| Benjamin | 8 | $348,925 | 873 | 4.81/5.0 |
| Kathy | 5 | $67,896 | 432 | 4.80/5.0 |
| Kristina And Eric | 1 | $63,995 | 95 | 5.00/5.0 |
| Stacy And Jason | 1 | $55,543 | 311 | 4.95/5.0 |
| Robert | 1 | $54,295 | 71 | 4.86/5.0 |
| Lauren | 2 | $49,424 | 25 | 4.74/5.0 |
| Brandon | 1 | $41,125 | 141 | 4.94/5.0 |
| Malik | 1 | $32,583 | 27 | 4.89/5.0 |
| Karen | 1 | $31,681 | 28 | 5.00/5.0 |
| Mtende | 1 | $30,613 | 37 | 4.89/5.0 |
Analyzing the strategies of top hosts, such as their property selection, pricing, and guest communication, can offer valuable lessons for optimizing your own Airbnb operations in Graham.
Dive Deeper: Advanced Graham STR Market Data (2026)
Ready to unlock more insights? AirROI provides access to advanced metrics and comprehensive Airbnb data for Graham. Explore detailed analytics beyond this report to refine your investment strategy, optimize pricing, and maximize your vacation rental profits.
Explore Advanced MetricsGraham Short-Term Rental Market Composition (2026): Property & Room Types
Room Type Distribution
Property Type Distribution
Market Composition Insights for Graham
- The Graham Airbnb market composition is heavily skewed towards Entire Home/Apt listings, which make up 73.9% of the 46 active rentals. This indicates strong guest preference for privacy and space.
- Looking at the property type distribution in Graham, House properties are the most common (76.1%), reflecting the local real estate landscape.
- Houses represent a significant 76.1% portion, catering likely to families or larger groups.
Graham Airbnb Room Capacity Analysis (2026): Bedroom Distribution
Distribution of Listings by Number of Bedrooms
Room Capacity Insights for Graham
- The dominant room capacity in Graham is 1 bedroom listings, making up 23.9% of the market. This suggests a strong demand for properties suitable for couples or solo travelers.
- Together, 1 bedroom and 3 bedrooms properties represent 43.5% of the active Airbnb listings in Graham, indicating a high concentration in these sizes.
- A significant 34.8% of listings offer 3+ bedrooms, catering to larger groups and families seeking more space in Graham.
Graham Vacation Rental Guest Capacity Trends (2026)
Distribution of Listings by Guest Capacity
Guest Capacity Insights for Graham
- The most common guest capacity trend in Graham vacation rentals is listings accommodating 8+ guests (21.7%). This suggests the primary traveler segment is likely larger groups.
- Properties designed for 8+ guests and 6 guests dominate the Graham STR market, accounting for 39.1% of listings.
- 41.3% of properties accommodate 6+ guests, serving the market segment for larger families or group travel in Graham.
- On average, properties in Graham are equipped to host 4.0 guests.
Graham Airbnb Booking Patterns (2026): Available vs. Booked Days
Available Days Distribution
Booked Days Distribution
Booking Pattern Insights for Graham
- The most common availability pattern in Graham falls within the 91-180 days range, representing 34.8% of listings. This suggests many properties have significant open periods on their calendars.
- Approximately 56.6% of listings show high availability (181+ days open annually), indicating potential for increased bookings or specific owner usage patterns.
- For booked days, the 181-270 days range is most frequent in Graham (32.6%), reflecting common guest stay durations or potential owner blocking patterns.
- A notable 43.5% of properties secure long booking periods (181+ days booked per year), highlighting successful long-term rental strategies or significant owner usage.
Graham Airbnb Minimum Stay Requirements Analysis
Distribution of Listings by Minimum Night Requirement
1 Night
20 listings
43.5% of total
2 Nights
6 listings
13% of total
3 Nights
1 listings
2.2% of total
4-6 Nights
1 listings
2.2% of total
7-29 Nights
4 listings
8.7% of total
30+ Nights
14 listings
30.4% of total
Key Insights
- The most prevalent minimum stay requirement in Graham is 1 Night, adopted by 43.5% of listings. This highlights the market's preference for shorter, flexible bookings.
- A significant segment (30.4%) caters to monthly stays (30+ nights) in Graham, pointing to opportunities in the extended-stay market.
Recommendations
- Align with the market by considering a 1 Night minimum stay, as 43.5% of Graham hosts use this setting.
- Explore offering discounts for stays of 30+ nights to attract the 30.4% of the market seeking extended stays.
- Adjust minimum nights based on seasonality – potentially shorter during low season and longer during peak demand periods in Graham.
Graham Airbnb Cancellation Policy Trends Analysis (2026)
Flexible
21 listings
45.7% of total
Moderate
8 listings
17.4% of total
Firm
15 listings
32.6% of total
Strict
2 listings
4.3% of total
Cancellation Policy Insights for Graham
- The prevailing Airbnb cancellation policy trend in Graham is Flexible, used by 45.7% of listings.
- There's a relatively balanced mix between guest-friendly (63.1%) and stricter (36.9%) policies, offering choices for different guest needs.
- Strict cancellation policies are quite rare (4.3%), potentially making listings with this policy less competitive unless justified by high demand or property type.
Recommendations for Hosts
- Consider adopting a Flexible policy to align with the 45.7% market standard in Graham.
- Using a Strict policy might deter some guests, as only 4.3% of listings use it. Evaluate if potential revenue protection outweighs possible lower booking rates.
- Regularly review your cancellation policy against competitors and market demand shifts in Graham.
Graham STR Booking Lead Time Analysis (2026)
Average Booking Lead Time by Month
Booking Lead Time Insights for Graham
- The overall average booking lead time for vacation rentals in Graham is 35 days.
- Guests book furthest in advance for stays during May (average 61 days), likely coinciding with peak travel demand or local events.
- The shortest booking windows occur for stays in December (average 24 days), indicating more last-minute travel plans during this time.
- Seasonally, Fall (48 days avg.) sees the longest lead times, while Winter (26 days avg.) has the shortest, reflecting typical travel planning cycles.
Recommendations for Hosts
- Use the overall average lead time (35 days) as a baseline for your pricing and availability strategy in Graham.
- For May stays, consider implementing length-of-stay discounts or slightly higher rates for bookings made less than 61 days out to capitalize on advance planning.
- Target marketing efforts for the Fall season well in advance (at least 48 days) to capture early planners.
- Monitor your own booking lead times against these Graham averages to identify opportunities for dynamic pricing adjustments.
Popular & Essential Airbnb Amenities in Graham (2026)
Amenity Prevalence
Amenity Insights for Graham
- Essential amenities in Graham that guests expect include: Air conditioning. Lacking these (this) could significantly impact bookings.
- Popular amenities like Free parking on premises, Hot water, Wifi are common but not universal. Offering these can provide a competitive edge.
- Warning: Wifi is not universally provided but is considered essential globally. Ensure reliable Wifi is offered.
Recommendations for Hosts
- Ensure your listing includes all essential amenities for Graham: Air conditioning.
- Prioritize adding missing essentials: Air conditioning.
- Consider adding popular differentiators like Free parking on premises or Hot water to increase appeal.
- Highlight unique or less common amenities you offer (e.g., hot tub, dedicated workspace, EV charger) in your listing description and photos.
- Regularly check competitor amenities in Graham to stay competitive.
Graham Airbnb Guest Demographics & Profile Analysis (2026)
Guest Profile Summary for Graham
- The typical guest profile for Airbnb in Graham consists of primarily domestic travelers (97%), often arriving from nearby Raleigh, typically belonging to the Post-2000s (Gen Z/Alpha) group (50%), primarily speaking English or Spanish.
- Domestic travelers account for 97.0% of guests.
- Key international markets include United States (97%) and Canada (0.7%).
- Top languages spoken are English (73.5%) followed by Spanish (12.6%).
- A significant demographic segment is the Post-2000s (Gen Z/Alpha) group, representing 50% of guests.
Recommendations for Hosts
- Target domestic marketing efforts towards travelers from Raleigh and Durham.
- Tailor amenities and listing descriptions to appeal to the dominant Post-2000s (Gen Z/Alpha) demographic (e.g., highlight fast WiFi, smart home features, local guides).
- Highlight unique local experiences or amenities relevant to the primary guest profile.
- Consider seasonal promotions aligned with peak travel times for key origin markets.
Nearby Short-Term Rental Market Comparison
How does the Graham Airbnb market stack up against its neighbors? Compare key performance metrics like average monthly revenue, ADR, and occupancy rates in surrounding areas to understand the broader regional STR landscape.
| Market | Active Properties | Monthly Revenue | Daily Rate | Avg. Occupancy |
|---|---|---|---|---|
| Denver | 109 | $6,309 | $590.96 | 45% |
| Mooresville | 369 | $5,702 | $559.93 | 42% |
| Penhook | 18 | $5,675 | $678.75 | 37% |
| Sherrills Ford | 107 | $5,615 | $547.26 | 41% |
| Troutman | 49 | $5,587 | $467.90 | 42% |
| Nellysford | 62 | $5,276 | $426.33 | 39% |
| Lake Norman of Catawba | 51 | $4,972 | $513.30 | 43% |
| Afton | 134 | $4,599 | $370.92 | 41% |
| Faber | 25 | $4,294 | $357.03 | 44% |
| Wintergreen Resort | 83 | $4,210 | $374.00 | 41% |