Forest City Airbnb Market Analysis 2026: Short Term Rental Data & Vacation Rental Statistics in North Carolina, United States
Is Airbnb profitable in Forest City in 2026? Explore comprehensive Airbnb analytics for Forest City, North Carolina, United States to uncover income potential. This 2026 STR market report for Forest City, based on AirROI data from February 2025 to January 2026, reveals key trends in the niche market of 27 active listings.
Whether you're considering an Airbnb investment in Forest City, optimizing your existing vacation rental, or exploring rental arbitrage opportunities, understanding the Forest City Airbnb data is crucial. Leveraging the low regulation environment is key to maximizing your short term rental income potential. Let's dive into the specifics.
Key Forest City Airbnb Performance Metrics Overview
Monthly Airbnb Revenue Variations & Income Potential in Forest City (2026)
Understanding the monthly revenue variations for Airbnb listings in Forest City is key to maximizing your short term rental income potential. Seasonality significantly impacts earnings. Our analysis, based on data from the past 12 months, shows that the peak revenue month for STRs in Forest City is typically September, while January often presents the lowest earnings, highlighting opportunities for strategic pricing adjustments during shoulder and low seasons. Explore the typical Airbnb income in Forest City across different performance tiers:
- Best-in-class properties (Top 10%) achieve $3,272+ monthly, often utilizing dynamic pricing and superior guest experiences.
- Strong performing properties (Top 25%) earn $2,637 or more, indicating effective management and desirable locations/amenities.
- Typical properties (Median) generate around $1,756 per month, representing the average market performance.
- Entry-level properties (Bottom 25%) see earnings around $921, often with potential for optimization.
Average Monthly Airbnb Earnings Trend in Forest City
Forest City Airbnb Occupancy Rate Trends (2026)
Maximize your bookings by understanding the Forest City STR occupancy trends. Seasonal demand shifts significantly influence how often properties are booked. Typically, Septembersees the highest demand (peak season occupancy), while January experiences the lowest (low season). Effective strategies, like adjusting minimum stays or offering promotions, can boost occupancy during slower periods. Here's how different property tiers perform in Forest City:
- Best-in-class properties (Top 10%) achieve 82%+ occupancy, indicating high desirability and potentially optimized availability.
- Strong performing properties (Top 25%) maintain 67% or higher occupancy, suggesting good market fit and guest satisfaction.
- Typical properties (Median) have an occupancy rate around 43%.
- Entry-level properties (Bottom 25%) average 20% occupancy, potentially facing higher vacancy.
Average Monthly Occupancy Rate Trend in Forest City
Average Daily Rate (ADR) Airbnb Trends in Forest City (2026)
Effective short term rental pricing strategy in Forest City involves understanding monthly ADR fluctuations. The Average Daily Rate (ADR) for Airbnb in Forest City typically peaks in December and dips lowest during April. Leveraging Airbnb dynamic pricing tools or strategies based on this seasonality can significantly boost revenue. Here's a look at the typical nightly rates achieved:
- Best-in-class properties (Top 10%) command rates of $175+ per night, often due to premium features or locations.
- Strong performing properties (Top 25%) achieve nightly rates of $142 or more.
- Typical properties (Median) charge around $116 per night.
- Entry-level properties (Bottom 25%) earn around $95 per night.
Average Daily Rate (ADR) Trend by Month in Forest City
Get Live Forest City Market Intelligence 👇

Explore Real-time Analytics
Airbnb Seasonality Analysis & Trends in Forest City (2026)
Peak Season (September, July, August)
- Revenue averages $2,201 per month
- Occupancy rates average 51.8%
- Daily rates average $131
Shoulder Season
- Revenue averages $1,939 per month
- Occupancy maintains around 45.8%
- Daily rates hold near $135
Low Season (January, February, April)
- Revenue drops to average $1,482 per month
- Occupancy decreases to average 39.2%
- Daily rates adjust to average $130
Seasonality Insights for Forest City
- The Airbnb seasonality in Forest City shows moderate seasonality with distinct peak and low periods. While the sections above show seasonal averages, it's also insightful to look at the extremes:
- During the high season, the absolute peak month showcases Forest City's highest earning potential, with monthly revenues capable of climbing to $2,264, occupancy reaching a high of 53.7%, and ADRs peaking at $142.
- Conversely, the slowest single month of the year, typically falling within the low season, marks the market's lowest point. In this month, revenue might dip to $1,386, occupancy could drop to 31.8%, and ADRs may adjust down to $125.
- Understanding both the seasonal averages and these monthly peaks and troughs in revenue, occupancy, and ADR is crucial for maximizing your Airbnb profit potential in Forest City.
Seasonal Strategies for Maximizing Profit
- Peak Season: Maximize revenue through premium pricing and potentially longer minimum stays. Ensure high availability.
- Low Season: Offer competitive pricing, special promotions (e.g., extended stay discounts), and flexible cancellation policies. Target off-season travelers like remote workers or budget-conscious guests.
- Shoulder Seasons: Implement dynamic pricing that balances peak and low rates. Target weekend travelers or specific events. Offer slightly more flexible terms than peak season.
- Regularly analyze your own performance against these Forest City seasonality benchmarks and adjust your pricing and availability strategy accordingly.
Best Areas for Airbnb Investment in Forest City (2026)
Exploring the top neighborhoods for short-term rentals in Forest City? This section highlights key areas, outlining why they are attractive for hosts and guests, along with notable local attractions. Consider these locations based on your target guest profile and investment strategy.
| Neighborhood / Area | Why Host Here? (Target Guests & Appeal) | Key Attractions & Landmarks |
|---|---|---|
| Downtown Forest City | The heart of the city with vibrant local shops and restaurants. It's ideal for visitors looking for a central location with easy access to local amenities. | Parker-Binns Vineyard, Forest City Golf Course, Local restaurants, Cleveland County Arts Council, Morris Park |
| Lake Lure | A picturesque area known for its beautiful lake and outdoor activities. Perfect for families and vacationers looking to enjoy nature and water sports. | Lake Lure Beach, Chimney Rock State Park, Lake Lure Boat Tours, Rumbling Bald Resort, zip lining adventures |
| Rutherfordton | A neighboring town with charming historical sites and a friendly atmosphere. Great for visitors who appreciate history and small-town vibes. | Rutherford County Courthouse, The Bennett Classics Antique Car Museum, Historic Downtown Rutherfordton, Overmountain Victory National Historic Trail, Local boutiques |
| Chimney Rock | A popular tourist destination known for stunning views and hiking opportunities. Attracts outdoor enthusiasts and nature lovers. | Chimney Rock State Park, Hickory Nut Falls, Chimney Rock Village, Sandy Beach at Lake Lure, Nature Trails |
| Spindale | A small town with community events and a close-knit feel. Appeals to visitors wanting to experience local culture and events. | Spindale Park, Local festivals, Historic homes, Carolina Heritage Museum, Railroad excursions |
| Union Mills | Offers a quiet, rural setting with beautiful landscapes. Ideal for travelers looking for a peaceful getaway. | Catawba Falls, Union Mills Train Depot, Local farms, Hiking trails, Picnic areas |
| Forest City Lakes | A serene location with beautiful lake views and recreational activities. Suitable for those wanting a relaxing vacation experience. | Swimming and fishing spots, Hiking trails, Nature walks, Scenic picnic spots, Wildlife watching |
| Bostic | A quaint town offering a glimpse into rural life with local farms and community charm. Great for visitors looking for an off-the-beaten-path experience. | Bostic Historical Museum, Bostic Sunshine Park, Long Branch Nature Preserve, Local farms and markets, Hiking trails |
Understanding Airbnb License Requirements & STR Laws in Forest City (2026)
While Forest City, North Carolina, United States currently shows low STR regulations, specific Airbnb license requirements might still exist or change. Always verify the latest short term rental regulations and Airbnb license requirements directly with local government authorities for Forest City to ensure full compliance before hosting.
(Source: AirROI data, 2026, finding no licensed listings among those analyzed)
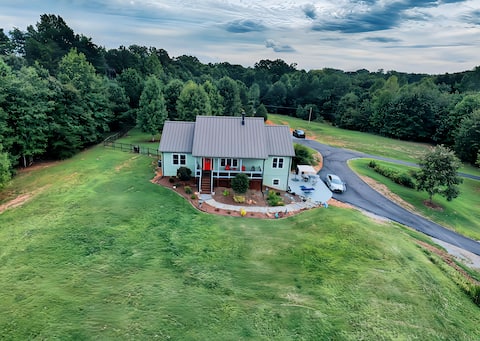
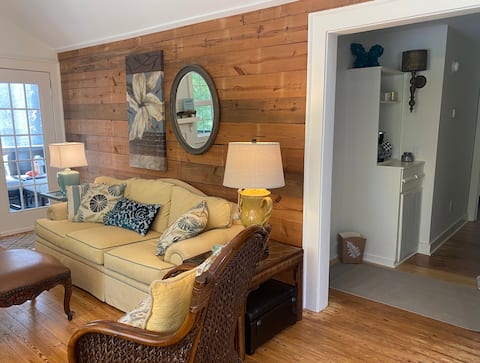
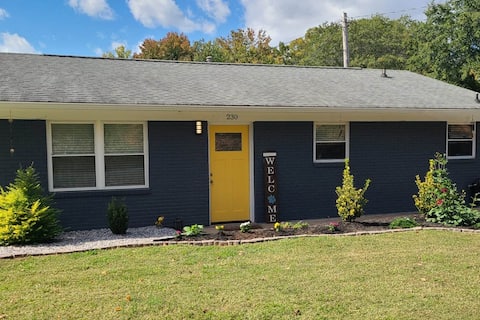
Top Performing Airbnb Properties in Forest City (2026)
Benchmark your potential! Explore examples of top-performing Airbnb properties in Forest Citybased on Trailing Twelve Month (TTM) revenue. Analyze their characteristics, revenue, occupancy rate, and ADR to understand what drives success in this market.

In-town, dog-friendly cabin with creek
Entire Place • 2 bedrooms
Wow! Mountain Home on 30 acres
Entire Place • 3 bedrooms

Pups welcome at our Downtown Carriage House!
Entire Place • 1 bedroom
Cozy corner cottage
Entire Place • 3 bedrooms

Cozy Italian interior cottage near TIEC
Entire Place • 1 bedroom
Senior Pup Paradise: Fenced yard & 20 min to Tryon
Entire Place • 3 bedrooms
Note: Performance varies based on location, size, amenities, seasonality, and management quality. Data reflects the past 12 months.
Top Performing Airbnb Hosts in Forest City (2026)
Learn from the best! This table showcases top-performing Airbnb hosts in Forest City based on the number of properties managed and estimated total revenue over the past year. Analyze their scale and performance metrics.
| Host Name | Properties | Grossing Revenue | Stay Reviews | Avg Rating |
|---|---|---|---|---|
| Donald | 3 | $70,522 | 424 | 4.84/5.0 |
| Lance | 1 | $44,270 | 70 | 4.99/5.0 |
| Eben | 2 | $44,250 | 214 | 4.96/5.0 |
| Lori | 2 | $37,730 | 95 | 4.95/5.0 |
| Mallory | 1 | $29,537 | 117 | 5.00/5.0 |
| Rhonda | 1 | $28,029 | 204 | 4.98/5.0 |
| Evolve | 2 | $27,342 | 25 | 4.83/5.0 |
| Alex And Kimberly | 1 | $24,924 | 189 | 4.99/5.0 |
| Holly | 1 | $24,822 | 99 | 4.97/5.0 |
| Shelly | 1 | $21,411 | 80 | 4.94/5.0 |
Analyzing the strategies of top hosts, such as their property selection, pricing, and guest communication, can offer valuable lessons for optimizing your own Airbnb operations in Forest City.
Dive Deeper: Advanced Forest City STR Market Data (2026)
Ready to unlock more insights? AirROI provides access to advanced metrics and comprehensive Airbnb data for Forest City. Explore detailed analytics beyond this report to refine your investment strategy, optimize pricing, and maximize your vacation rental profits.
Explore Advanced MetricsForest City Short-Term Rental Market Composition (2026): Property & Room Types
Room Type Distribution
Property Type Distribution
Market Composition Insights for Forest City
- The Forest City Airbnb market composition is heavily skewed towards Entire Home/Apt listings, which make up 92.6% of the 27 active rentals. This indicates strong guest preference for privacy and space.
- Looking at the property type distribution in Forest City, House properties are the most common (63%), reflecting the local real estate landscape.
- Houses represent a significant 63% portion, catering likely to families or larger groups.
- The presence of 14.8% Hotel/Boutique listings indicates integration with traditional hospitality.
Forest City Airbnb Room Capacity Analysis (2026): Bedroom Distribution
Distribution of Listings by Number of Bedrooms
Room Capacity Insights for Forest City
- The dominant room capacity in Forest City is 2 bedrooms listings, making up 40.7% of the market. This suggests a strong demand for properties suitable for couples or solo travelers.
- Together, 2 bedrooms and 1 bedroom properties represent 66.6% of the active Airbnb listings in Forest City, indicating a high concentration in these sizes.
- A significant 25.9% of listings offer 3+ bedrooms, catering to larger groups and families seeking more space in Forest City.
Forest City Vacation Rental Guest Capacity Trends (2026)
Distribution of Listings by Guest Capacity
Guest Capacity Insights for Forest City
- The most common guest capacity trend in Forest City vacation rentals is listings accommodating 6 guests (25.9%). This suggests the primary traveler segment is likely larger groups.
- Properties designed for 6 guests and 4 guests dominate the Forest City STR market, accounting for 48.1% of listings.
- 33.3% of properties accommodate 6+ guests, serving the market segment for larger families or group travel in Forest City.
- On average, properties in Forest City are equipped to host 4.1 guests.
Forest City Airbnb Booking Patterns (2026): Available vs. Booked Days
Available Days Distribution
Booked Days Distribution
Booking Pattern Insights for Forest City
- The most common availability pattern in Forest City falls within the 181-270 days range, representing 37% of listings. This suggests many properties have significant open periods on their calendars.
- Approximately 70.3% of listings show high availability (181+ days open annually), indicating potential for increased bookings or specific owner usage patterns.
- For booked days, the 91-180 days range is most frequent in Forest City (37%), reflecting common guest stay durations or potential owner blocking patterns.
- A notable 33.3% of properties secure long booking periods (181+ days booked per year), highlighting successful long-term rental strategies or significant owner usage.
Forest City Airbnb Minimum Stay Requirements Analysis
Distribution of Listings by Minimum Night Requirement
1 Night
6 listings
22.2% of total
2 Nights
17 listings
63% of total
30+ Nights
4 listings
14.8% of total
Key Insights
- The most prevalent minimum stay requirement in Forest City is 2 Nights, adopted by 63% of listings. This highlights the market's preference for shorter, flexible bookings.
- A strong majority (85.2%) of the Forest City Airbnb data shows acceptance of very short stays (1-2 nights), indicating a dynamic, high-turnover market.
- A significant segment (14.8%) caters to monthly stays (30+ nights) in Forest City, pointing to opportunities in the extended-stay market.
Recommendations
- Align with the market by considering a 2 Nights minimum stay, as 63% of Forest City hosts use this setting.
- If feasible, allowing 1-night stays, especially midweek or during low season, could capture last-minute bookings, as only 22.2% currently do.
- Explore offering discounts for stays of 30+ nights to attract the 14.8% of the market seeking extended stays.
- Adjust minimum nights based on seasonality – potentially shorter during low season and longer during peak demand periods in Forest City.
Forest City Airbnb Cancellation Policy Trends Analysis (2026)
Limited
1 listings
3.7% of total
Flexible
4 listings
14.8% of total
Moderate
16 listings
59.3% of total
Firm
3 listings
11.1% of total
Strict
3 listings
11.1% of total
Cancellation Policy Insights for Forest City
- The prevailing Airbnb cancellation policy trend in Forest City is Moderate, used by 59.3% of listings.
- The market strongly favors guest-friendly terms, with 74.1% of listings offering Flexible or Moderate policies. This suggests guests in Forest City may expect booking flexibility.
Recommendations for Hosts
- Consider adopting a Moderate policy to align with the 59.3% market standard in Forest City.
- Using a Strict policy might deter some guests, as only 11.1% of listings use it. Evaluate if potential revenue protection outweighs possible lower booking rates.
- Regularly review your cancellation policy against competitors and market demand shifts in Forest City.
Forest City STR Booking Lead Time Analysis (2026)
Average Booking Lead Time by Month
Booking Lead Time Insights for Forest City
- The overall average booking lead time for vacation rentals in Forest City is 29 days.
- Guests book furthest in advance for stays during December (average 56 days), likely coinciding with peak travel demand or local events.
- The shortest booking windows occur for stays in January (average 12 days), indicating more last-minute travel plans during this time.
- Seasonally, Fall (39 days avg.) sees the longest lead times, while Summer (26 days avg.) has the shortest, reflecting typical travel planning cycles.
Recommendations for Hosts
- Use the overall average lead time (29 days) as a baseline for your pricing and availability strategy in Forest City.
- For December stays, consider implementing length-of-stay discounts or slightly higher rates for bookings made less than 56 days out to capitalize on advance planning.
- During January, focus on last-minute booking availability and promotions, as guests book with very short notice (12 days avg.).
- Target marketing efforts for the Fall season well in advance (at least 39 days) to capture early planners.
- Monitor your own booking lead times against these Forest City averages to identify opportunities for dynamic pricing adjustments.
Popular & Essential Airbnb Amenities in Forest City (2026)
Amenity Prevalence
Amenity Insights for Forest City
- Essential amenities in Forest City that guests expect include: TV, Smoke alarm, Hot water, Air conditioning, Kitchen, Free parking on premises, Wifi, Refrigerator, Heating. Lacking these (any) could significantly impact bookings.
- Popular amenities like Cooking basics are common but not universal. Offering these can provide a competitive edge.
Recommendations for Hosts
- Ensure your listing includes all essential amenities for Forest City: TV, Smoke alarm, Hot water, Air conditioning, Kitchen, Free parking on premises, Wifi, Refrigerator, Heating.
- Prioritize adding missing essentials: Refrigerator, Heating.
- Consider adding popular differentiators like Cooking basics to increase appeal.
- Highlight unique or less common amenities you offer (e.g., hot tub, dedicated workspace, EV charger) in your listing description and photos.
- Regularly check competitor amenities in Forest City to stay competitive.
Forest City Airbnb Guest Demographics & Profile Analysis (2026)
Guest Profile Summary for Forest City
- The typical guest profile for Airbnb in Forest City consists of primarily domestic travelers (100%), often arriving from nearby Butler, typically belonging to the Post-2000s (Gen Z/Alpha) group (50%), primarily speaking English or Spanish.
- Domestic travelers account for 100.0% of guests.
- Top languages spoken are English (70.8%) followed by Spanish (15.6%).
- A significant demographic segment is the Post-2000s (Gen Z/Alpha) group, representing 50% of guests.
Recommendations for Hosts
- Target domestic marketing efforts towards travelers from Butler and Raleigh.
- Tailor amenities and listing descriptions to appeal to the dominant Post-2000s (Gen Z/Alpha) demographic (e.g., highlight fast WiFi, smart home features, local guides).
- Highlight unique local experiences or amenities relevant to the primary guest profile.
- Consider seasonal promotions aligned with peak travel times for key origin markets.
Nearby Short-Term Rental Market Comparison
How does the Forest City Airbnb market stack up against its neighbors? Compare key performance metrics like average monthly revenue, ADR, and occupancy rates in surrounding areas to understand the broader regional STR landscape.
| Market | Active Properties | Monthly Revenue | Daily Rate | Avg. Occupancy |
|---|---|---|---|---|
| Denver | 109 | $6,309 | $590.96 | 45% |
| Catawba | 16 | $6,093 | $582.49 | 38% |
| Mooresville | 369 | $5,702 | $559.93 | 42% |
| Sherrills Ford | 107 | $5,615 | $547.26 | 41% |
| Troutman | 49 | $5,587 | $467.90 | 42% |
| Lake Norman of Catawba | 51 | $4,972 | $513.30 | 43% |
| Union Mills | 15 | $4,938 | $442.76 | 41% |
| Six Mile | 57 | $4,396 | $449.78 | 42% |
| West Union | 30 | $4,126 | $564.92 | 32% |
| Chapin | 93 | $3,971 | $386.37 | 43% |