Ferguson Airbnb Market Analysis 2026: Short Term Rental Data & Vacation Rental Statistics in North Carolina, United States
Is Airbnb profitable in Ferguson in 2026? Explore comprehensive Airbnb analytics for Ferguson, North Carolina, United States to uncover income potential. This 2026 STR market report for Ferguson, based on AirROI data from February 2025 to January 2026, reveals key trends in the niche market of 43 active listings.
Whether you're considering an Airbnb investment in Ferguson, optimizing your existing vacation rental, or exploring rental arbitrage opportunities, understanding the Ferguson Airbnb data is crucial. Leveraging the low regulation environment is key to maximizing your short term rental income potential. Let's dive into the specifics.
Key Ferguson Airbnb Performance Metrics Overview
Monthly Airbnb Revenue Variations & Income Potential in Ferguson (2026)
Understanding the monthly revenue variations for Airbnb listings in Ferguson is key to maximizing your short term rental income potential. Seasonality significantly impacts earnings. Our analysis, based on data from the past 12 months, shows that the peak revenue month for STRs in Ferguson is typically October, while January often presents the lowest earnings, highlighting opportunities for strategic pricing adjustments during shoulder and low seasons. Explore the typical Airbnb income in Ferguson across different performance tiers:
- Best-in-class properties (Top 10%) achieve $5,656+ monthly, often utilizing dynamic pricing and superior guest experiences.
- Strong performing properties (Top 25%) earn $4,043 or more, indicating effective management and desirable locations/amenities.
- Typical properties (Median) generate around $2,833 per month, representing the average market performance.
- Entry-level properties (Bottom 25%) see earnings around $1,708, often with potential for optimization.
Average Monthly Airbnb Earnings Trend in Ferguson
Ferguson Airbnb Occupancy Rate Trends (2026)
Maximize your bookings by understanding the Ferguson STR occupancy trends. Seasonal demand shifts significantly influence how often properties are booked. Typically, Julysees the highest demand (peak season occupancy), while January experiences the lowest (low season). Effective strategies, like adjusting minimum stays or offering promotions, can boost occupancy during slower periods. Here's how different property tiers perform in Ferguson:
- Best-in-class properties (Top 10%) achieve 50%+ occupancy, indicating high desirability and potentially optimized availability.
- Strong performing properties (Top 25%) maintain 38% or higher occupancy, suggesting good market fit and guest satisfaction.
- Typical properties (Median) have an occupancy rate around 27%.
- Entry-level properties (Bottom 25%) average 18% occupancy, potentially facing higher vacancy.
Average Monthly Occupancy Rate Trend in Ferguson
Average Daily Rate (ADR) Airbnb Trends in Ferguson (2026)
Effective short term rental pricing strategy in Ferguson involves understanding monthly ADR fluctuations. The Average Daily Rate (ADR) for Airbnb in Ferguson typically peaks in October and dips lowest during February. Leveraging Airbnb dynamic pricing tools or strategies based on this seasonality can significantly boost revenue. Here's a look at the typical nightly rates achieved:
- Best-in-class properties (Top 10%) command rates of $471+ per night, often due to premium features or locations.
- Strong performing properties (Top 25%) achieve nightly rates of $416 or more.
- Typical properties (Median) charge around $342 per night.
- Entry-level properties (Bottom 25%) earn around $287 per night.
Average Daily Rate (ADR) Trend by Month in Ferguson
Get Live Ferguson Market Intelligence 👇

Explore Real-time Analytics
Airbnb Seasonality Analysis & Trends in Ferguson (2026)
Peak Season (October, November, July)
- Revenue averages $4,025 per month
- Occupancy rates average 35.9%
- Daily rates average $366
Shoulder Season
- Revenue averages $2,983 per month
- Occupancy maintains around 27.8%
- Daily rates hold near $341
Low Season (January, February, September)
- Revenue drops to average $2,325 per month
- Occupancy decreases to average 22.9%
- Daily rates adjust to average $349
Seasonality Insights for Ferguson
- The Airbnb seasonality in Ferguson shows highly seasonal trends requiring careful strategy. While the sections above show seasonal averages, it's also insightful to look at the extremes:
- During the high season, the absolute peak month showcases Ferguson's highest earning potential, with monthly revenues capable of climbing to $4,086, occupancy reaching a high of 36.5%, and ADRs peaking at $380.
- Conversely, the slowest single month of the year, typically falling within the low season, marks the market's lowest point. In this month, revenue might dip to $1,880, occupancy could drop to 17.0%, and ADRs may adjust down to $315.
- Understanding both the seasonal averages and these monthly peaks and troughs in revenue, occupancy, and ADR is crucial for maximizing your Airbnb profit potential in Ferguson.
Seasonal Strategies for Maximizing Profit
- Peak Season: Maximize revenue through premium pricing and potentially longer minimum stays. Ensure high availability.
- Low Season: Offer competitive pricing, special promotions (e.g., extended stay discounts), and flexible cancellation policies. Target off-season travelers like remote workers or budget-conscious guests.
- Shoulder Seasons: Implement dynamic pricing that balances peak and low rates. Target weekend travelers or specific events. Offer slightly more flexible terms than peak season.
- Regularly analyze your own performance against these Ferguson seasonality benchmarks and adjust your pricing and availability strategy accordingly.
Best Areas for Airbnb Investment in Ferguson (2026)
Exploring the top neighborhoods for short-term rentals in Ferguson? This section highlights key areas, outlining why they are attractive for hosts and guests, along with notable local attractions. Consider these locations based on your target guest profile and investment strategy.
| Neighborhood / Area | Why Host Here? (Target Guests & Appeal) | Key Attractions & Landmarks |
|---|---|---|
| Downtown Ferguson | Central location with access to restaurants, shops, and local events. Attracts visitors looking for a convenient base to explore the nearby attractions. | Ferguson Community Center, Ferguson Municipal Public Library, Ferguson Brewing Company, Parks and Recreational Areas, Local Art Galleries |
| North Park | Family-friendly neighborhood with spacious parks and recreational activities. Popular for families and groups looking for outdoor fun and relaxation. | North Park, Ferguson Community Gardens, Playgrounds, Walking Trails, Local Sports Facilities |
| Lakewood | Scenic area with beautiful homes and easy access to lakeside activities. Great for tourists who enjoy nature and outdoor experiences. | Lakewood Park, Fishing and boating, Picnic Areas, Nature Trails, Scenic Views |
| Civic Center | Hub for public services and events, making it a great area for those attending conferences, workshops, and local government functions. | Ferguson Civic Center, Community Events, Public Art, Festivals, Local Markets |
| Ferguson Marketplace | Vibrant shopping and dining area that attracts both locals and visitors. Ideal for those who enjoy food, shopping, and entertainment. | Shopping Outlets, Restaurants and Cafes, Local Events, Family Entertainment Centers, Festivals |
| West Ferguson | Quiet residential area with a tight-knit community feel. Attractive for long-term stays and those wanting peace and quiet away from busy tourist areas. | Community Parks, Local Schools, Neighborhood Events, Quiet Streets, Walking Trails |
| Central Ferguson | Offers a mix of residential living and business opportunities. Convenient for visitors looking to be close to various attractions and services. | Local Shops, Restaurants, Public Transport Access, Community Events, Parks |
| Ferguson Arts District | A hub for creativity and local culture, attracting artists and art enthusiasts. Ideal for visitors seeking a unique artistic experience. | Art Studios, Performance Spaces, Art Exhibitions, Cultural Events, Local Cafes |
Understanding Airbnb License Requirements & STR Laws in Ferguson (2026)
While Ferguson, North Carolina, United States currently shows low STR regulations, specific Airbnb license requirements might still exist or change. Always verify the latest short term rental regulations and Airbnb license requirements directly with local government authorities for Ferguson to ensure full compliance before hosting.
(Source: AirROI data, 2026, finding no licensed listings among those analyzed)
Top Performing Airbnb Properties in Ferguson (2026)
Benchmark your potential! Explore examples of top-performing Airbnb properties in Fergusonbased on Trailing Twelve Month (TTM) revenue. Analyze their characteristics, revenue, occupancy rate, and ADR to understand what drives success in this market.

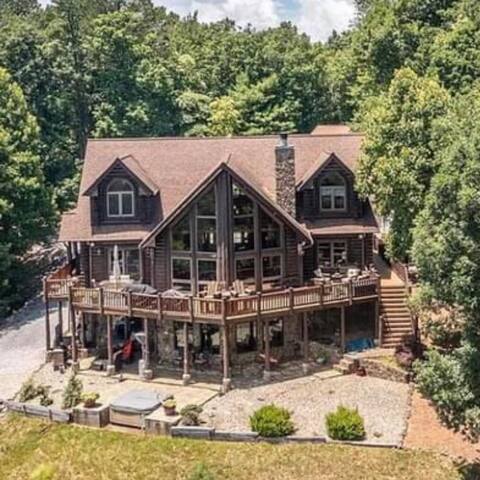
Magnificent Cabin: Summit at Blue Ridge
Entire Place • 4 bedrooms

Peaceful Horizons: Pool Table, Hot Tub, Spa Tub
Entire Place • 3 bedrooms
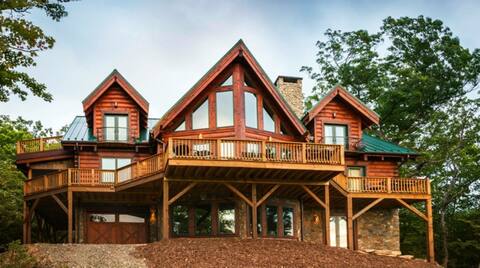
Trinity Lodge: Hot Tub, Views, Jacuzzi, Wifi
Entire Place • 5 bedrooms
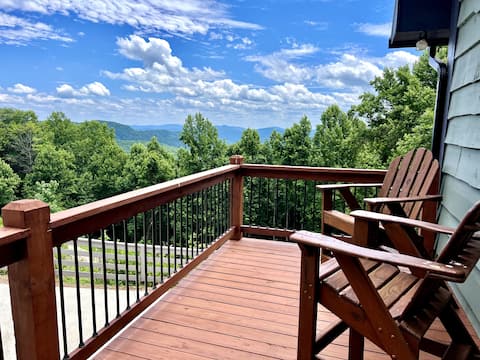
Bliss Mountain: Luxury Cabin, Pool Table, Views
Entire Place • 5 bedrooms
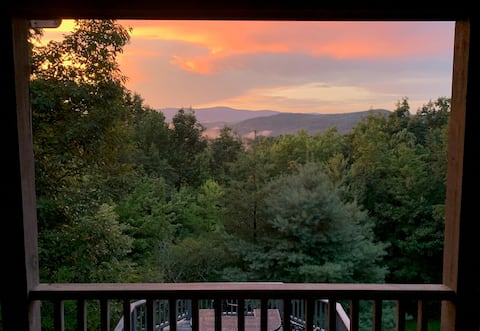
Romantic Luxury Cabin
Entire Place • 1 bedroom
Great Dane: Pet Friendly Mtn Top Cabin, SmartTVs
Entire Place • 4 bedrooms
Note: Performance varies based on location, size, amenities, seasonality, and management quality. Data reflects the past 12 months.
Top Performing Airbnb Hosts in Ferguson (2026)
Learn from the best! This table showcases top-performing Airbnb hosts in Ferguson based on the number of properties managed and estimated total revenue over the past year. Analyze their scale and performance metrics.
| Host Name | Properties | Grossing Revenue | Stay Reviews | Avg Rating |
|---|---|---|---|---|
| Abbie | 33 | $974,629 | 156 | 4.85/5.0 |
| Mary | 3 | $88,960 | 136 | 4.85/5.0 |
| Barbara | 1 | $74,928 | 51 | 4.98/5.0 |
| Stephanie | 1 | $52,345 | 68 | 4.99/5.0 |
| Alyson | 1 | $48,581 | 10 | 5.00/5.0 |
| Oasis Rental Properties | 1 | $40,768 | 26 | 5.00/5.0 |
| Wendy | 1 | $21,602 | 138 | 4.93/5.0 |
| Margaret | 1 | $12,545 | 65 | 4.91/5.0 |
| Nanette | 1 | $540 | 2 | Not Rated |
Analyzing the strategies of top hosts, such as their property selection, pricing, and guest communication, can offer valuable lessons for optimizing your own Airbnb operations in Ferguson.
Dive Deeper: Advanced Ferguson STR Market Data (2026)
Ready to unlock more insights? AirROI provides access to advanced metrics and comprehensive Airbnb data for Ferguson. Explore detailed analytics beyond this report to refine your investment strategy, optimize pricing, and maximize your vacation rental profits.
Explore Advanced MetricsFerguson Short-Term Rental Market Composition (2026): Property & Room Types
Room Type Distribution
Property Type Distribution
Market Composition Insights for Ferguson
- The Ferguson Airbnb market composition is heavily skewed towards Entire Home/Apt listings, which make up 100% of the 43 active rentals. This indicates strong guest preference for privacy and space.
- Looking at the property type distribution in Ferguson, Outdoor/Unique properties are the most common (90.7%), reflecting the local real estate landscape.
- Smaller segments like unique stays (combined 2.3%) offer potential for unique stay experiences.
Ferguson Airbnb Room Capacity Analysis (2026): Bedroom Distribution
Distribution of Listings by Number of Bedrooms
Room Capacity Insights for Ferguson
- The dominant room capacity in Ferguson is 3 bedrooms listings, making up 55.8% of the market. This suggests a strong demand for properties suitable for families or small groups.
- Together, 3 bedrooms and 2 bedrooms properties represent 81.4% of the active Airbnb listings in Ferguson, indicating a high concentration in these sizes.
- A significant 67.5% of listings offer 3+ bedrooms, catering to larger groups and families seeking more space in Ferguson.
Ferguson Vacation Rental Guest Capacity Trends (2026)
Distribution of Listings by Guest Capacity
Guest Capacity Insights for Ferguson
- The most common guest capacity trend in Ferguson vacation rentals is listings accommodating 8+ guests (34.9%). This suggests the primary traveler segment is likely larger groups.
- Properties designed for 8+ guests and 6 guests dominate the Ferguson STR market, accounting for 62.8% of listings.
- 67.5% of properties accommodate 6+ guests, serving the market segment for larger families or group travel in Ferguson.
- On average, properties in Ferguson are equipped to host 6.1 guests.
Ferguson Airbnb Booking Patterns (2026): Available vs. Booked Days
Available Days Distribution
Booked Days Distribution
Booking Pattern Insights for Ferguson
- The most common availability pattern in Ferguson falls within the 271-366 days range, representing 62.8% of listings. This suggests many properties have significant open periods on their calendars.
- Approximately 97.7% of listings show high availability (181+ days open annually), indicating potential for increased bookings or specific owner usage patterns.
- For booked days, the 31-90 days range is most frequent in Ferguson (46.5%), reflecting common guest stay durations or potential owner blocking patterns.
- A notable 4.7% of properties secure long booking periods (181+ days booked per year), highlighting successful long-term rental strategies or significant owner usage.
Ferguson Airbnb Minimum Stay Requirements Analysis
Distribution of Listings by Minimum Night Requirement
1 Night
1 listings
2.3% of total
2 Nights
39 listings
90.7% of total
30+ Nights
3 listings
7% of total
Key Insights
- The most prevalent minimum stay requirement in Ferguson is 2 Nights, adopted by 90.7% of listings. This highlights the market's preference for shorter, flexible bookings.
- A strong majority (93.0%) of the Ferguson Airbnb data shows acceptance of very short stays (1-2 nights), indicating a dynamic, high-turnover market.
Recommendations
- Align with the market by considering a 2 Nights minimum stay, as 90.7% of Ferguson hosts use this setting.
- If feasible, allowing 1-night stays, especially midweek or during low season, could capture last-minute bookings, as only 2.3% currently do.
- A 2-night minimum appears standard (90.7%). Consider this for weekends or peak periods.
- Explore offering discounts for stays of 30+ nights to attract the 7% of the market seeking extended stays.
- Adjust minimum nights based on seasonality – potentially shorter during low season and longer during peak demand periods in Ferguson.
Ferguson Airbnb Cancellation Policy Trends Analysis (2026)
Super Strict 30 Days
33 listings
76.7% of total
Flexible
4 listings
9.3% of total
Moderate
2 listings
4.7% of total
Firm
3 listings
7% of total
Strict
1 listings
2.3% of total
Cancellation Policy Insights for Ferguson
- The prevailing Airbnb cancellation policy trend in Ferguson is Super Strict 30 Days, used by 76.7% of listings.
- There's a relatively balanced mix between guest-friendly (14.0%) and stricter (9.3%) policies, offering choices for different guest needs.
- Strict cancellation policies are quite rare (2.3%), potentially making listings with this policy less competitive unless justified by high demand or property type.
Recommendations for Hosts
- Consider adopting a Super Strict 30 Days policy to align with the 76.7% market standard in Ferguson.
- Using a Strict policy might deter some guests, as only 2.3% of listings use it. Evaluate if potential revenue protection outweighs possible lower booking rates.
- Regularly review your cancellation policy against competitors and market demand shifts in Ferguson.
Ferguson STR Booking Lead Time Analysis (2026)
Average Booking Lead Time by Month
Booking Lead Time Insights for Ferguson
- The overall average booking lead time for vacation rentals in Ferguson is 85 days.
- Guests book furthest in advance for stays during October (average 140 days), likely coinciding with peak travel demand or local events.
- The shortest booking windows occur for stays in February (average 25 days), indicating more last-minute travel plans during this time.
- Seasonally, Fall (113 days avg.) sees the longest lead times, while Summer (61 days avg.) has the shortest, reflecting typical travel planning cycles.
Recommendations for Hosts
- Use the overall average lead time (85 days) as a baseline for your pricing and availability strategy in Ferguson.
- For October stays, consider implementing length-of-stay discounts or slightly higher rates for bookings made less than 140 days out to capitalize on advance planning.
- Target marketing efforts for the Fall season well in advance (at least 113 days) to capture early planners.
- Monitor your own booking lead times against these Ferguson averages to identify opportunities for dynamic pricing adjustments.
Popular & Essential Airbnb Amenities in Ferguson (2026)
Amenity Prevalence
Amenity Insights for Ferguson
- Essential amenities in Ferguson that guests expect include: Free parking on premises, BBQ grill, Washer, Air conditioning, Carbon monoxide alarm, Kitchen, Wifi, Smoke alarm, Oven, Wine glasses. Lacking these (any) could significantly impact bookings.
Recommendations for Hosts
- Ensure your listing includes all essential amenities for Ferguson: Free parking on premises, BBQ grill, Washer, Air conditioning, Carbon monoxide alarm, Kitchen, Wifi, Smoke alarm, Oven, Wine glasses.
- Prioritize adding missing essentials: Washer, Air conditioning, Carbon monoxide alarm, Kitchen, Wifi, Smoke alarm, Oven, Wine glasses.
- Highlight unique or less common amenities you offer (e.g., hot tub, dedicated workspace, EV charger) in your listing description and photos.
- Regularly check competitor amenities in Ferguson to stay competitive.
Ferguson Airbnb Guest Demographics & Profile Analysis (2026)
Guest Profile Summary for Ferguson
- The typical guest profile for Airbnb in Ferguson consists of primarily domestic travelers (100%), often arriving from nearby Durham, typically belonging to the Post-2000s (Gen Z/Alpha) group (50%), primarily speaking English or Spanish.
- Domestic travelers account for 100.0% of guests.
- Top languages spoken are English (73.7%) followed by Spanish (10.5%).
- A significant demographic segment is the Post-2000s (Gen Z/Alpha) group, representing 50% of guests.
Recommendations for Hosts
- Target domestic marketing efforts towards travelers from Durham and Charlotte.
- Tailor amenities and listing descriptions to appeal to the dominant Post-2000s (Gen Z/Alpha) demographic (e.g., highlight fast WiFi, smart home features, local guides).
- Highlight unique local experiences or amenities relevant to the primary guest profile.
- Consider seasonal promotions aligned with peak travel times for key origin markets.
Nearby Short-Term Rental Market Comparison
How does the Ferguson Airbnb market stack up against its neighbors? Compare key performance metrics like average monthly revenue, ADR, and occupancy rates in surrounding areas to understand the broader regional STR landscape.
| Market | Active Properties | Monthly Revenue | Daily Rate | Avg. Occupancy |
|---|---|---|---|---|
| Denver | 109 | $6,309 | $590.96 | 45% |
| Catawba | 16 | $6,093 | $582.49 | 38% |
| Mooresville | 369 | $5,702 | $559.93 | 42% |
| Sherrills Ford | 107 | $5,615 | $547.26 | 41% |
| Troutman | 49 | $5,587 | $467.90 | 42% |
| Lake Norman of Catawba | 51 | $4,972 | $513.30 | 43% |
| Union Mills | 15 | $4,938 | $442.76 | 41% |
| Blacksburg | 297 | $4,116 | $509.14 | 40% |
| Fletcher | 113 | $3,859 | $333.95 | 46% |
| Buncombe County | 13 | $3,849 | $317.20 | 45% |