Denver Airbnb Market Analysis 2026: Short Term Rental Data & Vacation Rental Statistics in North Carolina, United States
Is Airbnb profitable in Denver in 2026? Explore comprehensive Airbnb analytics for Denver, North Carolina, United States to uncover income potential. This 2026 STR market report for Denver, based on AirROI data from February 2025 to January 2026, reveals key trends in the niche market of 109 active listings.
Whether you're considering an Airbnb investment in Denver, optimizing your existing vacation rental, or exploring rental arbitrage opportunities, understanding the Denver Airbnb data is crucial. Leveraging the low regulation environment is key to maximizing your short term rental income potential. Let's dive into the specifics.
Key Denver Airbnb Performance Metrics Overview
Monthly Airbnb Revenue Variations & Income Potential in Denver (2026)
Understanding the monthly revenue variations for Airbnb listings in Denver is key to maximizing your short term rental income potential. Seasonality significantly impacts earnings. Our analysis, based on data from the past 12 months, shows that the peak revenue month for STRs in Denver is typically July, while February often presents the lowest earnings, highlighting opportunities for strategic pricing adjustments during shoulder and low seasons. Explore the typical Airbnb income in Denver across different performance tiers:
- Best-in-class properties (Top 10%) achieve $18,130+ monthly, often utilizing dynamic pricing and superior guest experiences.
- Strong performing properties (Top 25%) earn $10,357 or more, indicating effective management and desirable locations/amenities.
- Typical properties (Median) generate around $4,999 per month, representing the average market performance.
- Entry-level properties (Bottom 25%) see earnings around $2,169, often with potential for optimization.
Average Monthly Airbnb Earnings Trend in Denver
Denver Airbnb Occupancy Rate Trends (2026)
Maximize your bookings by understanding the Denver STR occupancy trends. Seasonal demand shifts significantly influence how often properties are booked. Typically, Julysees the highest demand (peak season occupancy), while January experiences the lowest (low season). Effective strategies, like adjusting minimum stays or offering promotions, can boost occupancy during slower periods. Here's how different property tiers perform in Denver:
- Best-in-class properties (Top 10%) achieve 81%+ occupancy, indicating high desirability and potentially optimized availability.
- Strong performing properties (Top 25%) maintain 64% or higher occupancy, suggesting good market fit and guest satisfaction.
- Typical properties (Median) have an occupancy rate around 42%.
- Entry-level properties (Bottom 25%) average 26% occupancy, potentially facing higher vacancy.
Average Monthly Occupancy Rate Trend in Denver
Average Daily Rate (ADR) Airbnb Trends in Denver (2026)
Effective short term rental pricing strategy in Denver involves understanding monthly ADR fluctuations. The Average Daily Rate (ADR) for Airbnb in Denver typically peaks in June and dips lowest during February. Leveraging Airbnb dynamic pricing tools or strategies based on this seasonality can significantly boost revenue. Here's a look at the typical nightly rates achieved:
- Best-in-class properties (Top 10%) command rates of $1,206+ per night, often due to premium features or locations.
- Strong performing properties (Top 25%) achieve nightly rates of $775 or more.
- Typical properties (Median) charge around $439 per night.
- Entry-level properties (Bottom 25%) earn around $180 per night.
Average Daily Rate (ADR) Trend by Month in Denver
Get Live Denver Market Intelligence 👇

Explore Real-time Analytics
Airbnb Seasonality Analysis & Trends in Denver (2026)
Peak Season (July, June, August)
- Revenue averages $12,124 per month
- Occupancy rates average 55.7%
- Daily rates average $658
Shoulder Season
- Revenue averages $6,790 per month
- Occupancy maintains around 43.1%
- Daily rates hold near $565
Low Season (January, February, March)
- Revenue drops to average $4,498 per month
- Occupancy decreases to average 38.0%
- Daily rates adjust to average $486
Seasonality Insights for Denver
- The Airbnb seasonality in Denver shows highly seasonal trends requiring careful strategy. While the sections above show seasonal averages, it's also insightful to look at the extremes:
- During the high season, the absolute peak month showcases Denver's highest earning potential, with monthly revenues capable of climbing to $13,866, occupancy reaching a high of 62.3%, and ADRs peaking at $675.
- Conversely, the slowest single month of the year, typically falling within the low season, marks the market's lowest point. In this month, revenue might dip to $3,472, occupancy could drop to 33.5%, and ADRs may adjust down to $463.
- Understanding both the seasonal averages and these monthly peaks and troughs in revenue, occupancy, and ADR is crucial for maximizing your Airbnb profit potential in Denver.
Seasonal Strategies for Maximizing Profit
- Peak Season: Maximize revenue through premium pricing and potentially longer minimum stays. Ensure high availability.
- Low Season: Offer competitive pricing, special promotions (e.g., extended stay discounts), and flexible cancellation policies. Target off-season travelers like remote workers or budget-conscious guests.
- Shoulder Seasons: Implement dynamic pricing that balances peak and low rates. Target weekend travelers or specific events. Offer slightly more flexible terms than peak season.
- Regularly analyze your own performance against these Denver seasonality benchmarks and adjust your pricing and availability strategy accordingly.
Best Areas for Airbnb Investment in Denver (2026)
Exploring the top neighborhoods for short-term rentals in Denver? This section highlights key areas, outlining why they are attractive for hosts and guests, along with notable local attractions. Consider these locations based on your target guest profile and investment strategy.
| Neighborhood / Area | Why Host Here? (Target Guests & Appeal) | Key Attractions & Landmarks |
|---|---|---|
| Lake Norman | A popular destination for water recreation, Lake Norman attracts families and tourists looking for a lakefront experience, with ample boating, fishing, and hiking opportunities. | Lake Norman State Park, Duke Energy Explorium, Boating on Lake Norman, Fishing Charters, Water Sports on the Lake |
| Downtown Denver | Although it's the city center of Denver, Denver's Downtown area offers a unique charm, making it a great investment for those interested in urban hospitality. Its vibrant nightlife and cultural scene attract many visitors. | Union Station, Denver Art Museum, Coors Field, 16th Street Mall, LoDo District |
| Highlands | The Highlands neighborhood is known for its trendy restaurants and picturesque views of the Denver skyline. This area appeals to younger travelers looking for an urban experience with a local feel. | Sloan's Lake Park, Highlands Square, Little Man Ice Cream, Restaurants and bars along 32nd Avenue, Shopping boutiques |
| Five Points | Home to a rich cultural heritage, Five Points is known for its jazz history and vibrant arts scene, attracting those interested in culture and music. | Colfax Avenue, Five Points Jazz Festival, Local Art Galleries, Historic Sites, Restaurants with live music |
| Capitol Hill | As one of Denver's oldest neighborhoods, Capitol Hill hosts beautiful Victorian mansions and a bohemian atmosphere, drawing visitors interested in history and nightlife. | Colorado State Capitol, Molly Brown House Museum, Music Venues, Restaurants and Cafes, Capitol Park |
| Cherry Creek | Known for its upscale shopping and dining, Cherry Creek is a high-end area that attracts affluent visitors and those looking for luxury accommodations. | Cherry Creek Shopping Center, Cherry Creek State Park, Galleries and Art Shops, Fine Dining Restaurants, Outdoor Activities |
| Union Station | A historic landmark and transportation hub, Union Station is a great area for visitors looking for accessibility and a vibrant atmosphere just steps from dining and entertainment options. | Restaurants and Bars, Historical Tours, Shopping, Events and Festivals, Easy Access to Public Transport |
| Washington Park | A residential neighborhood boasting a large park with walking trails and beautiful gardens, appealing to families and those seeking outdoor activities close to the city. | Washington Park, Outdoor Recreation, Local Cafes, Community Events, Scenic Views |
Understanding Airbnb License Requirements & STR Laws in Denver (2026)
While Denver, North Carolina, United States currently shows low STR regulations, specific Airbnb license requirements might still exist or change. Always verify the latest short term rental regulations and Airbnb license requirements directly with local government authorities for Denver to ensure full compliance before hosting.
(Source: AirROI data, 2026, finding no licensed listings among those analyzed)
Top Performing Airbnb Properties in Denver (2026)
Benchmark your potential! Explore examples of top-performing Airbnb properties in Denverbased on Trailing Twelve Month (TTM) revenue. Analyze their characteristics, revenue, occupancy rate, and ADR to understand what drives success in this market.
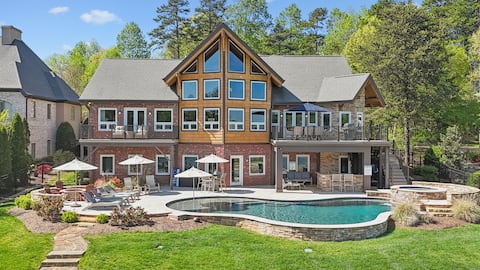
Large Craftsman Style Home with pool & hot tub
Entire Place • 6 bedrooms

Private Dock, Boat Ramp, Saltwater Pool & Fire Pit
Entire Place • 5 bedrooms

Port Royale Stunning 180° Lake Views w/HugeDock
Entire Place • 8 bedrooms

Fox Run
Entire Place • 5 bedrooms

Modern Masterpiece - AvantStay | Waterfront + Dock
Entire Place • 6 bedrooms
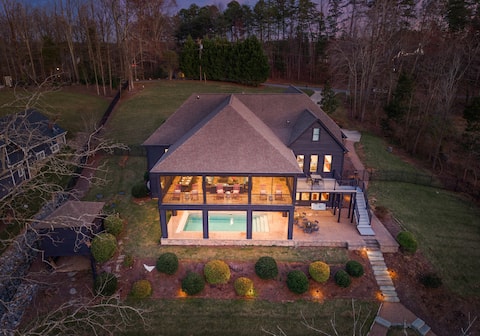
The Retreat- Indoor/ Outdoor Pool
Entire Place • 5 bedrooms
Note: Performance varies based on location, size, amenities, seasonality, and management quality. Data reflects the past 12 months.
Top Performing Airbnb Hosts in Denver (2026)
Learn from the best! This table showcases top-performing Airbnb hosts in Denver based on the number of properties managed and estimated total revenue over the past year. Analyze their scale and performance metrics.
| Host Name | Properties | Grossing Revenue | Stay Reviews | Avg Rating |
|---|---|---|---|---|
| AvantStay Lake Norman | 11 | $1,792,865 | 230 | 4.84/5.0 |
| Southern Charm Retreats | 8 | $969,797 | 94 | 4.86/5.0 |
| Carolina | 6 | $806,154 | 86 | 4.99/5.0 |
| Shari | 4 | $583,396 | 15 | 4.95/5.0 |
| Evoke | 1 | $253,618 | 36 | 4.94/5.0 |
| Wishlist | 3 | $248,742 | 96 | 4.98/5.0 |
| Ryley | 4 | $225,635 | 53 | 4.93/5.0 |
| Casey | 2 | $222,450 | 51 | 4.99/5.0 |
| Timothy | 1 | $161,556 | 43 | 5.00/5.0 |
| Riley | 1 | $158,254 | 1 | Not Rated |
Analyzing the strategies of top hosts, such as their property selection, pricing, and guest communication, can offer valuable lessons for optimizing your own Airbnb operations in Denver.
Dive Deeper: Advanced Denver STR Market Data (2026)
Ready to unlock more insights? AirROI provides access to advanced metrics and comprehensive Airbnb data for Denver. Explore detailed analytics beyond this report to refine your investment strategy, optimize pricing, and maximize your vacation rental profits.
Explore Advanced MetricsDenver Short-Term Rental Market Composition (2026): Property & Room Types
Room Type Distribution
Property Type Distribution
Market Composition Insights for Denver
- The Denver Airbnb market composition is heavily skewed towards Entire Home/Apt listings, which make up 89.9% of the 109 active rentals. This indicates strong guest preference for privacy and space.
- Looking at the property type distribution in Denver, House properties are the most common (90.8%), reflecting the local real estate landscape.
- Houses represent a significant 90.8% portion, catering likely to families or larger groups.
- Smaller segments like hotel/boutique, outdoor/unique, others, apartment/condo (combined 9.2%) offer potential for unique stay experiences.
Denver Airbnb Room Capacity Analysis (2026): Bedroom Distribution
Distribution of Listings by Number of Bedrooms
Room Capacity Insights for Denver
- The dominant room capacity in Denver is 5+ bedrooms listings, making up 37.6% of the market. This suggests a strong demand for properties suitable for families or small groups.
- Together, 5+ bedrooms and 3 bedrooms properties represent 57.8% of the active Airbnb listings in Denver, indicating a high concentration in these sizes.
- A significant 75.2% of listings offer 3+ bedrooms, catering to larger groups and families seeking more space in Denver.
Denver Vacation Rental Guest Capacity Trends (2026)
Distribution of Listings by Guest Capacity
Guest Capacity Insights for Denver
- The most common guest capacity trend in Denver vacation rentals is listings accommodating 8+ guests (64.2%). This suggests the primary traveler segment is likely larger groups.
- Properties designed for 8+ guests and 6 guests dominate the Denver STR market, accounting for 75.2% of listings.
- 78.0% of properties accommodate 6+ guests, serving the market segment for larger families or group travel in Denver.
- On average, properties in Denver are equipped to host 6.4 guests.
Denver Airbnb Booking Patterns (2026): Available vs. Booked Days
Available Days Distribution
Booked Days Distribution
Booking Pattern Insights for Denver
- The most common availability pattern in Denver falls within the 181-270 days range, representing 45% of listings. This suggests many properties have significant open periods on their calendars.
- Approximately 76.2% of listings show high availability (181+ days open annually), indicating potential for increased bookings or specific owner usage patterns.
- For booked days, the 91-180 days range is most frequent in Denver (44%), reflecting common guest stay durations or potential owner blocking patterns.
- A notable 27.5% of properties secure long booking periods (181+ days booked per year), highlighting successful long-term rental strategies or significant owner usage.
Denver Airbnb Minimum Stay Requirements Analysis
Distribution of Listings by Minimum Night Requirement
1 Night
6 listings
5.5% of total
2 Nights
17 listings
15.6% of total
3 Nights
9 listings
8.3% of total
4-6 Nights
6 listings
5.5% of total
7-29 Nights
7 listings
6.4% of total
30+ Nights
64 listings
58.7% of total
Key Insights
- The most prevalent minimum stay requirement in Denver is 30+ Nights, adopted by 58.7% of listings. This highlights the market's preference for longer commitments.
- A significant segment (58.7%) caters to monthly stays (30+ nights) in Denver, pointing to opportunities in the extended-stay market.
Recommendations
- Align with the market by considering a 30+ Nights minimum stay, as 58.7% of Denver hosts use this setting.
- If feasible, allowing 1-night stays, especially midweek or during low season, could capture last-minute bookings, as only 5.5% currently do.
- Explore offering discounts for stays of 30+ nights to attract the 58.7% of the market seeking extended stays.
- Adjust minimum nights based on seasonality – potentially shorter during low season and longer during peak demand periods in Denver.
Denver Airbnb Cancellation Policy Trends Analysis (2026)
Limited
6 listings
5.5% of total
Super Strict 60 Days
11 listings
10.1% of total
Super Strict 30 Days
2 listings
1.8% of total
Flexible
20 listings
18.3% of total
Moderate
11 listings
10.1% of total
Firm
53 listings
48.6% of total
Strict
6 listings
5.5% of total
Cancellation Policy Insights for Denver
- The prevailing Airbnb cancellation policy trend in Denver is Firm, used by 48.6% of listings.
- A majority (54.1%) of hosts in Denver utilize Firm or Strict policies, indicating a market where hosts prioritize booking security.
- Strict cancellation policies are quite rare (5.5%), potentially making listings with this policy less competitive unless justified by high demand or property type.
Recommendations for Hosts
- Consider adopting a Firm policy to align with the 48.6% market standard in Denver.
- Using a Strict policy might deter some guests, as only 5.5% of listings use it. Evaluate if potential revenue protection outweighs possible lower booking rates.
- Regularly review your cancellation policy against competitors and market demand shifts in Denver.
Denver STR Booking Lead Time Analysis (2026)
Average Booking Lead Time by Month
Booking Lead Time Insights for Denver
- The overall average booking lead time for vacation rentals in Denver is 50 days.
- Guests book furthest in advance for stays during July (average 69 days), likely coinciding with peak travel demand or local events.
- The shortest booking windows occur for stays in February (average 19 days), indicating more last-minute travel plans during this time.
- Seasonally, Summer (67 days avg.) sees the longest lead times, while Winter (29 days avg.) has the shortest, reflecting typical travel planning cycles.
Recommendations for Hosts
- Use the overall average lead time (50 days) as a baseline for your pricing and availability strategy in Denver.
- For July stays, consider implementing length-of-stay discounts or slightly higher rates for bookings made less than 69 days out to capitalize on advance planning.
- Target marketing efforts for the Summer season well in advance (at least 67 days) to capture early planners.
- Monitor your own booking lead times against these Denver averages to identify opportunities for dynamic pricing adjustments.
Popular & Essential Airbnb Amenities in Denver (2026)
Amenity Prevalence
Amenity Insights for Denver
- Essential amenities in Denver that guests expect include: Air conditioning, Wifi, TV, Free parking on premises, Smoke alarm, Heating, Kitchen, Hot water, Washer, Dishes and silverware. Lacking these (any) could significantly impact bookings.
Recommendations for Hosts
- Ensure your listing includes all essential amenities for Denver: Air conditioning, Wifi, TV, Free parking on premises, Smoke alarm, Heating, Kitchen, Hot water, Washer, Dishes and silverware.
- Prioritize adding missing essentials: Free parking on premises, Smoke alarm, Heating, Kitchen, Hot water, Washer, Dishes and silverware.
- Highlight unique or less common amenities you offer (e.g., hot tub, dedicated workspace, EV charger) in your listing description and photos.
- Regularly check competitor amenities in Denver to stay competitive.
Denver Airbnb Guest Demographics & Profile Analysis (2026)
Guest Profile Summary for Denver
- The typical guest profile for Airbnb in Denver consists of primarily domestic travelers (96%), often arriving from nearby Charlotte, typically belonging to the Post-2000s (Gen Z/Alpha) group (50%), primarily speaking English or Spanish.
- Domestic travelers account for 95.9% of guests.
- Key international markets include United States (95.9%) and DC (1.1%).
- Top languages spoken are English (79.4%) followed by Spanish (8.2%).
- A significant demographic segment is the Post-2000s (Gen Z/Alpha) group, representing 50% of guests.
Recommendations for Hosts
- Target domestic marketing efforts towards travelers from Charlotte and Huntersville.
- Tailor amenities and listing descriptions to appeal to the dominant Post-2000s (Gen Z/Alpha) demographic (e.g., highlight fast WiFi, smart home features, local guides).
- Highlight unique local experiences or amenities relevant to the primary guest profile.
- Consider seasonal promotions aligned with peak travel times for key origin markets.
Nearby Short-Term Rental Market Comparison
How does the Denver Airbnb market stack up against its neighbors? Compare key performance metrics like average monthly revenue, ADR, and occupancy rates in surrounding areas to understand the broader regional STR landscape.
| Market | Active Properties | Monthly Revenue | Daily Rate | Avg. Occupancy |
|---|---|---|---|---|
| Catawba | 16 | $6,093 | $582.49 | 38% |
| Mooresville | 369 | $5,702 | $559.93 | 42% |
| Sherrills Ford | 107 | $5,615 | $547.26 | 41% |
| Troutman | 49 | $5,587 | $467.90 | 42% |
| Lake Norman of Catawba | 51 | $4,972 | $513.30 | 43% |
| Chapin | 93 | $3,971 | $386.37 | 43% |
| Semora | 50 | $3,408 | $377.45 | 38% |
| Watauga County | 47 | $3,370 | $314.71 | 39% |
| Nebo | 88 | $3,330 | $381.79 | 34% |
| Blowing Rock | 426 | $3,209 | $339.38 | 38% |