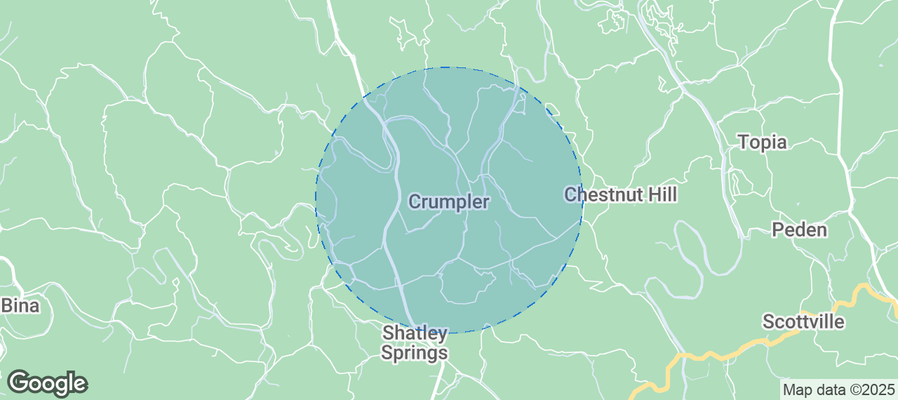
Crumpler Airbnb Market Analysis 2026: Short Term Rental Data & Vacation Rental Statistics in North Carolina, United States
Is Airbnb profitable in Crumpler in 2026? Explore comprehensive Airbnb analytics for Crumpler, North Carolina, United States to uncover income potential. This 2026 STR market report for Crumpler, based on AirROI data from February 2025 to January 2026, reveals key trends in the niche market of 30 active listings.
Whether you're considering an Airbnb investment in Crumpler, optimizing your existing vacation rental, or exploring rental arbitrage opportunities, understanding the Crumpler Airbnb data is crucial. Leveraging the low regulation environment is key to maximizing your short term rental income potential. Let's dive into the specifics.
Key Crumpler Airbnb Performance Metrics Overview
Monthly Airbnb Revenue Variations & Income Potential in Crumpler (2026)
Understanding the monthly revenue variations for Airbnb listings in Crumpler is key to maximizing your short term rental income potential. Seasonality significantly impacts earnings. Our analysis, based on data from the past 12 months, shows that the peak revenue month for STRs in Crumpler is typically July, while February often presents the lowest earnings, highlighting opportunities for strategic pricing adjustments during shoulder and low seasons. Explore the typical Airbnb income in Crumpler across different performance tiers:
- Best-in-class properties (Top 10%) achieve $3,637+ monthly, often utilizing dynamic pricing and superior guest experiences.
- Strong performing properties (Top 25%) earn $2,789 or more, indicating effective management and desirable locations/amenities.
- Typical properties (Median) generate around $1,747 per month, representing the average market performance.
- Entry-level properties (Bottom 25%) see earnings around $988, often with potential for optimization.
Average Monthly Airbnb Earnings Trend in Crumpler
Crumpler Airbnb Occupancy Rate Trends (2026)
Maximize your bookings by understanding the Crumpler STR occupancy trends. Seasonal demand shifts significantly influence how often properties are booked. Typically, Julysees the highest demand (peak season occupancy), while January experiences the lowest (low season). Effective strategies, like adjusting minimum stays or offering promotions, can boost occupancy during slower periods. Here's how different property tiers perform in Crumpler:
- Best-in-class properties (Top 10%) achieve 68%+ occupancy, indicating high desirability and potentially optimized availability.
- Strong performing properties (Top 25%) maintain 51% or higher occupancy, suggesting good market fit and guest satisfaction.
- Typical properties (Median) have an occupancy rate around 31%.
- Entry-level properties (Bottom 25%) average 16% occupancy, potentially facing higher vacancy.
Average Monthly Occupancy Rate Trend in Crumpler
Average Daily Rate (ADR) Airbnb Trends in Crumpler (2026)
Effective short term rental pricing strategy in Crumpler involves understanding monthly ADR fluctuations. The Average Daily Rate (ADR) for Airbnb in Crumpler typically peaks in September and dips lowest during March. Leveraging Airbnb dynamic pricing tools or strategies based on this seasonality can significantly boost revenue. Here's a look at the typical nightly rates achieved:
- Best-in-class properties (Top 10%) command rates of $334+ per night, often due to premium features or locations.
- Strong performing properties (Top 25%) achieve nightly rates of $248 or more.
- Typical properties (Median) charge around $169 per night.
- Entry-level properties (Bottom 25%) earn around $140 per night.
Average Daily Rate (ADR) Trend by Month in Crumpler
Get Live Crumpler Market Intelligence 👇
Explore Real-time Analytics
Airbnb Seasonality Analysis & Trends in Crumpler (2026)
Peak Season (July, September, October)
- Revenue averages $2,486 per month
- Occupancy rates average 40.7%
- Daily rates average $209
Shoulder Season
- Revenue averages $2,059 per month
- Occupancy maintains around 36.0%
- Daily rates hold near $202
Low Season (January, February, March)
- Revenue drops to average $1,304 per month
- Occupancy decreases to average 28.3%
- Daily rates adjust to average $192
Seasonality Insights for Crumpler
- The Airbnb seasonality in Crumpler shows highly seasonal trends requiring careful strategy. While the sections above show seasonal averages, it's also insightful to look at the extremes:
- During the high season, the absolute peak month showcases Crumpler's highest earning potential, with monthly revenues capable of climbing to $2,684, occupancy reaching a high of 45.0%, and ADRs peaking at $221.
- Conversely, the slowest single month of the year, typically falling within the low season, marks the market's lowest point. In this month, revenue might dip to $1,169, occupancy could drop to 21.9%, and ADRs may adjust down to $184.
- Understanding both the seasonal averages and these monthly peaks and troughs in revenue, occupancy, and ADR is crucial for maximizing your Airbnb profit potential in Crumpler.
Seasonal Strategies for Maximizing Profit
- Peak Season: Maximize revenue through premium pricing and potentially longer minimum stays. Ensure high availability.
- Low Season: Offer competitive pricing, special promotions (e.g., extended stay discounts), and flexible cancellation policies. Target off-season travelers like remote workers or budget-conscious guests.
- Shoulder Seasons: Implement dynamic pricing that balances peak and low rates. Target weekend travelers or specific events. Offer slightly more flexible terms than peak season.
- Regularly analyze your own performance against these Crumpler seasonality benchmarks and adjust your pricing and availability strategy accordingly.
Best Areas for Airbnb Investment in Crumpler (2026)
Exploring the top neighborhoods for short-term rentals in Crumpler? This section highlights key areas, outlining why they are attractive for hosts and guests, along with notable local attractions. Consider these locations based on your target guest profile and investment strategy.
| Neighborhood / Area | Why Host Here? (Target Guests & Appeal) | Key Attractions & Landmarks |
|---|---|---|
| Blue Ridge Parkway | Famous for its stunning scenic views and outdoor activities, making it ideal for nature lovers and tourists seeking hiking and recreational opportunities. | Blue Ridge Parkway, Moses H. Cone Memorial Park, Julian Price Memorial Park, Linville Falls, Grandfather Mountain |
| Ashe County | Known for its charming small towns, art galleries, and historical sites, this area attracts visitors looking for a quaint stay and local culture. | West Jefferson, Jefferson Mountain, Ashe County Cheese Factory, Cheesemonger’s Shop, Raccoon Holler Art Gallery |
| Canoe Creek Campground | A popular camping and outdoor site along the New River, great for families and campers looking for a nature-centric getaway. | New River, canoeing and kayaking, fishing spots, picnic areas, hiking trails |
| Grayson Highlands State Park | Offers beautiful hiking trails and the chance to see wild ponies, appealing to nature enthusiasts and outdoorsy visitors. | Mount Rogers, Grayson Highlands, Wild Pony Shelter, trails for hiking, scenic overlooks |
| Crumpler Village | A local hub with a community feel, attracting visitors looking for a quiet, rural experience close to nature. | Crumpler Market, local art and crafts, nature trails, scenic drives |
| New River State Park | This park features serene river views and outdoor activities that attract families and nature lovers alike. | New River, camping, hiking trails, fishing, biking paths |
| Todd | A quaint mountain town known for its charming atmosphere, shops, and outdoor activities, making it popular among visitors seeking relaxation. | Todd Island Park, local shops, The River Girl Fishing Company, attractions along the New River |
| West Jefferson | A vibrant small town with artsy vibes and local shops, perfect for visitors who appreciate art, food, and culture. | Arts district, Jefferson Landing, local art galleries, Anvil Studios, Blue Ridge Artisan Guild |
Understanding Airbnb License Requirements & STR Laws in Crumpler (2026)
While Crumpler, North Carolina, United States currently shows low STR regulations, specific Airbnb license requirements might still exist or change. Always verify the latest short term rental regulations and Airbnb license requirements directly with local government authorities for Crumpler to ensure full compliance before hosting.
(Source: AirROI data, 2026, finding no licensed listings among those analyzed)
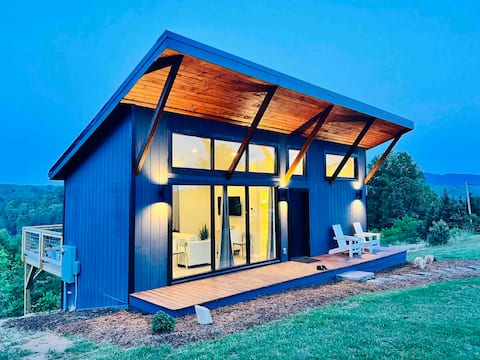
Top Performing Airbnb Properties in Crumpler (2026)
Benchmark your potential! Explore examples of top-performing Airbnb properties in Crumplerbased on Trailing Twelve Month (TTM) revenue. Analyze their characteristics, revenue, occupancy rate, and ADR to understand what drives success in this market.

Pet Friendly NC Cabin with Hot Tub & Views!
Entire Place • 2 bedrooms
Modern Muse
Entire Place • 1 bedroom
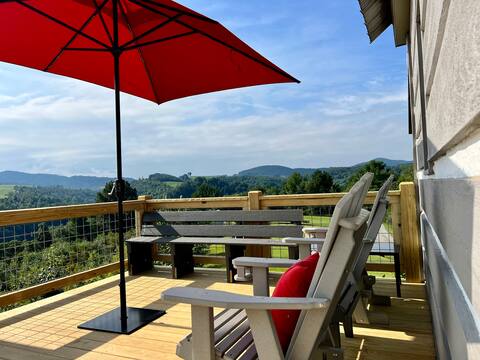
Skyview Retreat | Hot Tub + Long Mountain Views
Entire Place • 3 bedrooms
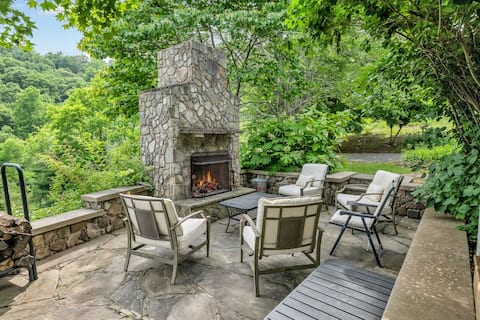
Indoor and Outdoor Fireplaces by Grayson Highlands
Entire Place • 4 bedrooms

Baker's Cottage
Entire Place • 2 bedrooms
Mountain Magic on the New River
Entire Place • 5 bedrooms
Note: Performance varies based on location, size, amenities, seasonality, and management quality. Data reflects the past 12 months.
Top Performing Airbnb Hosts in Crumpler (2026)
Learn from the best! This table showcases top-performing Airbnb hosts in Crumpler based on the number of properties managed and estimated total revenue over the past year. Analyze their scale and performance metrics.
| Host Name | Properties | Grossing Revenue | Stay Reviews | Avg Rating |
|---|---|---|---|---|
| Jerrita | 6 | $80,057 | 85 | 4.85/5.0 |
| Tonya | 2 | $52,045 | 32 | 5.00/5.0 |
| Sherrie | 3 | $40,114 | 52 | 4.73/5.0 |
| Christin | 1 | $36,655 | 87 | 4.94/5.0 |
| Mark | 1 | $35,386 | 159 | 4.94/5.0 |
| High Mountain Cabin Rentals | 2 | $33,444 | 8 | 4.83/5.0 |
| Damon | 1 | $32,924 | 157 | 4.93/5.0 |
| Brandon | 1 | $26,930 | 93 | 4.99/5.0 |
| Marideth | 1 | $25,584 | 22 | 5.00/5.0 |
| Evolve | 1 | $19,932 | 17 | 4.94/5.0 |
Analyzing the strategies of top hosts, such as their property selection, pricing, and guest communication, can offer valuable lessons for optimizing your own Airbnb operations in Crumpler.
Dive Deeper: Advanced Crumpler STR Market Data (2026)
Ready to unlock more insights? AirROI provides access to advanced metrics and comprehensive Airbnb data for Crumpler. Explore detailed analytics beyond this report to refine your investment strategy, optimize pricing, and maximize your vacation rental profits.
Explore Advanced MetricsCrumpler Short-Term Rental Market Composition (2026): Property & Room Types
Room Type Distribution
Property Type Distribution
Market Composition Insights for Crumpler
- The Crumpler Airbnb market composition is heavily skewed towards Entire Home/Apt listings, which make up 100% of the 30 active rentals. This indicates strong guest preference for privacy and space.
- Looking at the property type distribution in Crumpler, Outdoor/Unique properties are the most common (50%), reflecting the local real estate landscape.
- Houses represent a significant 46.7% portion, catering likely to families or larger groups.
- Smaller segments like hotel/boutique (combined 3.3%) offer potential for unique stay experiences.
Crumpler Airbnb Room Capacity Analysis (2026): Bedroom Distribution
Distribution of Listings by Number of Bedrooms
Room Capacity Insights for Crumpler
- The dominant room capacity in Crumpler is 3 bedrooms listings, making up 46.7% of the market. This suggests a strong demand for properties suitable for families or small groups.
- Together, 3 bedrooms and 2 bedrooms properties represent 80.0% of the active Airbnb listings in Crumpler, indicating a high concentration in these sizes.
- A significant 60.1% of listings offer 3+ bedrooms, catering to larger groups and families seeking more space in Crumpler.
Crumpler Vacation Rental Guest Capacity Trends (2026)
Distribution of Listings by Guest Capacity
Guest Capacity Insights for Crumpler
- The most common guest capacity trend in Crumpler vacation rentals is listings accommodating 6 guests (36.7%). This suggests the primary traveler segment is likely larger groups.
- Properties designed for 6 guests and 8+ guests dominate the Crumpler STR market, accounting for 66.7% of listings.
- 76.7% of properties accommodate 6+ guests, serving the market segment for larger families or group travel in Crumpler.
- On average, properties in Crumpler are equipped to host 6.2 guests.
Crumpler Airbnb Booking Patterns (2026): Available vs. Booked Days
Available Days Distribution
Booked Days Distribution
Booking Pattern Insights for Crumpler
- The most common availability pattern in Crumpler falls within the 271-366 days range, representing 63.3% of listings. This suggests many properties have significant open periods on their calendars.
- Approximately 80.0% of listings show high availability (181+ days open annually), indicating potential for increased bookings or specific owner usage patterns.
- For booked days, the 31-90 days range is most frequent in Crumpler (33.3%), reflecting common guest stay durations or potential owner blocking patterns.
- A notable 23.3% of properties secure long booking periods (181+ days booked per year), highlighting successful long-term rental strategies or significant owner usage.
Crumpler Airbnb Minimum Stay Requirements Analysis
Distribution of Listings by Minimum Night Requirement
1 Night
3 listings
10% of total
2 Nights
13 listings
43.3% of total
3 Nights
1 listings
3.3% of total
30+ Nights
13 listings
43.3% of total
Key Insights
- The most prevalent minimum stay requirement in Crumpler is 2 Nights, adopted by 43.3% of listings. This highlights the market's preference for shorter, flexible bookings.
- A significant segment (43.3%) caters to monthly stays (30+ nights) in Crumpler, pointing to opportunities in the extended-stay market.
Recommendations
- Align with the market by considering a 2 Nights minimum stay, as 43.3% of Crumpler hosts use this setting.
- If feasible, allowing 1-night stays, especially midweek or during low season, could capture last-minute bookings, as only 10% currently do.
- A 2-night minimum appears standard (43.3%). Consider this for weekends or peak periods.
- Explore offering discounts for stays of 30+ nights to attract the 43.3% of the market seeking extended stays.
- Adjust minimum nights based on seasonality – potentially shorter during low season and longer during peak demand periods in Crumpler.
Crumpler Airbnb Cancellation Policy Trends Analysis (2026)
Super Strict 30 Days
3 listings
10% of total
Flexible
4 listings
13.3% of total
Moderate
5 listings
16.7% of total
Firm
10 listings
33.3% of total
Strict
8 listings
26.7% of total
Cancellation Policy Insights for Crumpler
- The prevailing Airbnb cancellation policy trend in Crumpler is Firm, used by 33.3% of listings.
- A majority (60.0%) of hosts in Crumpler utilize Firm or Strict policies, indicating a market where hosts prioritize booking security.
Recommendations for Hosts
- Consider adopting a Firm policy to align with the 33.3% market standard in Crumpler.
- Regularly review your cancellation policy against competitors and market demand shifts in Crumpler.
Crumpler STR Booking Lead Time Analysis (2026)
Average Booking Lead Time by Month
Booking Lead Time Insights for Crumpler
- The overall average booking lead time for vacation rentals in Crumpler is 47 days.
- Guests book furthest in advance for stays during October (average 73 days), likely coinciding with peak travel demand or local events.
- The shortest booking windows occur for stays in January (average 16 days), indicating more last-minute travel plans during this time.
- Seasonally, Fall (59 days avg.) sees the longest lead times, while Winter (22 days avg.) has the shortest, reflecting typical travel planning cycles.
Recommendations for Hosts
- Use the overall average lead time (47 days) as a baseline for your pricing and availability strategy in Crumpler.
- For October stays, consider implementing length-of-stay discounts or slightly higher rates for bookings made less than 73 days out to capitalize on advance planning.
- Target marketing efforts for the Fall season well in advance (at least 59 days) to capture early planners.
- Monitor your own booking lead times against these Crumpler averages to identify opportunities for dynamic pricing adjustments.
Popular & Essential Airbnb Amenities in Crumpler (2026)
Amenity Prevalence
Amenity Insights for Crumpler
- Essential amenities in Crumpler that guests expect include: Refrigerator, Kitchen, Heating, Cooking basics, Carbon monoxide alarm, Wifi, Smoke alarm, Dishes and silverware, TV, Microwave. Lacking these (any) could significantly impact bookings.
Recommendations for Hosts
- Ensure your listing includes all essential amenities for Crumpler: Refrigerator, Kitchen, Heating, Cooking basics, Carbon monoxide alarm, Wifi, Smoke alarm, Dishes and silverware, TV, Microwave.
- Prioritize adding missing essentials: Dishes and silverware, TV, Microwave.
- Highlight unique or less common amenities you offer (e.g., hot tub, dedicated workspace, EV charger) in your listing description and photos.
- Regularly check competitor amenities in Crumpler to stay competitive.
Crumpler Airbnb Guest Demographics & Profile Analysis (2026)
Guest Profile Summary for Crumpler
- The typical guest profile for Airbnb in Crumpler consists of primarily domestic travelers (98%), often arriving from nearby Raleigh, typically belonging to the Post-2000s (Gen Z/Alpha) group (50%), primarily speaking English or French.
- Domestic travelers account for 98.4% of guests.
- Key international markets include United States (98.4%) and Morocco (0.8%).
- Top languages spoken are English (88.5%) followed by French (3.8%).
- A significant demographic segment is the Post-2000s (Gen Z/Alpha) group, representing 50% of guests.
Recommendations for Hosts
- Target domestic marketing efforts towards travelers from Raleigh and Greensboro.
- Tailor amenities and listing descriptions to appeal to the dominant Post-2000s (Gen Z/Alpha) demographic (e.g., highlight fast WiFi, smart home features, local guides).
- Highlight unique local experiences or amenities relevant to the primary guest profile.
- Consider seasonal promotions aligned with peak travel times for key origin markets.
Nearby Short-Term Rental Market Comparison
How does the Crumpler Airbnb market stack up against its neighbors? Compare key performance metrics like average monthly revenue, ADR, and occupancy rates in surrounding areas to understand the broader regional STR landscape.
| Market | Active Properties | Monthly Revenue | Daily Rate | Avg. Occupancy |
|---|---|---|---|---|
| Denver | 109 | $6,309 | $590.96 | 45% |
| Catawba | 16 | $6,093 | $582.49 | 38% |
| Mooresville | 369 | $5,702 | $559.93 | 42% |
| Sherrills Ford | 107 | $5,615 | $547.26 | 41% |
| Troutman | 49 | $5,587 | $467.90 | 42% |
| Lake Norman of Catawba | 51 | $4,972 | $513.30 | 43% |
| Union Mills | 15 | $4,938 | $442.76 | 41% |
| Blacksburg | 297 | $4,116 | $509.14 | 40% |
| Fletcher | 113 | $3,859 | $333.95 | 46% |
| Buncombe County | 13 | $3,849 | $317.20 | 45% |