Clyde Airbnb Market Analysis 2026: Short Term Rental Data & Vacation Rental Statistics in North Carolina, United States
Is Airbnb profitable in Clyde in 2026? Explore comprehensive Airbnb analytics for Clyde, North Carolina, United States to uncover income potential. This 2026 STR market report for Clyde, based on AirROI data from February 2025 to January 2026, reveals key trends in the niche market of 87 active listings.
Whether you're considering an Airbnb investment in Clyde, optimizing your existing vacation rental, or exploring rental arbitrage opportunities, understanding the Clyde Airbnb data is crucial. Leveraging the low regulation environment is key to maximizing your short term rental income potential. Let's dive into the specifics.
Key Clyde Airbnb Performance Metrics Overview
Monthly Airbnb Revenue Variations & Income Potential in Clyde (2026)
Understanding the monthly revenue variations for Airbnb listings in Clyde is key to maximizing your short term rental income potential. Seasonality significantly impacts earnings. Our analysis, based on data from the past 12 months, shows that the peak revenue month for STRs in Clyde is typically October, while February often presents the lowest earnings, highlighting opportunities for strategic pricing adjustments during shoulder and low seasons. Explore the typical Airbnb income in Clyde across different performance tiers:
- Best-in-class properties (Top 10%) achieve $6,430+ monthly, often utilizing dynamic pricing and superior guest experiences.
- Strong performing properties (Top 25%) earn $4,109 or more, indicating effective management and desirable locations/amenities.
- Typical properties (Median) generate around $2,296 per month, representing the average market performance.
- Entry-level properties (Bottom 25%) see earnings around $1,214, often with potential for optimization.
Average Monthly Airbnb Earnings Trend in Clyde
Clyde Airbnb Occupancy Rate Trends (2026)
Maximize your bookings by understanding the Clyde STR occupancy trends. Seasonal demand shifts significantly influence how often properties are booked. Typically, Octobersees the highest demand (peak season occupancy), while January experiences the lowest (low season). Effective strategies, like adjusting minimum stays or offering promotions, can boost occupancy during slower periods. Here's how different property tiers perform in Clyde:
- Best-in-class properties (Top 10%) achieve 78%+ occupancy, indicating high desirability and potentially optimized availability.
- Strong performing properties (Top 25%) maintain 55% or higher occupancy, suggesting good market fit and guest satisfaction.
- Typical properties (Median) have an occupancy rate around 33%.
- Entry-level properties (Bottom 25%) average 18% occupancy, potentially facing higher vacancy.
Average Monthly Occupancy Rate Trend in Clyde
Average Daily Rate (ADR) Airbnb Trends in Clyde (2026)
Effective short term rental pricing strategy in Clyde involves understanding monthly ADR fluctuations. The Average Daily Rate (ADR) for Airbnb in Clyde typically peaks in October and dips lowest during February. Leveraging Airbnb dynamic pricing tools or strategies based on this seasonality can significantly boost revenue. Here's a look at the typical nightly rates achieved:
- Best-in-class properties (Top 10%) command rates of $520+ per night, often due to premium features or locations.
- Strong performing properties (Top 25%) achieve nightly rates of $263 or more.
- Typical properties (Median) charge around $181 per night.
- Entry-level properties (Bottom 25%) earn around $132 per night.
Average Daily Rate (ADR) Trend by Month in Clyde
Get Live Clyde Market Intelligence 👇

Explore Real-time Analytics
Airbnb Seasonality Analysis & Trends in Clyde (2026)
Peak Season (October, July, November)
- Revenue averages $4,450 per month
- Occupancy rates average 48.3%
- Daily rates average $299
Shoulder Season
- Revenue averages $3,016 per month
- Occupancy maintains around 35.5%
- Daily rates hold near $272
Low Season (February, May, August)
- Revenue drops to average $2,467 per month
- Occupancy decreases to average 35.2%
- Daily rates adjust to average $241
Seasonality Insights for Clyde
- The Airbnb seasonality in Clyde shows highly seasonal trends requiring careful strategy. While the sections above show seasonal averages, it's also insightful to look at the extremes:
- During the high season, the absolute peak month showcases Clyde's highest earning potential, with monthly revenues capable of climbing to $5,318, occupancy reaching a high of 50.9%, and ADRs peaking at $328.
- Conversely, the slowest single month of the year, typically falling within the low season, marks the market's lowest point. In this month, revenue might dip to $2,255, occupancy could drop to 28.3%, and ADRs may adjust down to $223.
- Understanding both the seasonal averages and these monthly peaks and troughs in revenue, occupancy, and ADR is crucial for maximizing your Airbnb profit potential in Clyde.
Seasonal Strategies for Maximizing Profit
- Peak Season: Maximize revenue through premium pricing and potentially longer minimum stays. Ensure high availability.
- Low Season: Offer competitive pricing, special promotions (e.g., extended stay discounts), and flexible cancellation policies. Target off-season travelers like remote workers or budget-conscious guests.
- Shoulder Seasons: Implement dynamic pricing that balances peak and low rates. Target weekend travelers or specific events. Offer slightly more flexible terms than peak season.
- Regularly analyze your own performance against these Clyde seasonality benchmarks and adjust your pricing and availability strategy accordingly.
Best Areas for Airbnb Investment in Clyde (2026)
Exploring the top neighborhoods for short-term rentals in Clyde? This section highlights key areas, outlining why they are attractive for hosts and guests, along with notable local attractions. Consider these locations based on your target guest profile and investment strategy.
| Neighborhood / Area | Why Host Here? (Target Guests & Appeal) | Key Attractions & Landmarks |
|---|---|---|
| Downtown Clyde | A charming small town atmosphere with historical significance. Ideal for visitors looking for a peaceful retreat close to nature, culture, and local events. | Clyde Historical Museum, Local Art Galleries, Clyde Town Park, Clyde Riverwalk, Nearby Smoky Mountains |
| Lake Junaluska | A serene community known for its beautiful lake and scenic views. Appeals to families and nature lovers seeking outdoor activities and relaxation. | Lake Junaluska Conference and Retreat Center, Junaluska Gardens, Walking Trails, Fishing and Boating, Annual July 4th Celebration |
| Waynesville | A vibrant mountain town with a rich arts scene and numerous festivals. Perfect for those wanting a combination of culture, shopping, and access to the Blue Ridge Parkway. | Downtown Waynesville, Blue Ridge Parkway, Arts and Crafts Festivals, Great Smoky Mountains National Park, Haywood Arts Regional Theatre |
| Cherokee | Located near the Great Smoky Mountains, it offers cultural attractions related to the Cherokee heritage, making it a unique spot for guests wanting to explore Native American history. | Museum of the Cherokee Indian, Oconaluftee Indian Village, Great Smoky Mountains National Park, Harrahs Cherokee Casino, Cherokee Rapids |
| Sylva | Known for its beautiful scenery and local charm, Sylva attracts outdoor enthusiasts and those interested in local culture and history. | Downtown Sylva, Jackson County Public Library, Nantahala National Forest, Richland Balsam Mountain, Fishing on the Tuckasegee River |
| Balsam | A peaceful and picturesque location that provides access to numerous hiking trails and natural beauty, making it perfect for nature lovers. | Balsam Mountain Preserve, Hiking trails, Scenic overlooks, Outdoor camping, Wildlife viewing |
| Maggie Valley | Famous for its stunning mountain scenery and recreational activities, perfect for family trips and adventure seekers year-round. | Maggie Valley Festival Grounds, Ghost Town in the Sky, Smoky Mountain Alpine Coaster, Maggie Valley Opry House, Junaluska Community |
| Pisgah National Forest | Offers breathtaking landscapes and is ideal for guests looking for adventure in a quintessential North Carolina setting, providing outdoor enthusiasts with numerous activities. | Waterfalls, Hiking Trails, Mountain Biking, Camping Areas, Wildlife Watching |
Understanding Airbnb License Requirements & STR Laws in Clyde (2026)
While Clyde, North Carolina, United States currently shows low STR regulations, specific Airbnb license requirements might still exist or change. Always verify the latest short term rental regulations and Airbnb license requirements directly with local government authorities for Clyde to ensure full compliance before hosting.
(Source: AirROI data, 2026, finding no licensed listings among those analyzed)
Top Performing Airbnb Properties in Clyde (2026)
Benchmark your potential! Explore examples of top-performing Airbnb properties in Clydebased on Trailing Twelve Month (TTM) revenue. Analyze their characteristics, revenue, occupancy rate, and ADR to understand what drives success in this market.
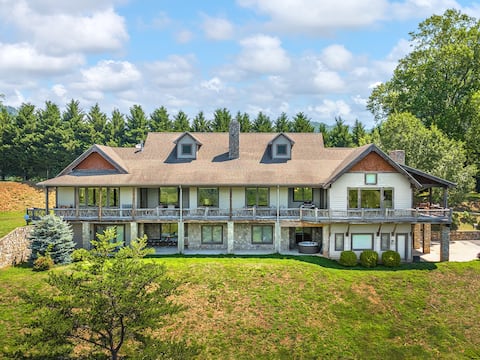
Luxury Mountain Estate • Hot Tub • Panoramic Views
Entire Place • 7 bedrooms
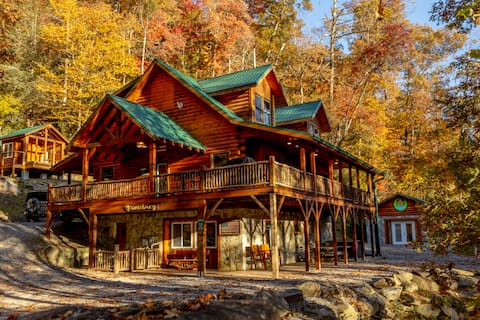
3 Luxury Homes-Riverfront-500 Acres-Group A 10BR’s
Entire Place • 10 bedrooms
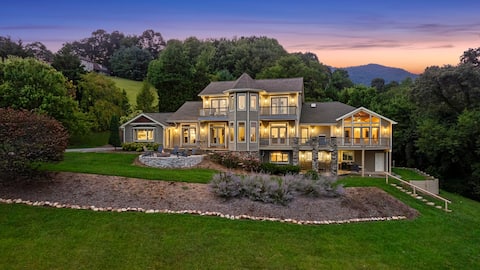
Blue Mountain View by CM | Cozy Fire Pit & Hot Tub
Entire Place • 5 bedrooms
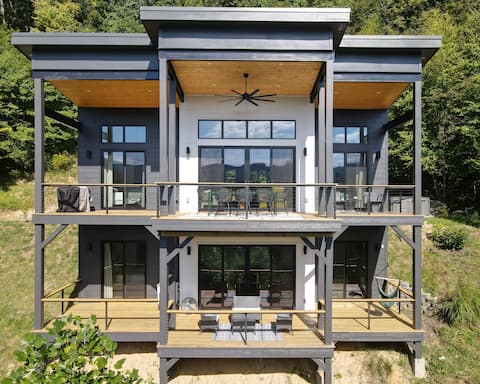
7Ridge - Hot Tub & Stunning View
Entire Place • 4 bedrooms
Misty Mountain for Breathtaking Views!
Entire Place • 5 bedrooms
3 Luxury Homes-Riverfront-500 Acres-Group B 10BR’s
Entire Place • 10 bedrooms
Note: Performance varies based on location, size, amenities, seasonality, and management quality. Data reflects the past 12 months.
Top Performing Airbnb Hosts in Clyde (2026)
Learn from the best! This table showcases top-performing Airbnb hosts in Clyde based on the number of properties managed and estimated total revenue over the past year. Analyze their scale and performance metrics.
| Host Name | Properties | Grossing Revenue | Stay Reviews | Avg Rating |
|---|---|---|---|---|
| Cheryl | 10 | $306,302 | 1491 | 4.87/5.0 |
| Matt | 8 | $258,613 | 804 | 4.94/5.0 |
| Ilana And Mike | 2 | $218,887 | 11 | 5.00/5.0 |
| Nora | 1 | $157,083 | 37 | 5.00/5.0 |
| Julie | 2 | $119,382 | 428 | 4.95/5.0 |
| Carolina Mornings | 1 | $111,579 | 34 | 4.91/5.0 |
| Ryan | 1 | $82,135 | 42 | 5.00/5.0 |
| Inspired Getaway | 1 | $81,151 | 17 | 4.71/5.0 |
| Krista | 1 | $72,594 | 356 | 4.99/5.0 |
| Peter | 2 | $72,243 | 487 | 4.96/5.0 |
Analyzing the strategies of top hosts, such as their property selection, pricing, and guest communication, can offer valuable lessons for optimizing your own Airbnb operations in Clyde.
Dive Deeper: Advanced Clyde STR Market Data (2026)
Ready to unlock more insights? AirROI provides access to advanced metrics and comprehensive Airbnb data for Clyde. Explore detailed analytics beyond this report to refine your investment strategy, optimize pricing, and maximize your vacation rental profits.
Explore Advanced MetricsClyde Short-Term Rental Market Composition (2026): Property & Room Types
Room Type Distribution
Property Type Distribution
Market Composition Insights for Clyde
- The Clyde Airbnb market composition is heavily skewed towards Entire Home/Apt listings, which make up 94.3% of the 87 active rentals. This indicates strong guest preference for privacy and space.
- Looking at the property type distribution in Clyde, House properties are the most common (40.2%), reflecting the local real estate landscape.
- Houses represent a significant 40.2% portion, catering likely to families or larger groups.
- The presence of 9.2% Hotel/Boutique listings indicates integration with traditional hospitality.
- Smaller segments like apartment/condo, others (combined 3.4%) offer potential for unique stay experiences.
Clyde Airbnb Room Capacity Analysis (2026): Bedroom Distribution
Distribution of Listings by Number of Bedrooms
Room Capacity Insights for Clyde
- The dominant room capacity in Clyde is 2 bedrooms listings, making up 29.9% of the market. This suggests a strong demand for properties suitable for couples or solo travelers.
- Together, 2 bedrooms and 1 bedroom properties represent 57.5% of the active Airbnb listings in Clyde, indicating a high concentration in these sizes.
- A significant 33.2% of listings offer 3+ bedrooms, catering to larger groups and families seeking more space in Clyde.
Clyde Vacation Rental Guest Capacity Trends (2026)
Distribution of Listings by Guest Capacity
Guest Capacity Insights for Clyde
- The most common guest capacity trend in Clyde vacation rentals is listings accommodating 4 guests (23%). This suggests the primary traveler segment is likely small families or groups.
- Properties designed for 4 guests and 8+ guests dominate the Clyde STR market, accounting for 44.8% of listings.
- 40.2% of properties accommodate 6+ guests, serving the market segment for larger families or group travel in Clyde.
- On average, properties in Clyde are equipped to host 4.7 guests.
Clyde Airbnb Booking Patterns (2026): Available vs. Booked Days
Available Days Distribution
Booked Days Distribution
Booking Pattern Insights for Clyde
- The most common availability pattern in Clyde falls within the 271-366 days range, representing 44.8% of listings. This suggests many properties have significant open periods on their calendars.
- Approximately 86.2% of listings show high availability (181+ days open annually), indicating potential for increased bookings or specific owner usage patterns.
- For booked days, the 91-180 days range is most frequent in Clyde (41.4%), reflecting common guest stay durations or potential owner blocking patterns.
- A notable 14.9% of properties secure long booking periods (181+ days booked per year), highlighting successful long-term rental strategies or significant owner usage.
Clyde Airbnb Minimum Stay Requirements Analysis
Distribution of Listings by Minimum Night Requirement
1 Night
29 listings
33.3% of total
2 Nights
30 listings
34.5% of total
3 Nights
5 listings
5.7% of total
4-6 Nights
1 listings
1.1% of total
30+ Nights
22 listings
25.3% of total
Key Insights
- The most prevalent minimum stay requirement in Clyde is 2 Nights, adopted by 34.5% of listings. This highlights the market's preference for shorter, flexible bookings.
- A strong majority (67.8%) of the Clyde Airbnb data shows acceptance of very short stays (1-2 nights), indicating a dynamic, high-turnover market.
- A significant segment (25.3%) caters to monthly stays (30+ nights) in Clyde, pointing to opportunities in the extended-stay market.
Recommendations
- Align with the market by considering a 2 Nights minimum stay, as 34.5% of Clyde hosts use this setting.
- Explore offering discounts for stays of 30+ nights to attract the 25.3% of the market seeking extended stays.
- Adjust minimum nights based on seasonality – potentially shorter during low season and longer during peak demand periods in Clyde.
Clyde Airbnb Cancellation Policy Trends Analysis (2026)
Super Strict 30 Days
3 listings
3.4% of total
Super Strict 60 Days
1 listings
1.1% of total
Flexible
20 listings
23% of total
Moderate
25 listings
28.7% of total
Firm
24 listings
27.6% of total
Strict
14 listings
16.1% of total
Cancellation Policy Insights for Clyde
- The prevailing Airbnb cancellation policy trend in Clyde is Moderate, used by 28.7% of listings.
- There's a relatively balanced mix between guest-friendly (51.7%) and stricter (43.7%) policies, offering choices for different guest needs.
Recommendations for Hosts
- Consider adopting a Moderate policy to align with the 28.7% market standard in Clyde.
- Regularly review your cancellation policy against competitors and market demand shifts in Clyde.
Clyde STR Booking Lead Time Analysis (2026)
Average Booking Lead Time by Month
Booking Lead Time Insights for Clyde
- The overall average booking lead time for vacation rentals in Clyde is 47 days.
- Guests book furthest in advance for stays during October (average 65 days), likely coinciding with peak travel demand or local events.
- The shortest booking windows occur for stays in March (average 28 days), indicating more last-minute travel plans during this time.
- Seasonally, Fall (58 days avg.) sees the longest lead times, while Spring (41 days avg.) has the shortest, reflecting typical travel planning cycles.
Recommendations for Hosts
- Use the overall average lead time (47 days) as a baseline for your pricing and availability strategy in Clyde.
- For October stays, consider implementing length-of-stay discounts or slightly higher rates for bookings made less than 65 days out to capitalize on advance planning.
- Target marketing efforts for the Fall season well in advance (at least 58 days) to capture early planners.
- Monitor your own booking lead times against these Clyde averages to identify opportunities for dynamic pricing adjustments.
Popular & Essential Airbnb Amenities in Clyde (2026)
Amenity Prevalence
Amenity Insights for Clyde
- Essential amenities in Clyde that guests expect include: Free parking on premises, Heating, Smoke alarm, Wifi. Lacking these (any) could significantly impact bookings.
- Popular amenities like Air conditioning, Refrigerator, Dishes and silverware are common but not universal. Offering these can provide a competitive edge.
Recommendations for Hosts
- Ensure your listing includes all essential amenities for Clyde: Free parking on premises, Heating, Smoke alarm, Wifi.
- Prioritize adding missing essentials: Free parking on premises, Heating, Smoke alarm, Wifi.
- Consider adding popular differentiators like Air conditioning or Refrigerator to increase appeal.
- Highlight unique or less common amenities you offer (e.g., hot tub, dedicated workspace, EV charger) in your listing description and photos.
- Regularly check competitor amenities in Clyde to stay competitive.
Clyde Airbnb Guest Demographics & Profile Analysis (2026)
Guest Profile Summary for Clyde
- The typical guest profile for Airbnb in Clyde consists of primarily domestic travelers (98%), often arriving from nearby Charlotte, typically belonging to the Post-2000s (Gen Z/Alpha) group (50%), primarily speaking English or Spanish.
- Domestic travelers account for 97.8% of guests.
- Key international markets include United States (97.8%) and United Kingdom (0.5%).
- Top languages spoken are English (71.6%) followed by Spanish (9.7%).
- A significant demographic segment is the Post-2000s (Gen Z/Alpha) group, representing 50% of guests.
Recommendations for Hosts
- Target domestic marketing efforts towards travelers from Charlotte and Charleston.
- Tailor amenities and listing descriptions to appeal to the dominant Post-2000s (Gen Z/Alpha) demographic (e.g., highlight fast WiFi, smart home features, local guides).
- Highlight unique local experiences or amenities relevant to the primary guest profile.
- Consider seasonal promotions aligned with peak travel times for key origin markets.
Nearby Short-Term Rental Market Comparison
How does the Clyde Airbnb market stack up against its neighbors? Compare key performance metrics like average monthly revenue, ADR, and occupancy rates in surrounding areas to understand the broader regional STR landscape.
| Market | Active Properties | Monthly Revenue | Daily Rate | Avg. Occupancy |
|---|---|---|---|---|
| Sevier County | 68 | $7,108 | $567.95 | 44% |
| Catawba | 16 | $6,093 | $582.49 | 38% |
| Union Mills | 15 | $4,938 | $442.76 | 41% |
| Sevierville | 6,269 | $4,747 | $370.20 | 46% |
| Six Mile | 57 | $4,396 | $449.78 | 42% |
| Gatlinburg | 3,565 | $4,385 | $353.70 | 45% |
| Commerce | 19 | $4,298 | $285.34 | 45% |
| Pigeon Forge | 2,938 | $4,158 | $337.10 | 45% |
| West Union | 30 | $4,126 | $564.92 | 32% |
| Sautee | 14 | $4,105 | $408.17 | 39% |