Charlotte Airbnb Market Analysis 2026: Short Term Rental Data & Vacation Rental Statistics in North Carolina, United States
Is Airbnb profitable in Charlotte in 2026? Explore comprehensive Airbnb analytics for Charlotte, North Carolina, United States to uncover income potential. This 2026 STR market report for Charlotte, based on AirROI data from February 2025 to January 2026, reveals key trends in the bustling market of 3,148 active listings.
Whether you're considering an Airbnb investment in Charlotte, optimizing your existing vacation rental, or exploring rental arbitrage opportunities, understanding the Charlotte Airbnb data is crucial. Leveraging the low regulation environment is key to maximizing your short term rental income potential. Let's dive into the specifics.
Key Charlotte Airbnb Performance Metrics Overview
Monthly Airbnb Revenue Variations & Income Potential in Charlotte (2026)
Understanding the monthly revenue variations for Airbnb listings in Charlotte is key to maximizing your short term rental income potential. Seasonality significantly impacts earnings. Our analysis, based on data from the past 12 months, shows that the peak revenue month for STRs in Charlotte is typically July, while January often presents the lowest earnings, highlighting opportunities for strategic pricing adjustments during shoulder and low seasons. Explore the typical Airbnb income in Charlotte across different performance tiers:
- Best-in-class properties (Top 10%) achieve $5,753+ monthly, often utilizing dynamic pricing and superior guest experiences.
- Strong performing properties (Top 25%) earn $3,770 or more, indicating effective management and desirable locations/amenities.
- Typical properties (Median) generate around $2,365 per month, representing the average market performance.
- Entry-level properties (Bottom 25%) see earnings around $1,187, often with potential for optimization.
Average Monthly Airbnb Earnings Trend in Charlotte
Charlotte Airbnb Occupancy Rate Trends (2026)
Maximize your bookings by understanding the Charlotte STR occupancy trends. Seasonal demand shifts significantly influence how often properties are booked. Typically, Marchsees the highest demand (peak season occupancy), while January experiences the lowest (low season). Effective strategies, like adjusting minimum stays or offering promotions, can boost occupancy during slower periods. Here's how different property tiers perform in Charlotte:
- Best-in-class properties (Top 10%) achieve 81%+ occupancy, indicating high desirability and potentially optimized availability.
- Strong performing properties (Top 25%) maintain 65% or higher occupancy, suggesting good market fit and guest satisfaction.
- Typical properties (Median) have an occupancy rate around 45%.
- Entry-level properties (Bottom 25%) average 25% occupancy, potentially facing higher vacancy.
Average Monthly Occupancy Rate Trend in Charlotte
Average Daily Rate (ADR) Airbnb Trends in Charlotte (2026)
Effective short term rental pricing strategy in Charlotte involves understanding monthly ADR fluctuations. The Average Daily Rate (ADR) for Airbnb in Charlotte typically peaks in October and dips lowest during February. Leveraging Airbnb dynamic pricing tools or strategies based on this seasonality can significantly boost revenue. Here's a look at the typical nightly rates achieved:
- Best-in-class properties (Top 10%) command rates of $342+ per night, often due to premium features or locations.
- Strong performing properties (Top 25%) achieve nightly rates of $236 or more.
- Typical properties (Median) charge around $166 per night.
- Entry-level properties (Bottom 25%) earn around $113 per night.
Average Daily Rate (ADR) Trend by Month in Charlotte
Get Live Charlotte Market Intelligence 👇

Explore Real-time Analytics
Airbnb Seasonality Analysis & Trends in Charlotte (2026)
Peak Season (July, October, June)
- Revenue averages $3,400 per month
- Occupancy rates average 48.7%
- Daily rates average $208
Shoulder Season
- Revenue averages $2,980 per month
- Occupancy maintains around 45.7%
- Daily rates hold near $202
Low Season (January, February, April)
- Revenue drops to average $2,326 per month
- Occupancy decreases to average 42.0%
- Daily rates adjust to average $186
Seasonality Insights for Charlotte
- The Airbnb seasonality in Charlotte shows moderate seasonality with distinct peak and low periods. While the sections above show seasonal averages, it's also insightful to look at the extremes:
- During the high season, the absolute peak month showcases Charlotte's highest earning potential, with monthly revenues capable of climbing to $3,475, occupancy reaching a high of 51.1%, and ADRs peaking at $223.
- Conversely, the slowest single month of the year, typically falling within the low season, marks the market's lowest point. In this month, revenue might dip to $2,162, occupancy could drop to 33.9%, and ADRs may adjust down to $174.
- Understanding both the seasonal averages and these monthly peaks and troughs in revenue, occupancy, and ADR is crucial for maximizing your Airbnb profit potential in Charlotte.
Seasonal Strategies for Maximizing Profit
- Peak Season: Maximize revenue through premium pricing and potentially longer minimum stays. Ensure high availability.
- Low Season: Offer competitive pricing, special promotions (e.g., extended stay discounts), and flexible cancellation policies. Target off-season travelers like remote workers or budget-conscious guests.
- Shoulder Seasons: Implement dynamic pricing that balances peak and low rates. Target weekend travelers or specific events. Offer slightly more flexible terms than peak season.
- Regularly analyze your own performance against these Charlotte seasonality benchmarks and adjust your pricing and availability strategy accordingly.
Best Areas for Airbnb Investment in Charlotte (2026)
Exploring the top neighborhoods for short-term rentals in Charlotte? This section highlights key areas, outlining why they are attractive for hosts and guests, along with notable local attractions. Consider these locations based on your target guest profile and investment strategy.
| Neighborhood / Area | Why Host Here? (Target Guests & Appeal) | Key Attractions & Landmarks |
|---|---|---|
| Uptown | Charlotte's central business district, known for its vibrant atmosphere, restaurants, and shopping. Ideal for business travelers and tourists looking to explore the city's culture and nightlife. | NASCAR Hall of Fame, Discovery Place Science, Charlotte Convention Center, Bank of America Corporate Center, EpiCentre |
| South End | A trendy neighborhood known for its art galleries, craft breweries, and proximity to the light rail. Favored by young professionals and those seeking a lively urban environment. | Rail Trail, SouthEnd Brewery District, Bland Street Station, Enderly Park, Charlotte Regional Farmers Market |
| Dilworth | A charming historic neighborhood with beautiful tree-lined streets and an array of dining options. Great for families and visitors who enjoy a quieter atmosphere close to the city. | Latta Park, Dilworth Artisan Station, Basil Park, Little Sugar Creek Greenway, Charlotte's Historic Homes |
| NoDa | Charlotte's historic arts district filled with colorful murals, music venues, and eclectic shops. Attracts artists and those seeking an artistic experience. | NoDa Brewing Company, Neighborhood Theatre, Arts District, Smoky Joe's, The Fillmore Charlotte |
| Ballantyne | An upscale suburban community with luxury amenities, golf courses, and shopping. Ideal for families and those looking for a peaceful retreat not far from the city center. | Ballantyne Village, The Ballantyne Hotel, Skyzone Trampoline Park, Ballantyne Community Park, McAlpine Creek Park |
| University City | Home to the University of North Carolina at Charlotte, this area is popular with students and faculty, offering a mix of entertainment and dining options. | UNC Charlotte Botanical Gardens, The Light Rail, Reedy Creek Park, University Place, Charlotte Motor Speedway |
| East Charlotte | A diverse area with a mix of cultures and cuisines, ideal for travelers looking for unique local experiences and food. | Eastland Mall, Independence Boulevard, Charlotte Nature Museum, Mint Hill Historic Preservation, The Grove |
| West Charlotte | An up-and-coming area with a focus on community and development, offering a mix of historical sites and new constructions. | Carolina Treetop Challenge, Huntington Park, Charlotte Premium Outlets, Camp North End, The Charlotte Rugby Club |
Understanding Airbnb License Requirements & STR Laws in Charlotte (2026)
While Charlotte, North Carolina, United States currently shows low STR regulations, specific Airbnb license requirements might still exist or change. Always verify the latest short term rental regulations and Airbnb license requirements directly with local government authorities for Charlotte to ensure full compliance before hosting.
(Source: AirROI data, 2026, based on 0% licensed listings)
Top Performing Airbnb Properties in Charlotte (2026)
Benchmark your potential! Explore examples of top-performing Airbnb properties in Charlottebased on Trailing Twelve Month (TTM) revenue. Analyze their characteristics, revenue, occupancy rate, and ADR to understand what drives success in this market.
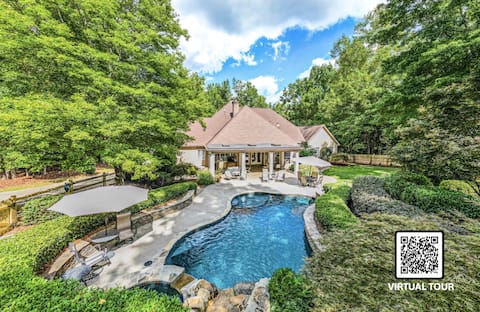
LUX Resort Like Villa|Pool|Hot Tub|2 Game Rooms
Entire Place • 6 bedrooms

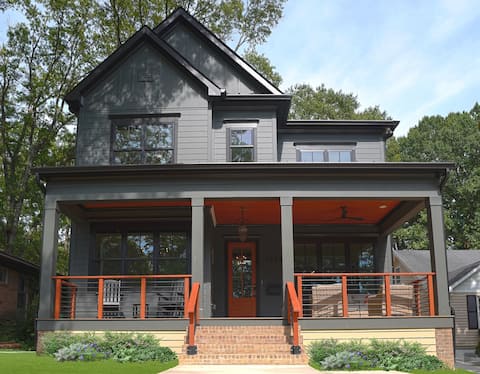
Large Luxury Downtown Home | 5,000 SQFT, Sleeps 24
Entire Place • 8 bedrooms
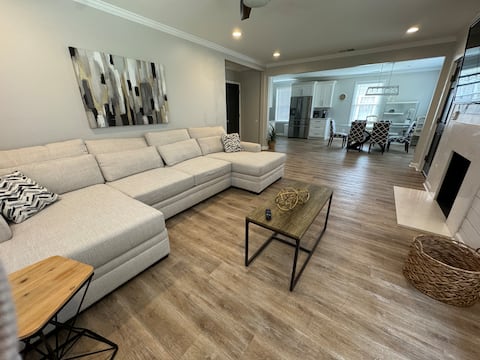
Lux Farmhouse6 bedrooms, 6 baths, firepit, gym
Entire Place • 6 bedrooms

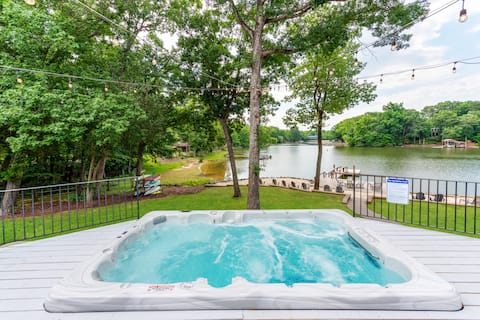
8BR Near Southend/Uptown w/GameRoom/HotTubs/Fenced
Entire Place • 8 bedrooms
Central 5BR House in uptown CLT
Entire Place • 5 bedrooms
Modern 6BR Estate w/ Heat Pool, Beach, Boat option
Entire Place • 6 bedrooms
Note: Performance varies based on location, size, amenities, seasonality, and management quality. Data reflects the past 12 months.
Top Performing Airbnb Hosts in Charlotte (2026)
Learn from the best! This table showcases top-performing Airbnb hosts in Charlotte based on the number of properties managed and estimated total revenue over the past year. Analyze their scale and performance metrics.
| Host Name | Properties | Grossing Revenue | Stay Reviews | Avg Rating |
|---|---|---|---|---|
| Doug | 56 | $1,681,856 | 3289 | 4.85/5.0 |
| Michael | 35 | $1,665,313 | 2857 | 4.92/5.0 |
| Edward | 25 | $1,502,445 | 1976 | 4.95/5.0 |
| Victor | 37 | $1,445,034 | 4066 | 4.76/5.0 |
| Bowen | 49 | $1,272,860 | 2391 | 4.52/5.0 |
| Shirley | 37 | $1,191,485 | 2307 | 4.90/5.0 |
| Lance | 38 | $1,082,975 | 2005 | 4.77/5.0 |
| The Simply Home Host Company | 11 | $1,013,176 | 563 | 4.87/5.0 |
| Ryley | 20 | $1,007,096 | 926 | 4.79/5.0 |
| Mary | 11 | $1,006,686 | 990 | 4.80/5.0 |
Analyzing the strategies of top hosts, such as their property selection, pricing, and guest communication, can offer valuable lessons for optimizing your own Airbnb operations in Charlotte.
Dive Deeper: Advanced Charlotte STR Market Data (2026)
Ready to unlock more insights? AirROI provides access to advanced metrics and comprehensive Airbnb data for Charlotte. Explore detailed analytics beyond this report to refine your investment strategy, optimize pricing, and maximize your vacation rental profits.
Explore Advanced MetricsCharlotte Short-Term Rental Market Composition (2026): Property & Room Types
Room Type Distribution
Property Type Distribution
Market Composition Insights for Charlotte
- The Charlotte Airbnb market composition is heavily skewed towards Entire Home/Apt listings, which make up 84.2% of the 3,148 active rentals. This indicates strong guest preference for privacy and space.
- Looking at the property type distribution in Charlotte, House properties are the most common (66.9%), reflecting the local real estate landscape.
- Houses represent a significant 66.9% portion, catering likely to families or larger groups.
- Smaller segments like hotel/boutique, others, outdoor/unique, unique stays (combined 6.8%) offer potential for unique stay experiences.
Charlotte Airbnb Room Capacity Analysis (2026): Bedroom Distribution
Distribution of Listings by Number of Bedrooms
Room Capacity Insights for Charlotte
- The dominant room capacity in Charlotte is 3 bedrooms listings, making up 25.2% of the market. This suggests a strong demand for properties suitable for families or small groups.
- Together, 3 bedrooms and 2 bedrooms properties represent 47.9% of the active Airbnb listings in Charlotte, indicating a high concentration in these sizes.
- A significant 40.3% of listings offer 3+ bedrooms, catering to larger groups and families seeking more space in Charlotte.
Charlotte Vacation Rental Guest Capacity Trends (2026)
Distribution of Listings by Guest Capacity
Guest Capacity Insights for Charlotte
- The most common guest capacity trend in Charlotte vacation rentals is listings accommodating 8+ guests (23%). This suggests the primary traveler segment is likely larger groups.
- Properties designed for 8+ guests and 4 guests dominate the Charlotte STR market, accounting for 41.6% of listings.
- 44.6% of properties accommodate 6+ guests, serving the market segment for larger families or group travel in Charlotte.
- On average, properties in Charlotte are equipped to host 4.6 guests.
Charlotte Airbnb Booking Patterns (2026): Available vs. Booked Days
Available Days Distribution
Booked Days Distribution
Booking Pattern Insights for Charlotte
- The most common availability pattern in Charlotte falls within the 271-366 days range, representing 39.3% of listings. This suggests many properties have significant open periods on their calendars.
- Approximately 74.9% of listings show high availability (181+ days open annually), indicating potential for increased bookings or specific owner usage patterns.
- For booked days, the 91-180 days range is most frequent in Charlotte (36.2%), reflecting common guest stay durations or potential owner blocking patterns.
- A notable 26.6% of properties secure long booking periods (181+ days booked per year), highlighting successful long-term rental strategies or significant owner usage.
Charlotte Airbnb Minimum Stay Requirements Analysis
Distribution of Listings by Minimum Night Requirement
1 Night
889 listings
28.3% of total
2 Nights
717 listings
22.8% of total
3 Nights
180 listings
5.7% of total
4-6 Nights
163 listings
5.2% of total
7-29 Nights
274 listings
8.7% of total
30+ Nights
923 listings
29.3% of total
Key Insights
- The most prevalent minimum stay requirement in Charlotte is 30+ Nights, adopted by 29.3% of listings. This highlights the market's preference for longer commitments.
- A significant segment (29.3%) caters to monthly stays (30+ nights) in Charlotte, pointing to opportunities in the extended-stay market.
Recommendations
- Align with the market by considering a 30+ Nights minimum stay, as 29.3% of Charlotte hosts use this setting.
- If feasible, allowing 1-night stays, especially midweek or during low season, could capture last-minute bookings, as only 28.3% currently do.
- Explore offering discounts for stays of 30+ nights to attract the 29.3% of the market seeking extended stays.
- Adjust minimum nights based on seasonality – potentially shorter during low season and longer during peak demand periods in Charlotte.
Charlotte Airbnb Cancellation Policy Trends Analysis (2026)
Super Strict 60 Days
5 listings
0.2% of total
Super Strict 30 Days
93 listings
3% of total
Limited
81 listings
2.6% of total
Flexible
544 listings
17.3% of total
Moderate
906 listings
28.8% of total
Firm
1132 listings
36% of total
Strict
380 listings
12.1% of total
Cancellation Policy Insights for Charlotte
- The prevailing Airbnb cancellation policy trend in Charlotte is Firm, used by 36% of listings.
- There's a relatively balanced mix between guest-friendly (46.1%) and stricter (48.1%) policies, offering choices for different guest needs.
Recommendations for Hosts
- Consider adopting a Firm policy to align with the 36% market standard in Charlotte.
- Using a Strict policy might deter some guests, as only 12.1% of listings use it. Evaluate if potential revenue protection outweighs possible lower booking rates.
- Regularly review your cancellation policy against competitors and market demand shifts in Charlotte.
Charlotte STR Booking Lead Time Analysis (2026)
Average Booking Lead Time by Month
Booking Lead Time Insights for Charlotte
- The overall average booking lead time for vacation rentals in Charlotte is 30 days.
- Guests book furthest in advance for stays during May (average 49 days), likely coinciding with peak travel demand or local events.
- The shortest booking windows occur for stays in February (average 21 days), indicating more last-minute travel plans during this time.
- Seasonally, Fall (36 days avg.) sees the longest lead times, while Winter (23 days avg.) has the shortest, reflecting typical travel planning cycles.
Recommendations for Hosts
- Use the overall average lead time (30 days) as a baseline for your pricing and availability strategy in Charlotte.
- For May stays, consider implementing length-of-stay discounts or slightly higher rates for bookings made less than 49 days out to capitalize on advance planning.
- Target marketing efforts for the Fall season well in advance (at least 36 days) to capture early planners.
- Monitor your own booking lead times against these Charlotte averages to identify opportunities for dynamic pricing adjustments.
Popular & Essential Airbnb Amenities in Charlotte (2026)
Amenity Prevalence
Amenity Insights for Charlotte
- Essential amenities in Charlotte that guests expect include: Wifi, Air conditioning, Smoke alarm, TV, Heating. Lacking these (any) could significantly impact bookings.
- Popular amenities like Free parking on premises, Kitchen, Carbon monoxide alarm are common but not universal. Offering these can provide a competitive edge.
Recommendations for Hosts
- Ensure your listing includes all essential amenities for Charlotte: Wifi, Air conditioning, Smoke alarm, TV, Heating.
- Prioritize adding missing essentials: Wifi, Air conditioning, Smoke alarm, TV, Heating.
- Consider adding popular differentiators like Free parking on premises or Kitchen to increase appeal.
- Highlight unique or less common amenities you offer (e.g., hot tub, dedicated workspace, EV charger) in your listing description and photos.
- Regularly check competitor amenities in Charlotte to stay competitive.
Charlotte Airbnb Guest Demographics & Profile Analysis (2026)
Guest Profile Summary for Charlotte
- The typical guest profile for Airbnb in Charlotte consists of primarily domestic travelers (96%), often arriving from nearby Charlotte, typically belonging to the Post-2000s (Gen Z/Alpha) group (50%), primarily speaking English or Spanish.
- Domestic travelers account for 95.5% of guests.
- Key international markets include United States (95.5%) and DC (0.8%).
- Top languages spoken are English (72.8%) followed by Spanish (14.5%).
- A significant demographic segment is the Post-2000s (Gen Z/Alpha) group, representing 50% of guests.
Recommendations for Hosts
- Target domestic marketing efforts towards travelers from Charlotte and Raleigh.
- Tailor amenities and listing descriptions to appeal to the dominant Post-2000s (Gen Z/Alpha) demographic (e.g., highlight fast WiFi, smart home features, local guides).
- Highlight unique local experiences or amenities relevant to the primary guest profile.
- Consider seasonal promotions aligned with peak travel times for key origin markets.
Nearby Short-Term Rental Market Comparison
How does the Charlotte Airbnb market stack up against its neighbors? Compare key performance metrics like average monthly revenue, ADR, and occupancy rates in surrounding areas to understand the broader regional STR landscape.
| Market | Active Properties | Monthly Revenue | Daily Rate | Avg. Occupancy |
|---|---|---|---|---|
| Denver | 109 | $6,309 | $590.96 | 45% |
| Catawba | 16 | $6,093 | $582.49 | 38% |
| Mooresville | 369 | $5,702 | $559.93 | 42% |
| Sherrills Ford | 107 | $5,615 | $547.26 | 41% |
| Troutman | 49 | $5,587 | $467.90 | 42% |
| Lake Norman of Catawba | 51 | $4,972 | $513.30 | 43% |
| Chapin | 93 | $3,971 | $386.37 | 43% |
| Semora | 50 | $3,408 | $377.45 | 38% |
| Watauga County | 47 | $3,370 | $314.71 | 39% |
| Nebo | 88 | $3,330 | $381.79 | 34% |