Chapel Hill Airbnb Market Analysis 2026: Short Term Rental Data & Vacation Rental Statistics in North Carolina, United States
Is Airbnb profitable in Chapel Hill in 2026? Explore comprehensive Airbnb analytics for Chapel Hill, North Carolina, United States to uncover income potential. This 2026 STR market report for Chapel Hill, based on AirROI data from February 2025 to January 2026, reveals key trends in the market of 277 active listings.
Whether you're considering an Airbnb investment in Chapel Hill, optimizing your existing vacation rental, or exploring rental arbitrage opportunities, understanding the Chapel Hill Airbnb data is crucial. Leveraging the low regulation environment is key to maximizing your short term rental income potential. Let's dive into the specifics.
Key Chapel Hill Airbnb Performance Metrics Overview
Monthly Airbnb Revenue Variations & Income Potential in Chapel Hill (2026)
Understanding the monthly revenue variations for Airbnb listings in Chapel Hill is key to maximizing your short term rental income potential. Seasonality significantly impacts earnings. Our analysis, based on data from the past 12 months, shows that the peak revenue month for STRs in Chapel Hill is typically October, while January often presents the lowest earnings, highlighting opportunities for strategic pricing adjustments during shoulder and low seasons. Explore the typical Airbnb income in Chapel Hill across different performance tiers:
- Best-in-class properties (Top 10%) achieve $5,899+ monthly, often utilizing dynamic pricing and superior guest experiences.
- Strong performing properties (Top 25%) earn $3,642 or more, indicating effective management and desirable locations/amenities.
- Typical properties (Median) generate around $2,195 per month, representing the average market performance.
- Entry-level properties (Bottom 25%) see earnings around $1,151, often with potential for optimization.
Average Monthly Airbnb Earnings Trend in Chapel Hill
Chapel Hill Airbnb Occupancy Rate Trends (2026)
Maximize your bookings by understanding the Chapel Hill STR occupancy trends. Seasonal demand shifts significantly influence how often properties are booked. Typically, Julysees the highest demand (peak season occupancy), while January experiences the lowest (low season). Effective strategies, like adjusting minimum stays or offering promotions, can boost occupancy during slower periods. Here's how different property tiers perform in Chapel Hill:
- Best-in-class properties (Top 10%) achieve 85%+ occupancy, indicating high desirability and potentially optimized availability.
- Strong performing properties (Top 25%) maintain 71% or higher occupancy, suggesting good market fit and guest satisfaction.
- Typical properties (Median) have an occupancy rate around 48%.
- Entry-level properties (Bottom 25%) average 26% occupancy, potentially facing higher vacancy.
Average Monthly Occupancy Rate Trend in Chapel Hill
Average Daily Rate (ADR) Airbnb Trends in Chapel Hill (2026)
Effective short term rental pricing strategy in Chapel Hill involves understanding monthly ADR fluctuations. The Average Daily Rate (ADR) for Airbnb in Chapel Hill typically peaks in October and dips lowest during February. Leveraging Airbnb dynamic pricing tools or strategies based on this seasonality can significantly boost revenue. Here's a look at the typical nightly rates achieved:
- Best-in-class properties (Top 10%) command rates of $422+ per night, often due to premium features or locations.
- Strong performing properties (Top 25%) achieve nightly rates of $231 or more.
- Typical properties (Median) charge around $144 per night.
- Entry-level properties (Bottom 25%) earn around $95 per night.
Average Daily Rate (ADR) Trend by Month in Chapel Hill
Get Live Chapel Hill Market Intelligence 👇

Explore Real-time Analytics
Airbnb Seasonality Analysis & Trends in Chapel Hill (2026)
Peak Season (October, November, July)
- Revenue averages $3,511 per month
- Occupancy rates average 53.5%
- Daily rates average $229
Shoulder Season
- Revenue averages $2,906 per month
- Occupancy maintains around 47.5%
- Daily rates hold near $219
Low Season (January, February, March)
- Revenue drops to average $2,392 per month
- Occupancy decreases to average 46.0%
- Daily rates adjust to average $210
Seasonality Insights for Chapel Hill
- The Airbnb seasonality in Chapel Hill shows moderate seasonality with distinct peak and low periods. While the sections above show seasonal averages, it's also insightful to look at the extremes:
- During the high season, the absolute peak month showcases Chapel Hill's highest earning potential, with monthly revenues capable of climbing to $3,897, occupancy reaching a high of 55.6%, and ADRs peaking at $237.
- Conversely, the slowest single month of the year, typically falling within the low season, marks the market's lowest point. In this month, revenue might dip to $2,166, occupancy could drop to 40.4%, and ADRs may adjust down to $203.
- Understanding both the seasonal averages and these monthly peaks and troughs in revenue, occupancy, and ADR is crucial for maximizing your Airbnb profit potential in Chapel Hill.
Seasonal Strategies for Maximizing Profit
- Peak Season: Maximize revenue through premium pricing and potentially longer minimum stays. Ensure high availability.
- Low Season: Offer competitive pricing, special promotions (e.g., extended stay discounts), and flexible cancellation policies. Target off-season travelers like remote workers or budget-conscious guests.
- Shoulder Seasons: Implement dynamic pricing that balances peak and low rates. Target weekend travelers or specific events. Offer slightly more flexible terms than peak season.
- Regularly analyze your own performance against these Chapel Hill seasonality benchmarks and adjust your pricing and availability strategy accordingly.
Best Areas for Airbnb Investment in Chapel Hill (2026)
Exploring the top neighborhoods for short-term rentals in Chapel Hill? This section highlights key areas, outlining why they are attractive for hosts and guests, along with notable local attractions. Consider these locations based on your target guest profile and investment strategy.
| Neighborhood / Area | Why Host Here? (Target Guests & Appeal) | Key Attractions & Landmarks |
|---|---|---|
| Downtown Chapel Hill | The heart of Chapel Hill with a vibrant atmosphere, ideal for visitors looking to explore local shops and restaurants. Convenient access to the University of North Carolina campus and cultural events. | University of North Carolina, North Carolina Botanical Garden, Chapel Hill Farmer's Market, Morehead Planetarium and Science Center, Franklin Street |
| Historic District | Rich in history and charm, this area offers a unique look at Chapel Hill's past. Perfect for visitors interested in architecture and history, along with access to local arts. | Old Well, Chapel Hill Museum, Historic homes, Local art galleries, Renaissance Center |
| East Chapel Hill | A family-friendly area with spacious residences and parks, ideal for families and longer stays. Close to schools and recreational activities. | Umstead Park, Eastwood Lake, Shady Acres Park, Local schools, Playgrounds |
| Southern Village | An inviting community that offers a mix of dining, shopping, and entertainment options. Popular among families and young professionals, it hosts events year-round. | Southern Village Green, Cat's Cradle music venue, Local eateries, Shopping areas, Walking trails |
| Carrboro | Adjacent to Chapel Hill, Carrboro has a laid-back vibe with an artsy community and local festivals. It's a great area for visitors who enjoy a younger, creative atmosphere. | Carrboro Farmers Market, ArtsCenter, Local breweries, Live music venues, Bikes paths |
| University Place | A shopping and entertainment hub that attracts visitors for its brand stores, dining, and surrounding green spaces. Great for both short and long-term stays. | University Mall, Cinemas, Shopping outlets, Dining options, Parks |
| Pittsboro | A short drive from Chapel Hill, historically significant and known for its small-town charm. A perfect spot for visitors looking for tranquility and nature. | Fearrington Village, Haw River, Local wineries, Historical sites, Charming boutiques |
| Northside | A diverse, vibrant neighborhood with a mix of students and families, ideal for those seeking a lively atmosphere. Close to universities and local dining. | Local eateries, Basketball courts, Arts spaces, Cultural events, Community parks |
Understanding Airbnb License Requirements & STR Laws in Chapel Hill (2026)
While Chapel Hill, North Carolina, United States currently shows low STR regulations, specific Airbnb license requirements might still exist or change. Always verify the latest short term rental regulations and Airbnb license requirements directly with local government authorities for Chapel Hill to ensure full compliance before hosting.
(Source: AirROI data, 2026, finding no licensed listings among those analyzed)
Top Performing Airbnb Properties in Chapel Hill (2026)
Benchmark your potential! Explore examples of top-performing Airbnb properties in Chapel Hillbased on Trailing Twelve Month (TTM) revenue. Analyze their characteristics, revenue, occupancy rate, and ADR to understand what drives success in this market.
Proximity
Entire Place • 7 bedrooms
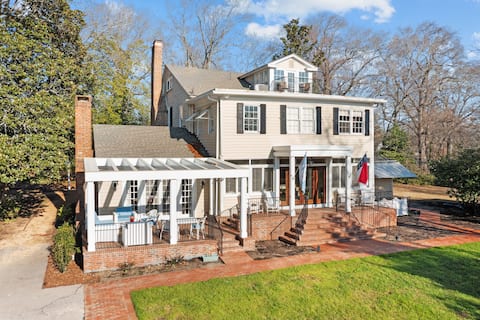
Historic Gem- Steps from UNC & on Franklin St
Entire Place • 5 bedrooms

Lake House B&B Luxurious Spacious Lakefront - Home
Entire Place • 5 bedrooms
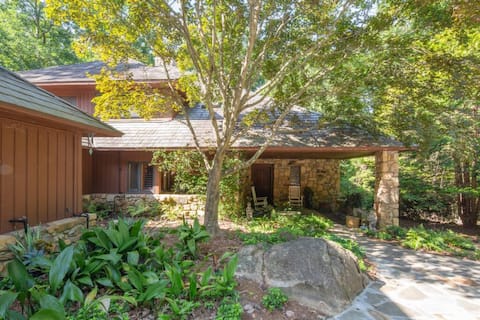
Spacious wooded retreat, every bedroom ensuite
Entire Place • 5 bedrooms

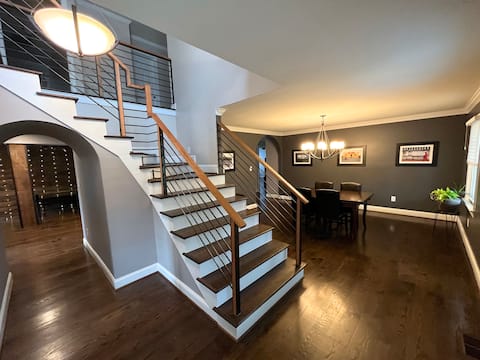
Stunning Mid-Century Gem Near Campus and Gardens
Entire Place • 5 bedrooms

White Oak Hill, minutes to UNC & Duke
Entire Place • 4 bedrooms
Note: Performance varies based on location, size, amenities, seasonality, and management quality. Data reflects the past 12 months.
Top Performing Airbnb Hosts in Chapel Hill (2026)
Learn from the best! This table showcases top-performing Airbnb hosts in Chapel Hill based on the number of properties managed and estimated total revenue over the past year. Analyze their scale and performance metrics.
| Host Name | Properties | Grossing Revenue | Stay Reviews | Avg Rating |
|---|---|---|---|---|
| Stephanie | 6 | $345,989 | 311 | 4.87/5.0 |
| Tyrell | 1 | $315,170 | 10 | 5.00/5.0 |
| Erin | 7 | $269,890 | 1126 | 4.87/5.0 |
| Sherry & David | 6 | $251,811 | 145 | 5.00/5.0 |
| Erin | 2 | $197,107 | 218 | 5.00/5.0 |
| Brad | 2 | $190,145 | 47 | 4.88/5.0 |
| Aj | 7 | $139,877 | 500 | 4.77/5.0 |
| Lyria And Stokely | 2 | $110,209 | 543 | 4.99/5.0 |
| Sheila | 4 | $108,859 | 55 | 4.90/5.0 |
| Brandon | 3 | $106,114 | 2165 | 4.94/5.0 |
Analyzing the strategies of top hosts, such as their property selection, pricing, and guest communication, can offer valuable lessons for optimizing your own Airbnb operations in Chapel Hill.
Dive Deeper: Advanced Chapel Hill STR Market Data (2026)
Ready to unlock more insights? AirROI provides access to advanced metrics and comprehensive Airbnb data for Chapel Hill. Explore detailed analytics beyond this report to refine your investment strategy, optimize pricing, and maximize your vacation rental profits.
Explore Advanced MetricsChapel Hill Short-Term Rental Market Composition (2026): Property & Room Types
Room Type Distribution
Property Type Distribution
Market Composition Insights for Chapel Hill
- The Chapel Hill Airbnb market composition is heavily skewed towards Entire Home/Apt listings, which make up 80.9% of the 277 active rentals. This indicates strong guest preference for privacy and space.
- Looking at the property type distribution in Chapel Hill, House properties are the most common (60.3%), reflecting the local real estate landscape.
- Houses represent a significant 60.3% portion, catering likely to families or larger groups.
- The presence of 6.1% Hotel/Boutique listings indicates integration with traditional hospitality.
Chapel Hill Airbnb Room Capacity Analysis (2026): Bedroom Distribution
Distribution of Listings by Number of Bedrooms
Room Capacity Insights for Chapel Hill
- The dominant room capacity in Chapel Hill is 1 bedroom listings, making up 28.5% of the market. This suggests a strong demand for properties suitable for couples or solo travelers.
- Together, 1 bedroom and 2 bedrooms properties represent 56.3% of the active Airbnb listings in Chapel Hill, indicating a high concentration in these sizes.
- A significant 24.5% of listings offer 3+ bedrooms, catering to larger groups and families seeking more space in Chapel Hill.
Chapel Hill Vacation Rental Guest Capacity Trends (2026)
Distribution of Listings by Guest Capacity
Guest Capacity Insights for Chapel Hill
- The most common guest capacity trend in Chapel Hill vacation rentals is listings accommodating 2 guests (20.6%). This suggests the primary traveler segment is likely couples or solo travelers.
- Properties designed for 2 guests and 4 guests dominate the Chapel Hill STR market, accounting for 37.6% of listings.
- 30.2% of properties accommodate 6+ guests, serving the market segment for larger families or group travel in Chapel Hill.
- On average, properties in Chapel Hill are equipped to host 3.8 guests.
Chapel Hill Airbnb Booking Patterns (2026): Available vs. Booked Days
Available Days Distribution
Booked Days Distribution
Booking Pattern Insights for Chapel Hill
- The most common availability pattern in Chapel Hill falls within the 271-366 days range, representing 37.2% of listings. This suggests many properties have significant open periods on their calendars.
- Approximately 70.4% of listings show high availability (181+ days open annually), indicating potential for increased bookings or specific owner usage patterns.
- For booked days, the 91-180 days range is most frequent in Chapel Hill (33.6%), reflecting common guest stay durations or potential owner blocking patterns.
- A notable 31.4% of properties secure long booking periods (181+ days booked per year), highlighting successful long-term rental strategies or significant owner usage.
Chapel Hill Airbnb Minimum Stay Requirements Analysis
Distribution of Listings by Minimum Night Requirement
1 Night
83 listings
30% of total
2 Nights
65 listings
23.5% of total
3 Nights
16 listings
5.8% of total
4-6 Nights
11 listings
4% of total
7-29 Nights
26 listings
9.4% of total
30+ Nights
76 listings
27.4% of total
Key Insights
- The most prevalent minimum stay requirement in Chapel Hill is 1 Night, adopted by 30% of listings. This highlights the market's preference for shorter, flexible bookings.
- A significant segment (27.4%) caters to monthly stays (30+ nights) in Chapel Hill, pointing to opportunities in the extended-stay market.
Recommendations
- Align with the market by considering a 1 Night minimum stay, as 30% of Chapel Hill hosts use this setting.
- Explore offering discounts for stays of 30+ nights to attract the 27.4% of the market seeking extended stays.
- Adjust minimum nights based on seasonality – potentially shorter during low season and longer during peak demand periods in Chapel Hill.
Chapel Hill Airbnb Cancellation Policy Trends Analysis (2026)
Super Strict 60 Days
7 listings
2.5% of total
Limited
10 listings
3.6% of total
Super Strict 30 Days
3 listings
1.1% of total
Flexible
49 listings
17.7% of total
Moderate
75 listings
27.1% of total
Firm
87 listings
31.4% of total
Strict
46 listings
16.6% of total
Cancellation Policy Insights for Chapel Hill
- The prevailing Airbnb cancellation policy trend in Chapel Hill is Firm, used by 31.4% of listings.
- There's a relatively balanced mix between guest-friendly (44.8%) and stricter (48.0%) policies, offering choices for different guest needs.
Recommendations for Hosts
- Consider adopting a Firm policy to align with the 31.4% market standard in Chapel Hill.
- Regularly review your cancellation policy against competitors and market demand shifts in Chapel Hill.
Chapel Hill STR Booking Lead Time Analysis (2026)
Average Booking Lead Time by Month
Booking Lead Time Insights for Chapel Hill
- The overall average booking lead time for vacation rentals in Chapel Hill is 46 days.
- Guests book furthest in advance for stays during May (average 84 days), likely coinciding with peak travel demand or local events.
- The shortest booking windows occur for stays in January (average 25 days), indicating more last-minute travel plans during this time.
- Seasonally, Fall (61 days avg.) sees the longest lead times, while Winter (32 days avg.) has the shortest, reflecting typical travel planning cycles.
Recommendations for Hosts
- Use the overall average lead time (46 days) as a baseline for your pricing and availability strategy in Chapel Hill.
- For May stays, consider implementing length-of-stay discounts or slightly higher rates for bookings made less than 84 days out to capitalize on advance planning.
- Target marketing efforts for the Fall season well in advance (at least 61 days) to capture early planners.
- Monitor your own booking lead times against these Chapel Hill averages to identify opportunities for dynamic pricing adjustments.
Popular & Essential Airbnb Amenities in Chapel Hill (2026)
Amenity Prevalence
Amenity Insights for Chapel Hill
- Essential amenities in Chapel Hill that guests expect include: Air conditioning, Wifi, Smoke alarm, Free parking on premises, Heating. Lacking these (any) could significantly impact bookings.
- Popular amenities like Hot water, Dishes and silverware, Essentials are common but not universal. Offering these can provide a competitive edge.
Recommendations for Hosts
- Ensure your listing includes all essential amenities for Chapel Hill: Air conditioning, Wifi, Smoke alarm, Free parking on premises, Heating.
- Prioritize adding missing essentials: Air conditioning, Wifi, Smoke alarm, Free parking on premises, Heating.
- Consider adding popular differentiators like Hot water or Dishes and silverware to increase appeal.
- Highlight unique or less common amenities you offer (e.g., hot tub, dedicated workspace, EV charger) in your listing description and photos.
- Regularly check competitor amenities in Chapel Hill to stay competitive.
Chapel Hill Airbnb Guest Demographics & Profile Analysis (2026)
Guest Profile Summary for Chapel Hill
- The typical guest profile for Airbnb in Chapel Hill consists of primarily domestic travelers (95%), often arriving from nearby Charlotte, typically belonging to the Post-2000s (Gen Z/Alpha) group (50%), primarily speaking English or Spanish.
- Domestic travelers account for 94.5% of guests.
- Key international markets include United States (94.5%) and DC (1.3%).
- Top languages spoken are English (65.7%) followed by Spanish (15.1%).
- A significant demographic segment is the Post-2000s (Gen Z/Alpha) group, representing 50% of guests.
Recommendations for Hosts
- Target domestic marketing efforts towards travelers from Charlotte and Chapel Hill.
- Tailor amenities and listing descriptions to appeal to the dominant Post-2000s (Gen Z/Alpha) demographic (e.g., highlight fast WiFi, smart home features, local guides).
- Highlight unique local experiences or amenities relevant to the primary guest profile.
- Consider seasonal promotions aligned with peak travel times for key origin markets.
Nearby Short-Term Rental Market Comparison
How does the Chapel Hill Airbnb market stack up against its neighbors? Compare key performance metrics like average monthly revenue, ADR, and occupancy rates in surrounding areas to understand the broader regional STR landscape.
| Market | Active Properties | Monthly Revenue | Daily Rate | Avg. Occupancy |
|---|---|---|---|---|
| Denver | 109 | $6,309 | $590.96 | 45% |
| Mooresville | 369 | $5,702 | $559.93 | 42% |
| Sherrills Ford | 107 | $5,615 | $547.26 | 41% |
| Troutman | 49 | $5,587 | $467.90 | 42% |
| Lake Norman of Catawba | 51 | $4,972 | $513.30 | 43% |
| Macon | 45 | $4,003 | $519.11 | 35% |
| Bracey | 51 | $3,814 | $470.46 | 35% |
| Semora | 50 | $3,408 | $377.45 | 38% |
| Boydton | 26 | $3,255 | $356.17 | 37% |
| Cornelius | 75 | $3,195 | $267.36 | 49% |